HIGHWAY GEOMETRY AND DRIVER PERFORMANCE
The geometric aspects of a highway include features that affect or relate to its operational quality and safety. These features, which are visible to the driver and affect driving performance, include elements of the roadways, ramps, and roadside. Roadways have features related to: roadway curvature (horizontal and vertical alignment); intersections and interchanges; cross sections (e.g., number of lanes and lane width, presence of shoulders and curbs); channelization and medians; and other miscellaneous elements (e.g., driveways, bridges). Ramps have features related to: type (e.g., freeway, arterial, entrance, exit); configuration (e.g., diamond, loop, trumpet, etc.); length; curvature; and other miscellaneous elements (e.g., speed-change lanes). Physical features of the roadside include: barriers (e.g., guide rails); obstacles (e.g., noise barriers, trees, signs); and other miscellaneous features (embankment slopes, ditches, etc.).
The evolution of geometric design standards and criteria dates back to the late 1930's. The American Association of State Highway and Transportation Officials (AASHTO) has been the source of most of the design values and criteria used in geometric highway design. Although most States and agencies have developed their own standards, the design approach and design values shown in the AASHTO policies are accepted by consensus and form the basis for individual State design practices. In addition, the FHWA has adopted the AASHTO policies for design and construction and major reconstruction of Federal-aid highways (Neuman, 1993). The most current AASHTO design policy reference was published in 1994, A Policy on Geometric Design of Highways and Streets.
AASHTO's highway design policies for sight distance, horizontal and vertical alignment, and associated traffic control devices are based on the following driver performance characteristics: detection and recognition time; perception-reaction time; decision and response time; time to perform brake and accelerator movements; maneuver time; and (if applicable) time to shift gears. However, these design standards have typically been based on driving performance (or surrogate driving measures) of the entire driving population, or have been formulated from research biased toward younger (college-age) as opposed to older driver groups. The models underlying these design standards have therefore not, as a rule, included variations to account for slower reaction time or other performance deficits consistently demonstrated in research on older driver response capabilities. In particular, diminished visual performance (acuity and contrast sensitivity), physical capability (strength to perform control movements and sensitivity to lateral force), cognitive performance (attentional deficits and declines in choice reaction time in responses to unpredictable stimuli), and perceptual abilities (accuracy of processing speed-distance information as required for gap judgments) combine to make the task of negotiating the highway design elements addressed in this section more effortful and less forgiving for older drivers.
The application of human factors in highway design is essential. Driving tasks of control, guidance, and navigation need to be considered in design. Control tasks include the driver's interaction with the vehicle and the lateral and longitudinal control of the vehicle through the steering wheel, accelerator, and brake. Guidance tasks include the driver's performance of selecting an appropriate and safe path on the highway, as well as driver evaluation of immediate conditions and decisions for control actions relating to lane changes, headways, overtaking, and speed change. Navigation includes the driver's execution of a trip, along the course of the highway, using information from maps, guide and information signs, and landmarks (Leisch, 1977).
A number of research efforts have examined the relationship between specific geometric design features and driving behavior measures of accident rates, speed profiles, and erratic behaviors. For the most part, data collected in these studies have not included demographic or travel behavior information about the drivers. Thus, only a very few of these studies have been able to use and study age group relationships in their analyses.
This section provides a discussion of studies that have examined the effects of geometric features on driving performance measures. The following topic areas are discussed: alignment (horizontal, vertical, and tangent); sight distance issues (especially relating to intersections); interchange/access control; and other physical features (e.g., number and width of lanes and shoulders, medians, railroad crossings, etc.).
Alignment
Research on the effects of geometric alignment and driving performance dates back over half a century. These studies have focused on horizontal and vertical curves, as well as the overall alignment of highway sections (including tangents). Horizontal alignment studies have focused on circular and spiral transition curve elements. Vertical curve studies have focused on grades and optimum sight distance characteristics, while tangent (and total average highway alignment) studies have focused on sight distance and operating speeds related to the entire length of the geometric features of the highway.
Horizontal Curves. Accidents on horizontal curves have been recognized as a considerable safety problem for many years. Accident studies indicate that curves experience a higher accident rate than tangents, with rates ranging from one-and-a-half, to three to four times higher than tangents (Glennon, Neuman, and Leisch, 1985; Zegeer, Stewart, Reinfurt, Council, Neuman, Hamilton, Miller, and Hunter, 1990; Neuman, 1992). Lerner and Sedney (1988) have reported anecdotal evidence that horizontal curves present problems for older drivers. Also, Lyles' (1993) analyses of accident data in Michigan has found that older drivers are much more likely to be involved in accident situations where the drivers were driving too fast for the curve or, more significantly, were surprised by the curved alignment. In a review of the literature aimed at modifying driver behavior on rural road curves, Johnston (1982) reported that horizontal curves that are below 600 m (1,968 ft) in radius on two-lane rural roads, and those requiring a substantial reduction in speed from that prevailing on the preceding tangent section were disproportionately represented among accident sites.
Successful curve negotiation depends upon the choice of appropriate approach speed and adequate lateral positioning through the curve. Many studies have shown that loss-of-control accidents result from an inability to maintain lateral position through the curve because of excessive speed, with inadequate deceleration in the approach zone; this stems from a combination of incorrect anticipatory behavior, induced by the prior speed environment, and inadequate perception of the demands of the curve.
Many studies report a relationship between horizontal curvature (and the degree of curvature) and the total percentage of accidents by geometric design feature on the highways. The reasons for these accidents are related to the following inadequate driving behaviors:
· Deficient skills in negotiating curves, especially those of more than 3 degrees (Eckhardt and Flanagan, 1956).
· Exceeding the design speed on the curve (Messer et al., 1981).
· Exceeding design of vehicle path (Glennon and Weaver, 1971; Good, 1978).
· Failure to maintain appropriate lateral position in the curve (McDonald and Ellis, 1975).
· Incorrect anticipatory behavior of curve speed and alignment when approaching the curve (Messer et al., 1981; Johnston, 1982).
· Inadequate appreciation of the degree of hazard associated with a given curve (Johnston, 1982).
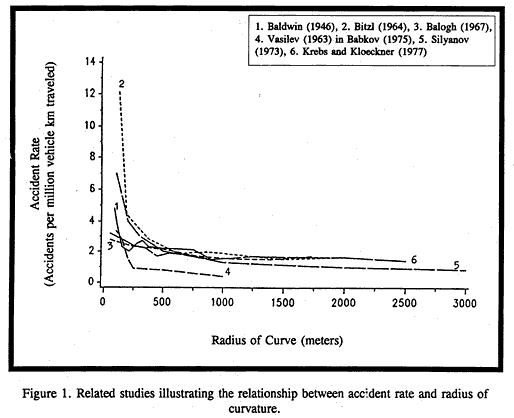
Many of these studies also report specific levels of horizontal curve geometry that are associated with increased accident rates, including: (1) curves of radii less than 400 m (1,312 ft) (McLean, 1981; Choueiri and Lamm, 1987; Baldwin, 1946; Bitzl, 1964; Balogh, 1967; Vasilev, 1963 in Babkov, 1975; Silyanov, 1973; and Krebs and Kloeckner, 1977), (2) curves of radii less than 600 m (1,968 ft) on rural two-lane roads (Choueiri and Lamm, 1987; Johnston, 1982), and (3) curves over 3 degrees [582 m (1,910 ft)] (Cirillo and Council, 1986).
An early study (Eckhardt and Flanagan, 1956) examined the relationship of roadway elements, including geometry on more than 9,000 accidents on the Pennsylvania turnpike. Statistically significant relationships were found for behaviors and errors (noted from police accident reports) on one or more of six types of roadway elements (straight: level, up, and down; curve: level, up, and down). The analysis showed that a significant portion of accidents on curved sections (level and down) were reported to be caused by deficiencies in driving skills (that is, drivers were not able to properly negotiate curves).
Leisch (1971) summarized five studies from the 1950's and 60's supporting the argument that increased accident rates are associated with an increase in the degree of curvature.
Neuman (1992) reports that design for horizontal curves is based on an implied assumption that drivers track the curve as it is designed; however, research has confirmed that the driving dynamics on curves differs significantly from the design assumptions. The typical pattern is for drivers to track (unspiraled) curves in a manner that produces significantly greater friction demands on the tire/roadway interface than are intended by AASHTO design policy. Glennon and Weaver (1971) evaluated the adequacy of geometric design standards for highway curves by filming vehicles entering unspiraled highway curves with curvature ranging from 2 to 7 degrees. While driver age was not analyzed, results of the study indicated that most vehicle paths, regardless of speed, exceed the degree of highway curve at some point on the curve. Glennon, Neuman, and Leisch (1985) measured vehicle speed and lateral placement on horizontal curves and found that drivers tend to overshoot the curve radius, producing minimum vehicle path radii sharper than the highway curve, and that the tendency to overshoot is independent of speed. They observed that the tangent alignment immediately in advance of the curve is the critical region of operations, because at about 61 m (200 ft) before the beginning points of the curve (or approximately 3 s driving time), drivers begin to adjust both their speed and path. Such adjustments are particularly large on sharper curves. Thus, the margin of safety in current AASHTO design policy is much less than anticipated. The researchers developed linear regression fits for different percentiles of vehicle path radius versus highway curve radius and degrees of curve. With these equations, they were able to calculate a percentage of vehicles that would exceed a given highway curve and by what degree level. For instance, a 3-degree highway curve will have 10 of the vehicles exceeding a 4.3-degree path maneuver. The researchers recommended that to arrive at the design relationship for highway curve radius, a percentile level of vehicles (such as 10) is needed, which ensures that very few vehicles will approach instability (exceeding the design curve speed). They developed modified design equations to support their recommendations.
Gupta and Jain (1973) conducted research on two-lane urban and rural roads and highways to identify and define which roadway elements are statistically correlated with accident occurrence, and to evaluate each element's relative merit as an index of prediction. Geometric variables used in the analysis included horizontal curvature, highway section, pavement width, shoulder width, and vertical clearance. Average daily traffic (ADT) was also used. The study examined over 34,000 accidents from 1964 to 1969 in Connecticut and used multivariate analysis to take into consideration the individual contributions of selected highway geometric characteristics and the joint effects of these various elements on accident experience. Of the four geometric variables (horizontal curvature, roadway width, vertical clearance, and sight distance), the horizontal curvature feature possessed the highest correlation with all accident types on rural highways. This feature also was significantly related to all non-intersection accident types (with the exception of fatal ones). For urban highways, the horizontal curvature feature also possessed a significant relationship to all classes of accidents, except fatal and multiple vehicle accident rates. For highways excluding intersections, degree of highway curvature was significantly related to all types of accidents except fatal ones.
The concern with an increasing demand placed on drivers due to increased sophistication and complexity of highway design features was the basis for another study in the 1970's (McDonald and Ellis, 1975). They investigated driver workload (attentional demand) as it related to horizontal curves (17.33, 10.70, 4.60, and 0 degrees) and speed (32, 64, 96, and 129 km/h [20, 40, 60, and 80 mi/h]). The study utilized a secondary task to determine the percentage of a driver's attention required to track a lane, while various curves were negotiated at various speeds, as well as how drivers control lane position. Results indicated that lane tracking in a 17-degree turn demanded 26 percent of the subject's attention at 32 km/h (20 mi/h) and 42 percent at 64 km/h (40 mi/h), and that attentional demand in the straightaway remained approximately 23 percent for speeds from 64 km/h to 129 km/h (40 mi/h to 80 mi/h). Lane-tracking data indicated that the median location was 13 cm (5 in) to the left of the lane center in straightaways, 18 cm (7 in) to the left in left turns, and 15 cm (6 in) to the right in right turns. The researchers constructed graphs for workload (attentional demand) at various speeds and curvatures for left and right turns, as well as regression equations for the data. These data demonstrated an increased demand on drivers, when the degree of the horizontal curve increases.
A comprehensive literature review (prior to 1978) on road curve geometry and driver behavior was performed by Good (1978). He conducted a review of the development of design standards for horizontal alignment, focusing on vehicle speed, criteria for determining safe speed, superelevation associated with different degrees of curvature, criteria for effecting transitions in curvature, superelevation and pavement width, and degraded standards applied to design of intersection curves. He concluded the following:
· Vehicle speeds are not constant throughout a curve.
· No single relationship is likely to properly represent driver behavior over the range of curvatures encountered, because different criteria may well apply to speed selection on high and low-speed curves.
· Values of side-friction calculated from measured vehicle speeds and the centerline radius of the curve will be inaccurate, because on short, small-radius curves many drivers "cut the corner" to reduce the maximum path curvature; on larger-radius highways, it has been found that the maximum vehicle path curvatures generally exceed the roadway curvature.
Haywood (1980) also reviewed the literature (prior to 1980) and reported that the highway research community is in basic agreement that roadway alignment is a key factor in unsafe vehicular operation: i.e., increasing degrees of curvature cause more accidents. Single sharp curves in a highway system, generally characterized by long tangents and flat curves, create hazardous situations. In addition, he cited studies that found that sharp horizontal curves at infrequent intervals are much more dangerous than frequent applications of the same class of curves. In addition, for two-lane rural roads, horizontal curvature may have the highest correlation with accident rates of major geometric characteristics.
Choueiri and Lamm (1987) included a literature review (including international reports) on the influence of radius of horizontal curve on driving behavior (accident rates and operating speeds) in their study on design methods to reduce rural road speed inconsistencies in New York. Studies from the United States, Germany, United Kingdom, the former Soviet Union, and Sweden were reviewed. The research demonstrated that increases in curve radii will decrease accidents. For highway sections with radii of curve greater than 400 m (1,300 ft) to 500 m (1,600 ft), the gain in safety becomes relatively small. Figure 1 illustrates their conclusion. They cited Cirillo and Council (1986), who stated that most studies show that horizontal curves should be less than 3 degrees (i.e., radii of curve greater than 575 m (1,900 ft), with vertical curves less than 6 percent.
McLean (1981) conducted a study to examine driver speed behavior and rural road alignment design. The impetus of the study was based on findings of previous studies, which found that horizontal curves are overrepresented in non-intersection rural road accidents, curves with radii less than 400 m (1,300 ft) have a particularly high accident rate, and relative to other alignment properties, road curvature has the greatest influence on driver speed behavior. Free-speed data were collected at 120 curves with approach tangent (non-intersection) sites on two-lane rural highways. Sites were selected on the basis of the likely curve speed being less than the likely approach speed. Regression analysis revealed that the observed 85th percentile car speeds were dominantly influenced by the desired speed
Figure 1. Related studies illustrating the relationship between accident rate and radius of curvature.
pertaining to the road section and curve radius (curvature). While available sight distance had a statistically significant effect on curve speeds, it represented less than 1 percent of the variability in observed 85th percentile speeds. Other traffic and road geometry parameters failed to show a statistically significant effect on curve speeds. A good description of the empirical data in terms of statistical significance and even spread of residuals was provided in a regression equation.
Using a test course with various curvatures, Messer et al. (1981) conducted a field study to determine the driving expectancy aspects of driver behavior in traversing a horizontal curve. A test course was set up using constant (25 degree down to 4 degree) and variable curves (4, 6, 9, and 12 degrees), with the test curves altered by pavement markings. Data were collected on subjects' lateral acceleration, vehicle speed and brake applications. The results showed the following:
· Lateral acceleration differential analysis indicated that a change greater than 5 degrees in the curvature produced a substantial increase in motorist surprise, and the percentage of subjects braking in the curve increased very rapidly for degrees of curvature beyond 4 degrees.
· The percentage of subjects braking in the curve increased very rapidly for degrees of curvature beyond 4 degrees.
· The speed that the drivers chose in the curves was virtually the same as the AASHTO recommended design speeds (except for very flat curves), indicating that about half of the driving population probably naturally overdrives the design speed of roadways.
Johnston (1982) provided a review of the literature focusing on attempts to modify driver behavior on rural road curves. He reported that horizontal curves that are below 600 m (1968 ft) in radius on two-lane rural roads, and those requiring a substantial reduction in speed from that prevailing on the preceding tangent section were disproportionately represented among accident sites. He stressed that the importance of curve frequency (in other words, driver expectancy) underlines the need to look beyond accident data to driver behavior in order to understand the etiology of accidents on rural curves. Successful curve negotiation depends upon the choice of appropriate approach speed and adequate lateral positioning through the curve. Speed control studies must consider: speed of the vehicle before the driver perceives the curve; approach speed to the curve; and the speed profile through the curve. He reported that many studies showed that loss-of-control accidents result from an inability to maintain lateral position through the curve because of excessive speed, with inadequate deceleration in the approach zone, stemming from a combination of incorrect anticipatory behavior induced by the prior speed environment and inadequate perception of the demands of the curve. Thus, the driver behaviors to be modified should include both curve approach and curve entry speeds. Performance through the curve is of secondary importance. Inappropriate high speeds through curves may be related to a driver's inadequate appreciation of the degree of hazard associated with a given curve. This researcher recommended using curve warning and advisory speed signs and roadway delineation (including post-mounted delineators) for modifying driver behavior with horizontal curves.
Thompson and Perkins (1983) looked at accident surrogate measures for hazardous-location identification and countermeasure evaluation at isolated rural horizontal curves. Accident surrogate measures were identified through a literature review; a 2-day workshop with highway professionals; an analysis of an existing data base containing accident, geometric, operational and environmental data; and selected field data collection at rural, isolated horizontal curves. The selection of candidate accident surrogate measures included operational variables (e.g., encroachment and speed reduction) and non-operational variables (e.g., average annual daily traffic, degree of curvature, grade, shoulder width, distance since last curve, superelevation, slope of roadside, type, location, and frequency of fixed objects). Accident data (1976-1978) were collected at 25 rural isolated curves with the following features: two-lane, undivided roads with a central angle of at least 20 degrees; traffic volumes not exceeding 8,000 ADT; posted speeds on curve between 56 and 88 km/h (35 and 55 mi/h); lane widths between 3.0 and 3.6 m (10 and 12 ft) and gravel shoulders; minimum of 402 m (0.25 mi) distance from a preceding highway event (i.e., curve, stop sign, traffic signal, etc.); and no unusual roadside feature. Separate regression analyses were conducted on the data set to search for statistically significant relationships between accidents and combination and each type of independent (operational and non-operational variables). Results showed that the strongest model developed in the study indicates that the outside-lane accident rate at horizontal curves can be predicted from measurements of the distance since the last traffic event on the outside lane and speed differential between the approach speed and curve midpoint speed for traffic in the outside lane. The model is strongest when applied to highways with a posted speed limit of 72 km/h (45 mi/h) or greater. Reasonably good models were also obtained for rear-end and run-off-road accident rates.
Choueiri and Lamm (1987) conducted research to determine the influence of particular design parameters (degree of curve, length of curve, superelevation rate, gradient, sight distance, lane width, shoulder width, and posted speed limit signs) and traffic volume on operating speeds and accident rates on over 250 two-lane rural routes in the state of New York. Regression analyses were used to determine the influence of these relationships. The researchers reported that accident rates increase with increasing degree of curve despite the presence of traffic warning devices at curved sites. They also recommended that the sites in the State with more than 10 degrees of curvature and changes of more than 19 km/h (12 mi/h) in operating speeds should be redesigned.
Choueiri and Lamm (1987) also presented a review of several early studies that found an association between decreasing accident frequency and increasing pavement widths. Krebs and Kloeckner (1977) reported that for every 1 m (3.3 ft) increase in pavement width, a decrease of 0.25 in the accident rate (per million vehicle kilometers) could be expected. Hall, Burton, Coppage and Dickinson (1976) examined the nature of single vehicle accidents involving fixed objects along the roadside of non-freeway facilities. They found that the majority of these types of accidents were reported as non-intersection related, and occurred most frequently on weekends, at night, under adverse pavement and weather conditions, and on horizontal curves (especially outside of curve). These accident types have high injury severity to drivers and passengers. Wright and Robertson (1979) reported that 40 and 31 percent of all fatal crashes in Pennsylvania and Maryland, respectively, resulted in a vehicle hitting a fixed object such as a tree, utility pole, or bridge abutment. In a study focused on 600 accident sites (and 600 comparison sites) involving fixed objects, crash locations were best discriminated from comparison locations by a combination of curvature greater than 9 degrees and downhill gradient steeper than 3 percent; and, for the fatal fixed-object crash population, the crash locations were best discriminated from comparison locations by a combination of curvature greater than 6 degrees and downhill gradient steeper than 2 percent.
Zegeer, Stewart, Reinfurt, Council, Neuman, Hamilton, Miller, and Hunter (1990) conducted a study to determine the horizontal curve features that affect accident experience on two-lane rural roads and to evaluate geometric improvements for safety upgrading. An analysis of 104 fatal and 104 non-fatal accidents on rural curves in North Carolina showed that in more of the fatal accidents, the first maneuver was toward the outside of the curve (77 percent of the fatal accidents versus 64 percent of the non-fatal accidents). For approximately 28 percent of the fatal accidents (versus 8.8 percent of the non-fatal accidents) the vehicle ran off the road to the right and then returned to be involved in a crash. Further, an analysis on 10,900 horizontal curves in the State of Washington with corresponding accident, geometric, traffic, and roadway data variables showed that the percentage of severe non-fatal injuries and fatalities were greater on curves than on tangents with the same width, where total road width (lanes plus shoulders) was £ 9.1 m (30 ft).
Zegeer et al. (1990) concluded that widening lanes or shoulders on curves can reduce curve accidents by as much as 33 percent. Specifically, table 2 shows the predicted percent reduction in accidents that would be expected on horizontal curves by widening the lanes, and widening paved and unpaved shoulders (Zegeer et al., 1990).
Kanellaidis (1991) proposed changes to calculate superelevation in highway curves, based on the relationship between the degree of curve and actual operating speeds, to harmonize superelevation design with drivers’ actual speed behavior. He reported that recent experience in the field of driver behavior and research in highway geometric design indicates that a reexamination and an update of the design-speed concept is needed. Drivers negotiating highway curves neither know nor observe design speed. Research indicates that they tend to drive at speeds that are comfortable for them based on their perception of the horizontal, vertical, and cross-sectional geometry. He reported that the effect of superelevation is only felt when their vehicle enters the curve; therefore, superelevation should probably depend on drivers' actual speeds. He recommended that superelevation rates be reevaluated and possibly replaced by operating-speed parameters. He also suggested that further research is needed to determine, through appropriate speed profile techniques, nationwide representative operating speed versus radius of curve relationships for highway classification. With this information, more realistic radius of curve versus superelevation relationships can be established.
Table 2. Percent reduction in accidents on horizontal curves with 8-ft beginning lane width as a result of lane widening, paved shoulder widening, and unpaved shoulder widening
(Taken from Zegeer et al., 1990).
|
Total Amount of Lane or Shoulder Widening (ft) |
Percent Accident Reduction |
|||
|
Total |
Per Side |
Lane Widening* |
Paved Shoulder Widening |
Unpaved Shoulder Widening |
|
2 |
1 |
5 |
4 |
3 |
|
4 |
2 |
12 |
8 |
7 |
|
6 |
3 |
17 |
12 |
10 |
|
8 |
4 |
21 |
15 |
13 |
|
10 |
5 |
* |
19 |
16 |
|
12 |
6 |
* |
21 |
18 |
|
14 |
7 |
* |
25 |
21 |
|
16 |
8 |
* |
28 |
24 |
|
18 |
9 |
* |
31 |
26 |
|
20 |
10 |
* |
33 |
29 |
1 ft = 0.305 m
* Values of lane widening correspond to a maximum widening of 8 ft (2.4 m) to 12 ft (3.7 m) for a total of 4 ft (1.2 m) per lane, or a total of 8 ft (2.4 m) of widening.
In summary, the majority of these studies reported a relationship between horizontal curvature (and the degree of curvature) on the total percentage of accidents by geometric design feature on the highways. The reasons for these accidents was related to the following inadequate driving performance behaviors:
· Deficient skills in negotiating curves (especially those of more than 3 degrees).
· Exceeding the design speed on the curve.
· Exceeding design of vehicle path.
· Failure to maintain lateral position in the curve.
· Incorrect anticipatory behavior of curve speed and alignment when approaching the curve.
· Inadequate appreciation of the degree of hazard associated with a given curve.
Many of these studies also reported specific features of horizontal curves that affect increased accident rates, including: curves of radii less than 400 m, curves of radii less than 600 m on rural two-lane roads, and curves over 3 degrees.
Studies on the relationship between horizontal curvature and driving performance of various age groups has been very limited. Roszel and Braaksma (1980) performed research to determine what factors most strongly affected variations in drivers' speed patterns along a roadway. Variables used in the study were based on a literature review of the causes of speed variation and included: age (16 to 20, 20 to 35, 35 to 50, and 50 and over); gender; number of occupants in the vehicle; size, age, and physical condition of the vehicle; horizontal curvature; vertical grades; and tangents. The researchers found that the geometric features of horizontal and vertical curvature have a significant effect on the location of speed-change frequency and the magnitude of the speed change. Driver age was the only other variable that significantly affected the frequency and direction of speed change. The older age group (50 and over) performed poorer than the other age groups.
Vertical Curvature. Highway vertical alignment is comprised of tangent grades and parabolic vertical curves. With respect to vertical curves, design policy is based on the need to provide drivers with adequate stopping sight distance. That is, enough sight distance must exist to permit drivers to see an obstacle soon enough to stop for it under some set of reasonable worst-case conditions. The parameters that determine sight distance on crest vertical curves include the change of grade, the length of the curve, the height above the ground of the driver's eye, and the height of the obstacle to be seen. Stopping sight distance is determined by reaction time (RT), speed of vehicle, and tire-pavement coefficient of friction. Current practice assumes an obstacle height of 15.2 cm (6 in), and a locked wheel, wet pavement stop. Minimum lengths of crest vertical curves are based on sight distance and driver comfort. These criteria do not currently include adjustments for age-related effects in driving performance measures.
Early studies have reported that restricted sight distance is a significant factor in the increasing number of single-vehicle accidents in both urban and rural areas and of multiple vehicle accidents in urban areas (Gupta and Jain, 1973). Mullins and Keese (1961) reported that rear-end accidents on freeways were common at vertical curve locations where unfavorable sight conditions existed. Young (1950) reported that the vehicle-mile accident rate on 804 km (500 mi) of two-lane roads decreased by more than 50 percent where sight distance increased from 244 m to 762 m (800 ft to 2,500 ft). Kostyniuk and Cleveland (1986) analyzed the accident histories of 10 matched pairs of sites on two-lane rural roadways. The 10 limited site distance (vertical curves) locations were defined as those below the minimum SSD recommended by AASHTO in 1965, and ranged from 36 to 94 m (118 to 308 ft). The control site locations were defined as those which more than met the standard (SSD greater than 213 m [700 ft]). The set of sites with limited SSD had 60 percent more accidents in the study period than the control sites.
An early engineering study (Lefeve, 1953) investigated driver performance for passenger vehicles on two lane rural highways with vertical curves. The study sites had minimum sight distances between 46 and 152 m (150 and 500 ft). It was found that as drivers approach vertical curves with short sight distances, they invariably reduce their speeds to some extent; however, it was far less than that required for safe operations. Drivers appeared to be unaware of potential hazardous situations that could occur. There was also no consistent relation between operating speeds at the crest of vertical curves and the minimum sight distances. Speeds at the vertical curves (regardless of the sight distance) appeared to be governed by present operating speeds of the highway. Lefeve recommended a minimum sight distance of 122 m (400 ft) for a 101.6 mm (4 in) object to accommodate the driving habits of 85 percent of the drivers. He also noted that driver speed on vertical curves bears no relation to the safe speed as determined by then-existing design standards.
Farber (1982) performed sensitivity analyses of the effects of change in eye height, object height, friction, and speed on stopping sight distance on crest vertical curves. He found that stopping sight distance was relatively insensitive to a reasonable range of changes in driver eye height, but is very sensitive to speed, friction, and reaction time. Thus, stopping distance on vertical curves that are of inadequate length or are substandard according to other design criteria, and where major redesign, repaving, or excavation is not feasible, could most efficiently be made safer by modifying a driver's approach speed and/or reaction time. For 88.5 km/h (55 mi/h) traffic, stopping distance increases 24.7 m (81 ft) for every 1-s increase in reaction time. Similarly, stopping distance decreases about 4.9 m per each km/h (16 ft per each mi/h) reduction in speed.
A reevaluation of crest vertical curve length requirements was performed by Khasnabis and Tad (1983). These researchers reviewed the historical changes in parameters that affect the computation of stopping sight distances and evaluated the effect of these changes on the length requirements of crest vertical curves. Principal conclusions were that further tests on reaction time are needed, since the current 2.5-s reaction time may not accurately reflect the change in the age distribution and composition of the driving population during the last 20 years. In addition, the validity of the assumption of a speed differential for wet pavement conditions between design speed and top driving speed is questionable, since there is very little evidence to substantiate the assumption that all motorists are likely to reduce their speed on wet pavements. Of particular interest, Khasnabis and Tad (1983) noted that the object height of 150 mm (6 in) appears to be somewhat arbitrary, and stated that reducing the object height to 75 mm (3 in) could actually improve the safety elements of crest curves.
Tangents. Studies that have evaluated the relationship between tangent areas on driving performance are reported below. Sight distance issues on tangents have also been a major concern, and are discussed in the next section.
Leisch (1977) examined characteristics of drivers using highway tangents. He noted that drivers desired—and tended to travel—at relatively high speeds, especially where deterrents are few and free-flow characteristics are present. In addition, drivers traveling along a variable alignment tend to speed up when the quality of the alignment improves. Drivers also lose their sense of speed in long sustained driving situations, and tend to overdrive situations that require speed reduction. He also reported that drivers orient themselves and choose their paths by following delineating features on or along the side of the highway. In situations where tangent sections are followed by curved or ramp sections, he reported that drivers entering and leaving curved roadways do so by negotiating a transitional path. Drivers exiting and entering high-speed highways, via a turning roadway or ramp, do so by direct and gradual diverging or merging. Drivers also tend to overdrive turning roadways. Drivers need to have highway characteristics that have smooth-flowing quality and avoidance of sight loss (the disappearing and reappearing of the road).
Messer, Mounce, and Brackett (1981) studied the relationship of geometric design consistency and driver expectancy. Field evaluations were conducted across Texas and Georgia to observe traffic operational characteristics at problem geometric feature locations. Speeds of vehicles were found to be affected significantly by the geometric feature at study sites. The average speed on the highway prior to the feature (in the tangent) was found to relate to the character of the topography, type of driving environment, and traffic mix; but apparently not to the degree of the impending hazard ahead.
In a more recent accident study of older drivers on freeways, Harkey, Huang, and Zegeer (1995) examined the location of accidents to determine if older drivers (age 66 or older) were having more accidents at ramp/interchange areas than on the mainline when compared to a subset of younger drivers (ages 31 to 45). The clearest result from the analysis effort related to the pre-crash maneuvers and contributing factors of older drivers in multivehicle accidents. It appears that older drivers were overinvolved to the greatest degree in accidents in which they had to change lanes; these accidents were often sideswipe or angle collisions. The contributing factor with which older drivers were most often cited was failure to yield, twice as often as younger drivers for all accidents and five times as often for those accidents involving a lane change maneuver. On freeway facilities, lane changes typically occur when a vehicle is entering the freeway from an on-ramp, exiting the freeway onto an off-ramp, passing a vehicle on the freeway, or simply changing lanes on the freeway. The results with regard to location (ramp vs. mainline) showed no differences between the two age groups with respect to multivehicle accidents. Older drivers experienced 15 percent of their freeway multivehicle accidents on ramps and 77 percent of their freeway multivehicle accidents on the mainline. Younger drivers experienced 14 percent of their freeway multivehicle accidents on ramps compared to 70 percent on the mainline. Thus, it could not be assumed that older drivers are having more problems with this lane change maneuver at the on- and off-ramps as opposed to the mainline itself (Harkey, Huang, and Zegeer, 1995).
In this analysis, it was found that older drivers experienced a higher level of single-vehicle accident involvement on the mainline when compared to younger drivers (90.6 percent versus 85.3 percent, respectively), which suggests that older drivers are handling their vehicles more safely on ramps, perhaps due to lower speeds on ramps compared to younger drivers. It could also imply that older drivers are encountering problems on the mainline to which they are unable to respond in time to avoid an accident. In fact, it was found that older drivers were overinvolved in single-vehicle run-off-road accidents to the left and to the right when compared to the younger drivers (46.1 percent versus 39.2 percent respectively).
Sight Distance
Sight distance is a critical element in the design of streets and highways. It is the length of the highway visible to the driver, as per four different applications: stopping sight distance (SSD), passing sight distance (PSD), decision sight distance (DSD), and intersection sight distance (ISD). These design elements take into consideration driver performance measures. For SSD, the value is based on the concept of providing enough distance for the majority of the drivers to stop safely to avoid collision with an object in the road. PSD values are based on distance traveled during perception, reaction, and acceleration of the passing vehicle to encroachment on the opposing lane; distance traveled by the passing vehicle in the opposing lane; distance between the passing vehicle at the end of a pass and an oncoming opposing vehicle; and, distance traveled by an opposing vehicle for two-thirds of the time the passing vehicle occupies the left lane. DSD is that distance required for a driver to perceive an unexpected or complex situation, arrive at a decision regarding a course of action, and execute that decision in a reasonable manner. ISD involves the distance for a driver approaching an intersection needed for an unobstructed view of sufficient length to permit control of the vehicle to avoid collision. AASHTO (1994) provides operational models for each application. The models are based on assumptions of driver behavior (perception-reaction and brake-reaction time) and target (object) visibility, both key human factors considerations.
Tangent Sections. Several research studies have been performed to establish and evaluate passing sight distance values for tangent sections of highways. The safety and effectiveness of passing zones depends upon the specific geometric characteristics of the highway section, and on how drivers receive and processes information provided by signs and pavement markings, how drivers integrate speed and distance information for opposing vehicles, and how they control their vehicles (brake and accelerate) during passing maneuvers. As the number of older drivers in the population increases dramatically over the years 1995 through 2025, many situations are expected to arise where not only the slower-moving vehicle, but also the passing vehicle is driven by an older person.
The capabilities and behavior of older drivers, in fact, vary with respect to younger drivers in several ways crucial to this discussion. Studies have shown that while driving speed decreases with driver age, the size of acceptable headways and gaps tend to increase with age. While motivational factors (e.g., sensation seeking, risk taking) have been shown to play a major role in influencing the higher speeds and shorter headways accepted by young drivers, they seem to play a less important role in older driver behavior. Instead, the relatively slower speeds and longer headways and gaps accepted by older drivers have been attributed to their compensating for decrements in cognitive and sensory abilities (Case, Hulbert, and Beers, 1970; Planek and Overend, 1973).
Consistent with the AASHTO operational model (AASHTO, 1994), passing sight distance is provided only at places where combinations of alignment and profile do not require the use of crest vertical curves. For horizontal curves, the minimum passing sight distance for a two-lane road is about four times as great as the minimum stopping sight distance at the same speed (AASHTO, 1994). By comparison, the Manual on Uniform Traffic Control Devices (MUTCD) defines passing sight distance for vertical curves as the distance at which an object 1070 mm (3.5 ft) above the pavement surface can be seen from a point 1070 mm (3.5 ft) above the pavement. For horizontal curves, passing sight distance is defined by the MUTCD as the distance measured along the centerline between two points 1070 mm (3.5 ft) above the pavement on a line tangent to the embankment or other obstruction that cuts off the view of the inside curve (MUTCD, 1988). The length of passing zones or the minimum distance between successive no-passing zones is specified as 122 m (400 ft) in the MUTCD. As Hughes, Joshua, and McGee (1992) point out, the MUTCD sight distance requirements were based on a "compromise between a delayed and a flying passing maneuver," traceable back to the AASHTO 1940 policy that reflected a "compromise distance based on a passing maneuver such that the frequency of maneuvers requiring shorter distances was not great enough to seriously impair the usefulness of the highway."
The basis for the minimum length of a passing zone [122 m (400 ft)] is unknown, however, because research has indicated that for design speeds above 48 km/h (30 mi/h) the distance required for one vehicle to pass another is much longer than 122 m (400 ft) (Hughes et al., 1992). Weaver and Glennon (1972) report that, in limited studies of short passing sections on main rural highways, most drivers do not complete a pass even within a 244-m (800-ft) section, and utilization remains very low for passing zones shorter than 274.3 m (900 ft). Not surprisingly, it has been mentioned in the literature (Hughes et al., 1992) that the current AASHTO and MUTCD passing sight distance values are probably too low. Several studies have indicated that both the MUTCD and AASHTO passing sight distances are too short to allow passenger cars to pass trucks and for trucks to pass trucks (Donaldson, 1986; Fancher, 1986; Khasnabis, 1986).
Several research studies have been performed that have established and evaluated passing sight distance values for tangent sections of highways. As early as 1934, the National Bureau of Standards measured the time required for passing on level highways during light traffic, and found that the time to complete the maneuver always ranged between 5 and 7 s regardless of speed. Passing maneuvers were observed at speeds ranging from 16 to 80 km/h (10 to 50 mi/h). They concluded that 274.3 m (900 ft) of sight distance was required for passing at 64 km/h (40 mi/h). Harwood and Glennon (1976) reported that drivers are reluctant to use passing zones under 268 m (880 ft). They recommended that design and marking standards should be identical and include both minimum passing sight distances and minimum length of passing zones, with minimum passing sight distance values falling between the AASHTO and MUTCD values. Kaub (1990) presented a substantial amount of data on passing maneuvers on a recreational two-lane, two-way highway in northern Wisconsin. Under low and high traffic volumes, he found that 24 to 35 percent and 24 to 50 percent, respectively, of all passes were attempted in the presence of an opposing vehicle; the average time in the opposing lane (96.5 km/h [60 mi/h]) was 12.2 s under low traffic conditions and 11.3 s with high traffic volumes.
Passing lanes, also referred to as overtaking lanes, are auxiliary lanes provided on two-lane highways to enhance overtaking opportunities. Harwood, Hoban, and Warren (1988) report that passing lanes provide an effective method for improving traffic operations problems resulting from the lack of passing opportunities due to limited sight distance and heavy oncoming traffic volumes. In addition, passing lanes can be provided at a lower cost than that required for constructing a four-lane highway. Based on Morall and Hoban (1985), the design of overtaking lanes should include: advance notification of the overtaking lane; a keep right unless overtaking sign at the diverge point; advance notification of the merge and signs at the merge; and some identification for traffic in the opposing lane that they are facing an overtaking lane. They report that there is general agreement that providing short overtaking lanes at regular spacing is more cost effective than providing a few long passing lanes. This feature becomes increasingly attractive as the diversity of driving styles and driver capability levels grows, with faster motorists taking unnecessary chances to overtake slower-moving vehicles.
Finally, although the minimum passing sight distances specified by AASHTO are more than double that specified by the MUTCD, and are based on observations of successful car-passing-car observations, Hughes et al. (1990) comment that the model does not take into account the abortive passing maneuver, nor does it consider the length of the impeding vehicle. Saito (1984) determined that the values specified by the MUTCD for minimum passing distance are inadequate for the abortive maneuver, while Ohene and Ardekani (1988) assert that the MUTCD sight distance requirements are adequate for the driver to abort if the driver decelerates at a rate of 3.2 m/s/s for a 64 km/h passing speed (10.5 ft/s/s for a 40 mi/h passing speed) and at a rate of 3.9 m/s/s for a passing speed of 80 km/h (12.8 ft/s/s for a 50 mi/h passing speed). Worth noting is work by Lyles (1981) on passing-zone TCD’s showing that aborted passes could be reduced by more judicious use of passing-zone signs. In any event, it cannot be assumed that drivers will always use the maximum acceleration and deceleration capabilities of their vehicles, particularly older drivers.
Lerner (1991) discussed the concerns in the literature about the adequacy of sight distance criteria for older drivers. There are some good reasons to believe that older drivers' perception-reaction time (PRT) will be meaningfully longer for some situations, requiring a greater sight distance. He noted that there is still very limited field validation data that supports the notion that older drivers have significantly lower perception-reaction time; and even if there were sufficient data, it does not necessarily mean that current design parameters are inadequate. He also noted that given the very significant implications of revising design standards, in both potential cost and changes in practice, any recommended modifications to design standards should be based as much as possible on ecologically valid, empirical, on-road data. The need exists to specify, quantitatively, how much longer it takes older drivers to respond in various situations, what the distribution of the PRT's actually looks like, the degree to which current design standards encompass these PRT's, and the safety implications of various degrees of failure to fully include the complete distribution of older PRT's.
More recently, Lerner, Huey, McGee, and Sullivan (1995) conducted a stopping sight distance study, involving the measurement of brake reaction times to an unanticipated even (a crash barrel suddenly rolling toward the roadway). He found apparent differences in the distribution of PRT among age groups. Although younger drivers accounted for most of the fastest PRT, there were no age differences in the 50th or 85th percentiles; all observed PRT were encompassed by the current AASHTO design value of 2.5 s. The median brake reaction time (RT) was approximately 1.4 to 1.5 s, and the 85th percentile brake reaction time was 1.9 s.
In a decision sight distance study also conducted by Lerner et al. (1995), the distance was measured when drivers recognized the need to make a lane change maneuver. Subjects drove their own vehicles along a 56 km (35 mi) route that contained 13 situations where decision sight distance criteria were applicable (lane drops freeway left exits, and turn only lanes). Although observed DSD values were generally longer with increasing driver age, the 85th percentile PRT for all age groups were well below AASHTO design assumptions. Age differences were more evident at the 50th percentile PRT’s. At the freeway sites, 85th percentile PRT’s for all age groups ranged between 7.6 s to 7.8 s. For arterial sites, the 85th percentile PRT values for the older drivers (7.6 s and 7.1 s) were substantially longer than the 4.2 s found for the younger group.
Intersections. Because at-grade intersections define locations with the highest probability of conflict between vehicles, adequate sight distance is particularly important. Not surprisingly, a number of studies have shown that sight distance problems at intersections usually result in a higher accident rate (Hanna, Flynn, and Tyler, 1976; David and Norman, 1979; Mitchell, 1972). The need for adequate sight distance at an intersection is best illustrated by a quote from the Green Book: "The operator of a vehicle approaching an intersection at-grade should have an unobstructed view of the entire intersection and sufficient lengths of the intersecting highway to permit control of the vehicle to avoid collisions" (AASHTO, 1994). AASHTO values (for both uncontrolled and stop-controlled intersections) for available sight distance are measured from the driver's eye height (currently 1070 mm [3.25 ft]) to the roofline of the conflicting vehicle (currently 1300 mm [4.25 ft]).
Sight distances at an intersection can be reduced by a number of deficiencies including physical obstructions too close to the intersection, severe grades, and poor horizontal alignment. The alignment and profile of an intersection impacts upon the sight distance available to the driver and thus, affects the ability of the driver to perceive the actions taking place both at the intersection and on its approaches. Since proper perception is the first key to performing a safe maneuver at an intersection, it follows that sight distance should be maximized which, in turn, means that the horizontal alignment should be straight and the gradients as flat as practical. Horizontal curvature on the approaches to an intersection makes it difficult for drivers to determine appropriate travel paths, because their visual focus is directed along lines tangential to these paths. Kihlberg and Tharp (1968) showed that accident rates increased 35 percent for highway segments with curved intersections over highway segments with straight intersections. AASHTO (1994) and ITE (1984) suggest vertical alignment at intersections should not exceed 3 and 2 percent, respectively.
Harwood, Mason, Pietrucha, Brydia, Hostetter, and Gittings (1993) state that the provision of intersection sight distance (ISD) is intended to give drivers an opportunity to obtain the information they need to make decisions about whether to proceed, slow, or stop in situations where potentially conflicting vehicles may be present. They note that while it is desirable to provide a reasonable margin of safety to accommodate incorrect or delayed driver decisions, there are substantial costs associated with providing sight distances at intersections; therefore, it is important that ISD requirements not be overly conservative or attempt to address traffic situations that are infrequent or unusual and for which increased ISD would provide little safety benefit.
Several studies have shown that sight distance problems usually result in a higher accident rate. A study of intersections in rural municipalities in Virginia showed the accident rate for 41 intersections with restricted sight distances to be 1.33 accidents per million entering vehicles. This is compared to 1.13 accidents per million entering vehicles for all 232 intersections included in the study, i.e., an 18 percent increase. The large increase in angle collisions (30 percent) at the restricted sight distance intersections was the primary reason for the higher accident rate. This fact resulted in the authors' conclusion that drivers were unable to adequately view and discern the actions of drivers on the cross streets (Hanna et al., 1976). Unfortunately, since no quantification of the sight distance problem is provided, relationships between the amount of sight distance available and the accident rate cannot be determined.
In another study, a relationship between available sight distance and the expected reduction in accidents at intersections was quantified (David and Norman, 1979). The results of the study showed that intersections with shorter sight distances generally have higher accident rates. Using these results, predicted accident reduction frequencies related to the intersection sight distance were derived as shown in table 3.
Other studies have attempted to show the benefits to be gained from improvements to intersection sight distance (Strate, 1980; Mitchell, 1972). The effort by Strate examined 34 types of improvements made in Federal Highway Safety Program projects. The results indicated that sight distance improvements were the most cost-effective, producing a benefit/cost ratio of 5.33 to 1. Mitchell conducted a before/after analysis, with a period of one year on each end, of intersections where a variety of improvements were implemented. The results showed a 67 percent reduction (from 39 to 13) in accidents where obstructions that inhibited sight distance were removed. This was the most effective of the implemented improvements.
|
AADT* (1,000s) |
Increased Sight Distance (ft) |
||
|
20-49 |
50-99 |
>100 |
|
|
< 5 |
0.18 |
0.20 |
0.30 |
|
5 - 10 |
1.00 |
1.30 |
1.40 |
|
10 - 15 |
0.87 |
2.26 |
3.46 |
|
> 15 |
5.25 |
7.41 |
11.26 |
Collectively, the studies above indicate a positive relationship between available intersection sight distance and a reduction in accidents, though the amount of accident reduction associated with a given increase in sight distance may be expected to vary according to the maneuver scenario and existing traffic control at the intersection. Procedures for determining appropriate intersection sight distances are provided by AASHTO for various levels of intersection control and the maneuvers to be performed. The scenarios defined include:
· Case I - No Control: ISD for vehicles approaching intersections with no control, at which vehicles are not required to stop, but may be required to adjust speed.
· Case II -Yield Control: ISD for vehicles on a minor-road
approach controlled by a YIELD sign.
· Case IIIA - Stop Control-Crossing Maneuver: ISD for a vehicle on a STOP-controlled approach on the minor road to accelerate from a stopped position and cross the major road.
· Case IIIB - Stop Control-Left Turn: ISD for a vehicle on a STOP-controlled approach on the minor road to accelerate from a stopped position and turn left onto the major road.
· Case IIIC - Stop Control-Right Turn: ISD for a vehicle on a STOP-controlled approach on the minor road to accelerate from a stopped position and turn right onto the major road.
· Case IV - Signal Control (should be designed by Case III conditions): ISD for a vehicle on a signal-controlled approach.
· Case V - Stop Control-Vehicle Turning Left from Major Highway: ISD for a vehicle stopped on a minor road, waiting to turn left across opposing lanes of travel.
One of the principal components in determining intersection sight distance in all cases listed above is perception-reaction time (PRT). The discussion of this value is first presented in chapters 2 and 3 of the Green Book under "Reaction Time" and "Brake Reaction Time," respectively (AASHTO, 1994). Results of several studies (e.g., Johansson and Rumar, 1971; Normann, 1953) are cited, and in conclusion, the 2.5 s value is selected since it was found to be adequate for approximately 90 percent of the drivers.
With respect to at-grade intersections, AASHTO recommends the following values of PRT for intersection sight distance calculations. In Case I, the PRT is assumed to be 2.0 s plus an additional 1.0 s to actuate braking, although the "preferred design" uses stopping sight distance (SSD) as the intersection sight distance design value that incorporates a PRT of 2.5 s. In Case II, SSD is the design value; thus, the PRT is 2.5 s. For all Case III scenarios and Cases IV and V, the PRT is assumed to be 2.0 s.
A critique of these values questioned the basis for reducing the PRT from 2.5 s used in SSD calculations to 2.0 s in the Case III scenarios of the intersection sight distance calculations (Alexander, 1989). As noted by the author, "The elements of PRT are: detection, recognition, decision, and action initiation." For SSD, this is the time from object or hazard detection to initiation of the braking maneuver. Time to search for a hazard or object is not included in the SSD computation, and the corresponding PRT value is 2.5 s. Yet, in all Case III scenarios, the PRT has been reduced to 2.0 s and now includes a search component that was not included in the SSD computations. The author points out that a driver is looking straight ahead when deciding to perform a stopping maneuver and only has to consider what is in his/her forward view. At an intersection, however, the driver must look forward, to the right, and to the left. This obviously takes time, especially for those drivers with lower levels of physical dexterity, e.g., older drivers. Alexander (1989) proposes the addition of a "search time" variable to the current equations for determining intersection sight distance, and use of the PRT value currently employed in the SSD computations (i.e., 2.5 s) for all intersection sight distance computations. Neuman (1989) also argues that a PRT of 2.5 s for SSD may not be sufficient in all situations, and can vary from 1.5 s to 5.0 s depending on the physical state of the driver (alert versus fatigued), the complexity of the driving task, and the location and functional class of the highway.
A number of research efforts have been conducted to determine appropriate values of PRT for use in intersection sight distance computations. A 1986 study examined the PRT of 124 subjects traversing a 3-h test circuit that contained scenarios identified above as Cases II, IIIA, IIIB, and IIIC. For the Case II (yield control) scenario, the results showed that in over 90 percent of the trials, subjects reacted in time to meet the SSD criteria established and thus, the 2.5 s PRT value was adequate. With respect to Case III scenarios, the PRT was measured from the first head movement after a stop to the application of the accelerator to enter the intersection. The mean and 85th percentile values for all maneuvers combined were 1.82 and 2.7 s, respectively. The results also showed the through movement to produce a lower value than the mean while the turning maneuvers produced a higher value. These results produce conclusions that the 2.0-s criterion for Case IIIA be retained and that the PRT value for the Case III turning maneuvers (B and C) be increased from 2.0 to 2.5 s. One other result that is applicable to the current effort was that no significant differences were found with respect to age (Hostetter, McGee, Crowley, Sequin, and Dauber, 1986).
Another effort examined the appropriateness of the PRT values currently specified by AASHTO for computing stopping sight distance, vehicle clearance interval, sight distance on horizontal curves, and intersection sight distance (McGee and Hooper, 1983). With respect to intersection sight distance, the results showed the following: (1) for Case I, the driver is not provided with sufficient time or distance to take evasive action if an opposing vehicle is encountered; and (2) for Case II, adequate sight distance in order to stop before arriving at the intersection is not provided despite the intent of the standard to enable such action. With respect to the PRT values, recommendations include increasing the 2.0- and 2.5-s values used in Case I and Case II calculations, respectively, to 3.4 s. It was also recommended that the PRT value for Case III scenarios be redefined.
While there is no consensus from the above studies on the actual values of PRT that should be employed in the intersection sight distance computations, there is concern as to whether the current values are meeting the needs of older drivers. Since older drivers tend to take longer in making a decision, especially in complex situations, the need to further evaluate current PRT values still exists. Hauer (1988) states that "the standards and design procedures for intersection sight triangles should be modified because there is reason to believe that when a passenger car is taken as the design vehicle, the sight distance is too short for many older drivers, who take longer to make decisions, move their heads more slowly, and wish to wait for longer gaps in traffic." He further states that "were almost all intersections designed with sufficient sight distance that trucks could cross them safely, there would be no reason to worry about older drivers of passenger cars because cars need much less time than trucks to accelerate and clear the intersection." However, recent research conducted by Lerner, Huey, McGee and Sullivan (1995) has concluded that based on older driver performance, no changes to design PRT values were recommended for ISD, SSD, or DSD, even though the 85th percentile J values exceeded the AASHTO 2.0-s design standard at 7 of the 14 sites. No change was recommended because the experimental design represented a worst-case scenario for visual search and detection (drivers were required to begin their search only after they had stopped at the intersection and looked inside the vehicle to perform a secondary task). Also, increasing the J value a few tenths of a second would produce a minor increase in Case III sight distances. No experimental PRT value was more than 20 percent greater than the 2.0-s standard. The four studies are described below.
Lerner et al. (1995) conducted an on-road experiment to investigate whether the assumed values for driver perception-reaction time used in AASHTO design equations adequately represent the range of actual PRT for older drivers. Approximately 33 subjects in each of three driver age groups were studied: 20 to 40, 65 to 69, and 70+. Drivers operated their own vehicles on actual roadways, were not informed that their response times were being measured, and were naive as to the purpose of the study (i.e., they were advised that the purpose of the experiment was to judge road quality and how this relates to aspects of driving). The Case III PRT study included 14 data collection sites on a 90 km (56 mi) route. The Case III (stop controlled) intersection sight distance experiment found that older drivers did not have longer PRT than younger drivers, and in fact the 85th percentile PRT closely matched the AASHTO design equation value of 2.0 s. The 90th percentile PRT was 2.3 s and there were occasional extremes of 3 to 4 s. The median daytime PRT was approximately 1.3 s. Interestingly, it was found that typical driver actions did not follow the stop/search/decide maneuver sequence implied by the model; in fact, drivers continued to search and appeared ready to terminate or modify their maneuver even after they had begun to move into the intersection. This finding resulted in the study authors' conclusion that the behavior model on which ISD is based is conservative. However, slowed visual scanning of traffic on the intersecting roadway by older drivers has been cited as a cause of near misses of (crossing) accidents at intersections during on-road evaluations. In the practice of coming to a stop, followed by a look to the left, then to the right, and then back to the left again, the older driver's slowed scanning behavior allows approaching vehicles to have closed the gap by the time a crossing maneuver finally is initiated. The traffic situation has changed when the older driver actually begins the maneuver, and drivers on the main roadway are often forced to adjust their speed to avoid a collision.
Lerner et al. (1995) also collected judgments about the acceptability of gaps and lags in traffic. Younger subjects accepted shorter gaps and rejected lags later than older subjects. The 50-percent gap acceptance point was about 7 s (i.e., if a gap is 7 s long, only about half of the subjects would accept it). The 85th percentile point is approximately 11 s. The oldest group required about 1.1 s longer than the youngest group. Subjects were willing to accept a briefer temporal margin for rejection of a lag than for acceptance of a gap (i.e., subjects were willing to execute a maneuver until an approaching vehicle was 5.3 s away). The oldest group had a 0.5 s longer lag rejection point than those in the youngest age group. Subjects in the 65 through 69 age group had the shortest safety margin of 4.7 s.
Intersection sight distance models are presently being reviewed and possibly revised as a part of a current NCHRP study, No. 15-14(1), titled Intersection Sight Distance, which is being conducted by Midwest Research Institute. The objective of this study is to evaluate current AASHTO methodology for intersection sight distance for all cases and, where appropriate, recommend new or revised models. Harwood, Mason, Pietrucha, Brydia, Hostetter, and Gittings (1993) presented the results of analyses performed in Phase I of the project for each intersection sight distance (ISD) case in an Interim Report, as described below.
Harwood et al. (1993) state that the current AASHTO model for ISD at uncontrolled intersections (Case I) of 2.0 s for PRT plus 1.0 s to actuate braking or to accelerate to adjust speed does not provide sufficient time to enable approaching drivers to adjust speed to avoid potential collisions. AASHTO uses the following equation to determine the minimum sight distance along each approach:
[1]
ISD = 1.47 V t
Where: ISD = minimum intersection sight distance (ft).
V = speed of vehicle, assumed to be the roadway design speed of the approach.
t = tpr + tadj (s); assumed t=2.0 s.
tpr = perception-reaction time (s); assumed t pr = 2.0 s.
tadj = time required to regulate speed (s); assumed t adj = 1.0 s.
Although a specific value was not recommended, it was concluded that PRT for ISD Case I should be in the range of 2.0 to 3.4 s. In addition, the 1.0 s allowed to adjust speed is not sufficient for drivers to adjust speed, even if both drivers choose correct responses. The authors propose that a value equal to 2.0 s may be more appropriate to accommodate maneuvers based on the right-of-way rule; a value of 3.0 s would accommodate all maneuvers in which one driver brakes and the other continues at constant speed, including those maneuvers opposite to the right-of-way rule. However, providing a PRT for a large percentile of the driving population plus a specified margin of safety may be overly conservative. Other alternatives under consideration include: (1) providing a sight triangle with legs equal to stopping sight distance (SSD) values for the appropriate speed, as is required for ISD Case II which is the most safety-conservative approach to ISD Case I; and (2) using the current AASHTO model assuming approach speeds lower than the design speed, which has the potential to reduce the required sight distance.
The PRT for intersections with yield control on the minor road (Case II) was determined by Harwood et al. (1993) to be adequate for safe operations, however further investigations are planned in Phase II to determine whether yield-controlled intersections can be operated safely with less ISD than currently required. Alternative models under review include: (1) a model that assumes approach speeds lower than the design speed; (2) a model that assumes that drivers will adjust speed rather than stop; (3) a model that will provide the designer with a choice between a model based on adjusting speed and a model based on stopping; and (3) a model that will allow sufficient ISD for a driver to turn left or right onto the major road, as well as to cross or stop.
The current perception-reaction time for ISD Case IIIA (intersections with stop-control on the minor road-crossing maneuver) of 2.0 s was also deemed adequate by Harwood et al. (1993) based on their review of the literature (McGee and Hooper, 1983; Hostetter et al., 1986; and Lerner et al., 1995). In their sensitivity analysis, Harwood et al. (1993) found that ISD for Case IIIA is relatively insensitive to PRT, and any change in PRT would have little effect on the ISD requirements even if the need for such a change were indicated. Several alternative models include (1) a model that updates truck acceleration rates; (2) a model based on gap acceptance; and (3) the elimination or reduction in importance of Case IIIA.
Harwood et al. (1993) noted, however, that Cases IIIB and IIIC are almost always more critical than Case I, as they most often control ISD case. For Case IIIB (left turn maneuver at stop-controlled intersection) the current AASHTO model was determined to provide sight distances for left-turn maneuvers at stop-controlled intersections that are longer than needed for safety, because (1) drivers perform left turns at these intersections every day with less sight distance than required by the current model and (2) major road drivers often slow down to speeds less than 85 percent of the design speed to accommodate turning maneuvers by minor-road vehicles. AASHTO's assumption in calculating required ISD for CASE IIIB is that the major road vehicle reduces speed from the design speed to 85 percent of the design speed, and the left-turning vehicle departs from a stop and accelerates to 85 percent of the major road design speed. Harwood et al.(1993) note that a major concern with the current AASHTO model for Case IIIB is that it is based on an assumption concerning the deceleration behavior of the major road vehicle that is not backed by field data. The current PRT of 2.0 s for the minor-road driver used in ISD Case IIIB was deemed adequate, however, the PRT requirements of the major-road driver have not been determined to date. The sight distance requirements of Case IIIB (left-turn maneuver) and IIIC (right-turn maneuver) appear to be so nearly identical, according to Harwood et al. (1993) that the use of the same ISD model is appropriate.
Harwood, Mason, Brydia, Pietrucha, and Gittings (in press) used findings from observational field studies in Phase II of NCHRP 15-14(1) to generate recommendations for Case III ISD. For Cases I, II, III, IV and V, they evaluated the current AASHTO policy, surveyed the policies of current highway agencies, and performed an evaluation of alternative ISD models and methodologies. Although driver age was not included as a field study variable, the researchers took into consideration the findings reported in the literature regarding differences in performance (most notably PRT) as a function of driver age. A description of the findings and preliminary recommendations follows for each ISD case examined in NCHRP Project 15-14(1).
ISD Case I
For Case I, the recommended sight distance model for uncontrolled intersections is based on stopping, rather than adjusting speed; a model based on adjusting speed without stopping cannot assure that a collision can be avoided if the drivers of both potentially conflicting vehicles choose to slow down or stop. The recommended model, while based on stopping, incorporates the concept that was supported by field observations, that drivers on approaches to uncontrolled intersections typically slow to 50 percent of the midblock running speed before reaching the intersection, whether a potentially conflicting vehicle comes into view or not. The study authors recommended a PRT for Case I of 2.5 s, rather than the 2.0 s used in current policy. Table 4, taken from Harwood et al. (in press), presents the recommended ISD values for intersections with no control, and provides a comparison of the recommended values with current AASHTO policy.
Table 4. Recommended ISD for uncontrolled intersections, based on stopping from a reduced speed.
(Taken from Harwood et al., in press.)
|
Deign Speed (km/h) |
Sight Distance (m) |
|
|
Based on stopping from a reduced speed |
Based on current AASHTO policy |
|
|
20 |
20 |
20 |
|
30 |
30 |
25 |
|
40 |
30 |
35 |
|
50 |
40 |
40 |
|
60 |
50 |
50 |
|
70 |
65 |
60 |
|
80 |
80 |
65 |
|
90 |
95 |
75 |
|
100 |
120 |
85 |
|
110 |
140 |
90 |
|
120 |
165 |
100 |
ISD Case III
For ISD Cases III B and C, Harwood et al. (in press) report that their field study results indicated that a model based on gap acceptance held great potential as a method for determining ISD criteria at stop-controlled intersections. Table 5 compares the results of the Harwood et al. (in press) field studies, with those recently obtained by Lerner et al. (1995) and Kyte et al. (1995).
Harwood et al. (in press) postulate that the concept of a single critical gap across all design speeds is supported by the fact that the Lerner and Kyte data show that the critical gap does not vary as a function of approach speed. Harwood et al. (in press) report that at least two State highway agencies use design criteria based on gap acceptance for ISD Case IIIB. The California Department of Transportation uses criteria for Case IIIB based on a
7.5 s gap in major-road traffic. Similarly, the Oklahoma Department of Transportation uses an 8.0 s gap for turning maneuvers by passenger cars and a 12.0 s gap for turning maneuvers by trucks in Case IIIB. The gap acceptance model examined by Harwood et al. for ISD Case III, and recommended as a replacement for the current AASHTO model is:
ISD = 1.47 * V * G [2]
where: ISD = intersection sight distance (ft).
V = major-road design speed (mi/h).
G = specified critical gap (s).
Based on the data collected in the three field studies noted above, Harwood et al. (in press) made the recommendations for the value of G (critical gap) presented in table 6, for left and right turns onto the major roadway at stop-controlled intersections.
Table 5. Comparison of gap acceptance field study results with results from other studies, based on data for turns from stop-controlled intersections onto a two-lane major road. (Taken from Harwood et al., in press.)
|
Maneuver |
Critical Gap (s) |
|||
|
Harwood et al. (in press) Raff Method |
Harwood et al. (in press) Logistic Regression |
Lerner et al. (1995) |
Kyte et al. (1995) |
|
|
Right Turn from Minor Road |
6.3 |
6.5 |
7.0 |
6.2 |
|
Left Turn from Minor Road |
8.0 |
8.2 |
7.0 |
7.1 |
Table 6. Recommended critical gap value (travel time) for determining sight distance for left and right turns onto the major road at stop-controlled intersections (Cases IIIB and IIIC).
(Taken from Harwood et al., in press.)
|
Vehicle Type |
Travel Time (s) at Design Speed of Major Road |
|
Passenger Car |
7.5 |
|
Single-Unit Truck |
9.5 |
|
Combination Truck |
11.5 |
|
Note: For left turns onto two-way highways with more than two lanes, add 0.5 s for passenger cars or 0.7 s for trucks for each additional lane to be crossed. |
|
It should be noted that PRT is only one component of the AASHTO sight distance calculation. The equations used to calculate the distance also include a maneuver time ta. For the Case IIIA crossing maneuver, ta is the time required to accelerate and traverse the distance to clear the major highway traveled way. For Case IIIB and C (left and right turn), ta is the time required to accelerate and traverse the distance to clear the traffic in the lane approaching the turning vehicle, and come up to a speed of 85 percent of the mainline design speed. Results of a recently completed observational field study indicated that older drivers (ages 65 and older) took 0.74 s longer to reach a reference point 36.5 m (120 ft) downstream of a right turn at a nonchannelized intersection than younger drivers. This reference point served as a surrogate measure of acceleration and results showed that older drivers had significantly slower maneuver times (Staplin, Harkey, Lococo, and Tarawneh, 1996). Similarly, it was found that drivers ages 75 and older (old-old) took significantly longer to accelerate to a reference point 30.5 m (100 ft) after turning right, than drivers ages 25 to 45 (young/middle-aged) and drivers ages 65 to 74 (young-old), and both older driver groups made right turns at speeds that were significantly slower than drivers ages 25 to 45. Mean times to reach the 30.5 m (100 ft) reference point were 5.29 s, 5.27 s, and 5.61 s for drivers ages 25 to 45, 65 to 74, and 75+ respectively. Also, young/middle-aged drivers made right turns at an average of 29 km/h (18 mi/h), compared to 21 km/h (13 mi/h) for both the young-old and old-old driver groups. These performance differences may explain why older drivers are overrepresented in accidents at intersections as the turning drivers. Council and Zegeer's 1992 analysis of accidents at stop-controlled intersections showed that the most frequent scenario consisted of a middle aged driver (ages 30 to 50) traveling straight and an older driver (ages 65 to 74 and 75+) turning left or right from a stop. The middle-aged drivers were more likely to be coded as having exhibited "no improper driving," while the older drivers were more likely to be cited for failing to yield, disregarding the stop sign, or driver inattention.
For the crossing maneuver (Case IIIA), Kyte et al. (1995) found that the critical gap of 6.5 s was less than that required for left and right turns. However, as stated by Harwood et al. (in press), a crossing vehicle must cross more lanes than a left-turning vehicle, so additional time is required for crossing these additional lanes. Therefore, on multilane highways, the crossing maneuver should be checked to determine whether it is more critical than the left- and right-turn maneuvers. Normally, this will only occur for roadways wider than six lanes. Four other situations listed by Harwood et al. in which the crossing maneuver could be a key consideration in the design of sight distance at a stop-controlled intersection (noted to be "quite unusual") are: (1) intersections where the crossing maneuver is the only legal maneuver; (2) intersections where major road traffic approaching from the left may turn left but not right; (3) intersections with substantial upgrades on the departing leg of the crossroad, which would slow crossing vehicles (particularly trucks) but not turning vehicles; and (4) intersections where substantial truck volumes make the crossing maneuver, but not left or right turns. Table 7 shows the recommended values to be used for the value of G in the gap acceptance equation, for crossing the major road at a stop-controlled intersection.
Table 7. Recommended critical gap value (travel time) for determining sight distance for the crossing maneuver at stop-controlled intersections (Cases IIIA).
(Taken from Harwood et al., in press.)
|
Vehicle Type |
Travel Time (s) at Design Speed of Major Road |
|
Passenger Car |
6.5 |
|
Single-Unit Truck |
8.5 |
|
Combination Truck |
10.5 |
|
Note: For crossing a major road with more than two lanes, add 0.5 s for passenger cars or 0.7 s for trucks for each additional lane to be crossed. |
|
ISD Case II
With regard to the PRT required for ISD Case II (yield-control on the minor road), McGee and Hooper (1983) concluded that the same PRT values used for Case I should be applied to Case II. For both cases, they recommend the use of a PRT value of 3.4 s as appropriate for the 85th percentile of the driving population. Hostetter et al. (1986) concluded from their field study that the current AASHTO value of 2.5 s is adequate for Case II PRT. Harwood et al. (in press) agree that the perceptual requirements of ISD Cases I and II are essentially equivalent and therefore recommend a perception-reaction time of 2.5 s for use in ISD Case II.
In developing recommendations for Case II ISD, Harwood et al. (in press) determined that at four-leg, yield-controlled intersections, two types of approach sight triangles should be considered, one based on the sight distance needed for the crossing maneuver and one on the sight distance needed for left- and right-turn maneuvers. At three-leg yield-controlled intersections, no crossing maneuver is feasible, so only the approach sight triangle for left- and right-turn maneuvers needs to be considered. For the crossing maneuver, the recommended lengths of the leg of the approach sight triangles along the minor road, both to the left and to the right are shown in table 8. These lengths are based on a modification of the SSD model, and are equal to or slightly lower than the current values for the minor-road leg in AASHTO ISD Case II, which are identical to the AASHTO SSD values. The recommended lengths are based on the field observation that vehicles on yield-controlled approaches typically slow to 60 percent of their midblock running speed, even if no potentially conflicting traffic is present on the intersecting approach. The values shown in this table should be adjusted as appropriate for the grade of the yield-controlled approach. The leg of each sight triangle along the major road should be based on the distance that would be traversed in the appropriate time shown in table 9, by a vehicle traveling at the design speed of the major road. The recommended lengths for the leg of the clear sight triangle along the major road are generally longer than the values recommended in current AASHTO policy, which are based on the AASHTO SSD criteria.
Table 8. Leg of sight triangle along the minor road for crossing maneuvers from a yield-controlled approach.
(Taken from Harwood et al., in press.)
|
Design Speed (km/h) |
Length of Minor-Road Leg of Sight Triangle (m) |
Current AASHTO SSD Criteria (m)* |
|
30 |
25 |
30 |
|
40 |
35 |
45 |
|
50 |
50 |
65 |
|
60 |
65 |
85 |
|
70 |
85 |
115 |
|
80 |
110 |
140 |
|
90 |
135 |
170 |
|
100 |
165 |
205 |
|
110 |
200 |
250 |
|
120 |
230 |
290 |
|
* High end of range in 1994 Green Book (rounded). |
||
For left- and right-turn maneuvers from a yield-controlled minor road, the recommended length of each approach sight triangle along the minor road is 25 m (80 ft), independent of the design speed of the minor road (Harwood et al., in press). The length of the sight triangle along the major road is equal to the distance traveled at the design speed of the major road in the travel times show in table 10, which are 0.5 s longer than those recommended for left and right turns onto a major road for stop-controlled intersections.
Table 9. Travel time for a minor-road vehicle to reach, cross, and clear the major road from a yield-controlled approach.
(Taken from Harwood et al., in press.)
|
Minor-Road Design Speed (km/h) |
Travel Time for a Minor-Road Vehicle, tc (seconds)* |
|
Intersection Width = 7.3 m (24 ft), Vehicle Length = 5.8 m (19 ft) |
|
|
30 |
6.7 |
|
40 |
6.8 |
|
50 |
6.9 |
|
60 |
7.7 |
|
70 |
8.4 |
|
80 |
9.5 |
|
90 |
10.5 |
|
100 |
11.4 |
|
110 |
12.6 |
|
120 |
13.5 |
|
Intersection Width =14.6 m (48 ft), Vehicle Length=5.8 m (19 ft) |
|
|
30 |
7.6 |
|
40 |
7.7 |
|
50 |
7.8 |
|
60 |
8.4 |
|
70 |
9.0 |
|
80 |
10.0 |
|
90 |
11.0 |
|
100 |
11.9 |
|
110 |
13.0 |
|
120 |
13.8 |
|
Intersection Width=7.3 m (24 ft), Vehicle Length=19.8 m (65 ft) |
|
|
30 |
8.5 |
|
40 |
8.7 |
|
50 |
8.9 |
|
60 |
9.1 |
|
70 |
9.6 |
|
80 |
10.5 |
|
90 |
11.4 |
|
100 |
12.3 |
|
110 |
13.3 |
|
120 |
14.2 |
|
* The leg of the sight triangle along the major road is the distance that would be traveled in the specified time (tc) by a vehicle traveling at the major-road design speed. |
|
Table 10. Recommended travel times for determining sight distance for left and right turns onto the major road at yield-controlled intersections (Case II).
(Taken from Harwood et al., in press.)
|
Vehicle Type |
Travel Time (s) at Design Speed of Major Road |
|
Passenger Car |
8.0 |
|
Single-Unit Truck |
10.0 |
|
Combination Truck |
12.0 |
|
Note: For left turns onto two-way highways with more than two lanes, add 0.5 s for passenger cars or 0.7 s for trucks for each additional lane to be crossed. |
|
For a vehicle that intends to turn left or right onto the major road, the 25-m leg of the sight triangle along the minor road is greater than the recommended length of the minor-road leg for a stop-controlled intersection, but is substantially less than the current AASHTO values for yield-controlled intersections, which are based on the AASHTO SSD criteria. The recommended values for the leg of the sight triangle along the major road are generally longer than the values in current AASHTO policy for ISD Case II, which are based on SSD. These recommended values are greater than the current AASHTO values because AASHTO does not currently consider the sight distance requirements for turning onto the major road from a yield-controlled approach without stopping. Harwood et al. (in press) state that where the greater sight distances required by a yield sign (as compared to a stop sign) can not be provided economically, the simplest response is to install a stop sign, rather than a yield sign. The greater freedom of action afforded at a yield-controlled intersection (slow or stop), requires a driver on a yield-controlled approach to see a greater length of the major road at a greater distance from the intersection, than a driver on a stop-controlled approach.
ISD Case IV
AASHTO (1994) states that at signalized intersections, sight distance based on the CASE III procedures should be available to the driver, based on the increased driver workload at intersections, and the problems associated with unanticipated vehicle conflicts at signalized intersections (e.g., violation of the signal, right turns on red, signal malfunction, and use of flashing operations). Based on the evaluation of the ISD requirements for intersections with signal control, Harwood et al. (in press) support the policy of providing sight distance for ISD Case III for the following Case IV conditions: for both left and right turns at signalized intersections where flashing operation is used during low traffic volume periods; and for right turns from signalized intersection approaches on which right-turn-on-red maneuvers are permitted. They also recommended eliminating signal malfunctions and signal violations as a consideration in ISD Case IV, based on an assumption that the frequency of accidents related to signal malfunction and unintentional signal violations is "undoubtedly small." This is certain to vary across jurisdictions, however, arguing for retention of the current AASHTO (1994) policy.
ISD Case V
Prior to the 1990 AASHTO Green Book, the issue of intersection sight distance (ISD) for a driver turning left off a major roadway onto a minor roadway or into an entrance was not specifically addressed. In the 1990 Green Book, the issue was addressed at the end of the Case III discussions in two paragraphs. In the 1994 Green Book, these same paragraphs have been placed under a new condition referred to as Case V. The equation used for determining ISD for Case V was simply taken from the Case IIIA (crossing maneuver at a stop-controlled intersection) and Case IIIB (left-turn maneuver from a stop-controlled minor road onto a major road) conditions, with the primary difference between the cases being the distance traveled during the maneuver. A central issue in defining the ISD for Case V involves a determination of whether the tasks that define ISD for Cases IIIA and IIIB are similar enough to the tasks associated with Case V to justify using the same equation, which follows:
SD=1.47 V (J +ta) [3]
where: V = major roadway design speed (mi/h).
J = sum of perception-reaction time (PRT) and the time required to actuate the clutch or actuate an automatic shift ( J is currently assumed to be 2.0 s).
ta = time to cover a given distance during acceleration (i.e., maneuver time), which is read from AASHTO figure IX-33.
For Case IIIA (crossing maneuver), the sight distance is calculated based on the need to clear traffic on the intersecting roadway on both the left and right sides of the crossing vehicle. For Case IIIB (left turn from a stop), sight distance is based on the requirement to, first, clear traffic approaching from the left, and then, enter the traffic stream of vehicles from the right. It may be demonstrated that the perceptual judgments required of drivers in both of these maneuver situations increase in difficulty when opposing through traffic must be considered.
The perceptual task of turning left from a major roadway at an unsignalized intersection or during a permissive signal phase at a signalized intersection requires a driver to make time-distance estimates of a longitudinally moving target as opposed to a laterally-moving target. Lateral movement (also referred to as tangential movement), describes a vehicle that is crossing an observer's line of sight, moving against a changing visual background where it passes in front of one fixed reference point after another. Longitudinal movement, or movement in depth, results when the vehicle is either coming towards or going away from the observer. In this case there is no change in visual direction, only subtle changes in the angular size of the visual image, typically viewed against a constant background. Longitudinal movement is a greater problem for drivers because the same displacement of a vehicle has a smaller visual effect than when it moves laterally—that is, lateral movement results in a dramatically higher degree of relative motion (Hills, 1980).
In comparison to younger subjects, a significant decline for older subjects has been reported in angular motion sensitivity. In a study evaluating the simulated change in the separation of taillights indicating the overtaking of a vehicle, Lee (1976) found a threshold elevation greater than 100 percent for drivers ages 70 to 75 compared to drivers ages 20 to 29 for brief exposures at night. Older persons may in fact require twice the rate of movement to perceive that an object's motion in depth is approaching, given a brief duration (2.0 s) of exposure. In related experiments, Hills (1975) found that older drivers required significantly longer to perceive that a vehicle was moving closer at constant speed: at 31 km/h (19 mi/h), decision times increased 0.5 s between ages 20 and 75. This body of evidence suggests that the 2.0 s PRT (i.e., variable J in the ISD equation above) used for Cases III and V may not be sufficient for the task of judging gaps in opposing through traffic by older drivers. A revision of Case V to determine the minimum required sight distance that more accurately reflects the perceptual requirements of the left-turn task may therefore be appropriate.
Harwood et al. (in press) recommend that at locations where left turns from the major road are permitted at intersections and driveways, at unsignalized intersections, and at signalized intersections without a protected turn phase, sight distance along the major road should be provided based on a critical gap approach, as was recommended for left and right turns from the minor road at stop-controlled intersections. The gap acceptance model developed and proposed to replace the current ISD AASHTO model is:
ISD = 1.47VG [4]
where: V = design speed on the major road (mi/h).
G = specified critical gap (seconds); equal to 5.5 s for crossing one opposing lane plus an additional 0.5 s for each additional opposing lane.
Field data were collected in the NCHRP study to better quantify the gap acceptance behavior of passenger car and truck drivers, but only for left-and right-turning maneuvers from minor roadways controlled by a STOP sign (Cases IIIB and C). In the Phase I interim report produced during the conduct of the NCHRP project, Harwood, Mason, Pietrucha, Brydia, Hostetter, and Gittings (1993) reported that the critical gap currently used by the California Department of Transportation is 7.5 s. When current AASHTO Case IIIB ISD criteria are translated to time gaps in the major road traffic stream, the gaps range from 7.5 s (220 ft) at a 32-km/h (20-mi/h) design speed to 15.2 s (1,560 ft) at a 112.6-km/h (70-mi/h) design speed. Harwood et al. (1993) stated that the rationale for gap acceptance as an ISD criterion is that drivers safely accept gaps much shorter than 15.2 s routinely, even on higher-speed roadways.
In developing the gap acceptance model for Case V, Harwood et al. (in press) relied on data from studies conducted by Kyte et al. (1995) and Micsky (1993). Kyte et al. (1995) recommended a critical gap value of 4.2 s for left turns from the major road by passenger cars for inclusion in the unsignalized intersection analysis procedures presented in the Highway Capacity Manual (TRB, 1994). A constant value was recommended regardless of the number of lanes to be crossed, however, a heavy-vehicle adjustment of 1.0 s for two-lane highways and 2.0 s for multilane highways was recommended. Harwood et al. (in press) reported that Micsky’s 1993 evaluation of gap acceptance behavior for left turns from the major roadway at two Pennsylvania intersections, resulted in critical gaps with 50 percent probability of acceptance (determined from logistic regression) of 4.6 s and 5.3 s. Using the rationale that design policies should be more conservative than operational criteria such as the Highway Capacity Manual, Harwood et al. (in press) recommended a critical gap for left turns from the major roadway of 5.5 s, and that the critical gap be increased to 6.5 s for left turns by single-unit trucks and 7.5 s for left turns by combination trucks. In addition, if the number of opposing lanes to be crossed exceeds one, an additional 0.5 s per additional lane for passenger cars and 0.7 s per additional lane for trucks is recommended.
It is important to note that the NCHRP study did not consider driver age as a variable. However, Lerner, Huey, McGee, and Sullivan (1995) collected judgments about the acceptability of gaps in traffic as a function of driver age, for left turn, right turn, and through movements at stop-controlled intersections. While noting that these authors found no significant differences between age groups in the total time required to perceive, react, and complete a maneuver in a related Case III PRT study, the Lerner et al. (1995) findings indicate that younger drivers accept shorter gaps than older drivers. The 50-percent gap acceptance point was about 7 s (i.e., if a gap is 7 s long, only about half of the subjects would accept it). The 85th percentile point was approximately 11 s. The oldest group required about 1.1 s longer than the youngest group.
In an recently completed observational field study of driver performance as a function of left-turn lane geometry, mean left-turn critical gap sizes (seconds) across four locations where the main road design speed was 56 km/h (35 mi/h), for drivers who had positioned their vehicles within the intersection, were 5.90 s (young/middle-aged females), 5.91 s (young/middle-aged males), 6.01 s (young-old females), 5.84 s (young-old males), 6.71 s (old-old females) and 6.55 s (old-old males). Prominent trends indicated that older drivers demonstrated larger critical gap values at all locations. A Tukey test for multiple comparisons showed that the young/middle-aged and young-old groups were not significantly different from each other; however, both were significantly different from the old-old group. Critical gap sizes displayed in the laboratory simulation study in the same project, ranged from 6.4 s to 8.1 s for young middle/aged drivers, viewing oncoming vehicles traveling at 56 km/h (35 mi/h), while critical gaps for drivers ages 75 and older ranged from 5.8 to 10.0 s (Staplin et al., 1996).
These diverse findings argue that an appropriate value for G in the gap acceptance model will lie toward the upper end of the 7- to 11-s range to accommodate older drivers, while also preserving a margin of safety. This strategy acknowledges the diminished capability of older drivers to judge oncoming vehicle speed in a situation that places this group of road users at particular risk, i.e., when an opposing through vehicle approaches at excessive speed.
Regarding PRT for Cases III and V, AASHTO (1994) assumes a PRT of 2.0 s as the time necessary for the driver to look in both directions of the roadway, to perceive that there is sufficient time to perform the maneuver safely, and to shift gears, if necessary, prior to starting. This value is based on research performed by Johansson and Rumar (1971). The PRT is defined as the time from the driver's first look for possible oncoming traffic to the instant the car begins to move. Some of these operations are done simultaneously by many drivers, and some operations, such as shifting gears may be done before searching for intersecting traffic. AASHTO states that a value of 2.0 s is assumed to represent the time taken by the slower driver.
Regarding the value of ta which is read from AASHTO figure IX-33, the Staplin et al. (1996) data found no significant differences in maneuver time as a function of age, for the drivers turning left at the four intersections studied (which had distances ranging from 25.6 m to 32.3 m [84 to 106 ft]). Maneuver times for positioned and unpositioned vehicles, however, were significantly different. Since significantly fewer older drivers positioned themselves in the field study, the design value for this factor (maneuver time) should be based on that obtained for unpositioned drivers. A comparison of the 95th percentile clearance times demonstrated by positioned drivers and unpositioned drivers at each location with AASHTO values is presented in table 11.
Table 11. Comparison of clearance times obtained in the Staplin et al. (1996) field study with AASHTO Green Book values used in sight distance calculations.
|
Measure |
Vehicle Location |
Left-Turn Lane Geometry |
|||
|
-14-ft Offset |
-3-ft Offset |
0-ft Offset |
+6-ft Offset |
||
|
Distance Traveled (ft) |
Positioned |
70 ft |
67 ft |
64 ft |
70 ft |
|
95th Percentile Clearance Time (s) From Field Study |
Positioned |
3.8 s |
3.9 s |
3.9 s |
3.9 s |
|
AASHTO Clearance Time (s) From Figure IX-33 |
Positioned |
5.1 s |
5.0 s |
5.0 s |
5.1 s |
|
Distance Traveled (ft) |
Unpositioned |
106 ft |
98 ft |
84 ft |
88 ft |
|
95th Percentile Clearance Time (s) From Field Study |
Unpositioned |
6.7 s |
6.4 s |
6.6 s |
5.7 s |
|
AASHTO Clearance Time (s) From Figure IX-33 |
Unpositioned |
6.5 s |
6.2 s |
5.9 s |
6.0 s |
1 ft = 0.305 m
Current and proposed sight distance models were exercised by Staplin et al. (1996) using data collected in the observational field study. For this comparison, two basic models were selected. The first model (Model 1) was the current model in the AASHTO Green Book for computing ISD, which relied on a PRT of 2.0 s and maneuver time taken from figure IX-33 in the Green Book. The second model was the gap model which has been developed as part of the NCHRP project 15-14(1), and relies on the critical gap in place of PRT and maneuver time (see equation 4). Each of these models was used with the appropriate design values to compute the required sight distance at the each of the selected intersections. The models were then used with adjusted design values or actual data collected in the field to also determine the required sight distance at each location.
The first adjustment made to the current AASHTO model was an increase in the PRT. As previously noted, several studies have examined and critiqued the use of 2.0 s for PRT in this model. Thus, an adjusted model (Model 3) with a PRT of 2.5 s, which is equivalent to the value used in SSD calculations, was also included in the analysis.
One of the data elements collected as part of this research was the maneuver time of the left-turning driver. This time is equivalent to ta in the AASHTO model. These times were measured from two locations, depending on how the drivers positioned themselves within the intersection prior to turning. The first location was from a position within the intersection, approaching the median or center line of the cross street. This type of driver was referred to as a "positioned" driver. The second location was from a position at or behind the stop bar or end of the left-turn bay. This type of driver was referred to as an "unpositioned" driver. Using the original AASHTO model and these field data maneuver times, sight distances were computed with two additional models, substituting the 95th percentile maneuver time from the distribution of all unpositioned drivers in one model (Model 4), and 95th percentile maneuver time from the distribution of all positioned drivers in the other model (Model 5).
Critical gap data were also collected and analyzed by driver age group at each of the intersections studied. The drivers ages 75 and older accepted significantly larger gaps compared to the other age groups. Thus, two different critical gaps were used in adjusted gap models to compute the required sight distances. These models simply modify the value of G in Model 2. In the first adjustment, the critical gap for all drivers (across age) as measured in the field was substituted for the value of G (Model 6), and in the second adjustment, the critical gap for drivers ages 75 and older as measured in the field was substituted for the value of G (Model 7).
A detailed discussion of the outputs from the model exercise is provided in the Intersection Geometric Design and Operational Guidelines for Older Drivers and Pedestrians (Staplin, Harkey, Lococo, and Tarawneh, 1996). However, one significant result is that the required sight distances computed using the modified AASHTO model (where PRT was increased to 2.5 s) produced required sight distance values that were the most predictive of actual field operations. Thus, if the current AASHTO model is deemed to be the appropriate one for calculating ISD as it relates to drivers turning left from a major roadway, there is evidence that the PRT value should be increased to 2.5 s to provide adequate sight distance at most locations. The gap model, on the other hand, produced sight distance values that were approximately 23 percent shorter than the current AASHTO model. If the gap model is going to be used, particularly where there are significant volumes of older left-turning drivers, there may need to be an adjustment factor applied to increase the sight distance to better accommodate this driver age group. Also, to the extent that the current AASHTO ISD model produces longer sight distances than the gap model, it may be most prudent—considering the increasing range of driver (diminished) capabilities—to regard the difference as simply an additional margin of safety.
Channelization
Channelization is defined as "...the separation or regulation of conflicting traffic movements into definite paths of travel by traffic islands or pavement marking to facilitate the safe and orderly movements of both vehicles and pedestrians" (AASHTO, 1990). According to ITE (1984), the most common reasons for using channelization include:
· Separation of conflicts. ·Protection of pedestrians.
·Control of angle of conflict. ·Control of speed.
·Protection and storage of turning ·Location of traffic control devices.
and crossing vehicles. ·Arrangements to favor predominant turning
·Reduction of excessive pavement areas. movements.
·Prohibition of specific traffic maneuvers.
The effectiveness of channelization from a safety perspective has been documented in several studies. An evaluation of Federal Highway Safety Program projects showed channelization to produce an average benefit/cost ratio of 2.31 (Strate, 1980). Another study showed accidents of all types to be reduced by an average of 32.4 percent and injury accidents to be reduced by 50 percent where channelization was used (Dale, 1971;1973). An early study comparing the accident experience of curbed medians compared to painted medians found that the accident rate on the street that contained a painted median (zebra stripe) with left turn bays at selected locations was 2.63 times that of the street that contained a curbed median and intersection channelization (Frick, 1968). Although the effects of age were not evaluated in this study, the total number of annual accidents per mile with curbed medians was approximately one-third that of streets with painted medians. One of the advantages of using curbed medians and intersection channelization cited in this research is that it gives a better indication to motorists of the proper use of travel lanes and intersections. Neuman (1985) reports that in a set of studies performed by the California Department of Public Works (1967) investigating the differences in accident experience with raised versus painted channelization, the findings were as follows: raised traffic islands are more effective than painted islands in reducing frequencies of night accidents, particularly in urban areas; and little difference is noted in the effectiveness of raised versus painted channelizing islands at rural intersections.
One of the most common uses of channelization is for the separation of left-turning vehicles from the through traffic stream. The reasons for designing intersections with left-turn lanes include: (1) proven safety effectiveness; (2) effectiveness in improving intersection capacity; (3) flexibility in possible signal phasing schemes; and (4) understanding of operation by the driving public. Guidance on when to include left-turn lanes varies with each State as revealed in a survey of practices conducted by Neuman (1985).
The safety benefits of left-turn channelization have been documented in several studies. One study indicates that accidents at signalized intersections with a left-turn lane in combination with and without a left-turn signal phase, will reduce accidents by 36 percent and 15 percent, respectively. At nonsignalized intersections with painted channelization separating the left-turn lane from the through lane, accident reductions for rural, suburban and urban areas would be 50, 30, and 15 percent, respectively. If raised channelization devices are used, the accident reductions become 60, 65, and 70 percent in rural, suburban, and urban areas, respectively (McFarland et al., 1979). Hagenauer, Upchurch, Warren, and Rosenbaum (1982) found that the channelization of intersections reduced accidents by 32 percent and injury accidents by 50 percent.
At the same time, in the Transportation Research Circular's (1991), "Research Problem Statement Impact of Aging Driver Population on Geometric Design," it was reported that the aged driver, having poorer vision, slower physical reaction time, lower degree of awareness, and reduced ability to maneuver the vehicle, is more likely to be negatively impacted by a raised median than is the average driver; and because medians are fixed objects, when they are struck they pose a serious threat of loss of control, especially for aged drivers. The typical curbed median offers low to no contrast with the adjacent pavement and is difficult to reflectorize at night. Low-beam headlight limitations, coupled with reduced vision of the aged driver, compounds the visibility problem. In addition, raised medians and raised corner islands, when used together, often create turning path options at complex intersections that are confusing to the average driver, and disproportionately so for the aged one. Thus, to realize the safety benefits channelization can provide, it is particularly important that treatments of raised surfaces to ensure their visibility by (older) drivers with diminished vision be implemented, so these road users can detect the channelizing devices and select their path accordingly.
A benefit in the use of channelization is the provision of a refuge for pedestrians. Refuge islands are a design element that can aid older pedestrians who have slow walking speeds. "The specific function of a refuge island is to provide a place of safety for pedestrians who cannot safely cross the entire roadway width at one time in safety because of changing traffic signals or oncoming traffic" (MUTCD, 1988). While the intent and purpose of the refuge island is well defined, no quantitative warrants are provided by either the MUTCD or AASHTO to determine when such an island is needed. However, areas where they are likely to be needed (e.g., multilane roadways and large or irregularly shaped intersections) are provided in both documents. Once the need is determined, the size and location of such islands can be determined with the help of these two documents as well as the Traffic Control Devices Handbook (FHWA, 1983) and Accessibility for Elderly and Handicapped Pedestrians - A Manual for Cities (Earnhart and Simon, 1987). With respect to the Hagenauer et al. study cited earlier, Hauer (1988) states that because channelization in general serves to simplify an otherwise ambiguous and complex situation, the channelization of an existing intersection might enhance both the safety and mobility of older persons, as well as enhance the safety of other pedestrians and drivers. However, in designing a new intersection, he states that the presence of islands is unlikely to offset the disadvantage of large intersection size for the pedestrian.
With regard to median width, the results of an recently conducted accident analysis and field observational study showed that at rural unsignalized intersections, both accidents and undesirable driving behavior decrease as the median width increases. However, at suburban signalized and unsignalized intersections, accidents and undesirable behavior increase as the median width increases (Harwood, Pietrucha, Woolridge, Brydia, and Fitzpatrick, 1995). Because the accident rate at suburban signalized intersections increases as the median width increases, and suburban signalized intersections can generally operate effectively with median widths less that 7.6 m (25 ft), Harwood et al. (1995) suggest that medians wider than 7.6 m (25 ft) are not generally recommended at suburban signalized intersections unless required for the selected left-turn treatment. At suburban unsignalized intersections, it was recommended that medians not be wider than necessary to provide whatever left-turn treatment is selected. This recommendation is also consistent with a desire to minimize crossing distances for older pedestrians.
A field study evaluating four right-turn lane geometries to examine the effect of channelized right-turn lanes and the presence of skew on the right-turn maneuver made by drivers of different ages and gender is reported in Staplin, Harkey, Lococo, and Tarawneh (1996). One-hundred subjects divided across three age groups drove their own vehicles around test routes using the local street network in Arlington, VA. The three age groups were young/middle-aged (25 to 45), young-old (65 to 74) and old-old (75+). As diagrammed in figure 2, the four right-turn lane geometries were:
(a) A nonchannelized 90-degree intersection where drivers had the chance to make a right-turn-on-red around a 12.2-m (40-ft) radius. This site served as a control geometry to examine how channelized intersections compare to non-channelized intersections.
(b) A channelized right-turn lane at a 90-degree intersection with an exclusive use (acceleration) lane on the receiving street. Under this geometric configuration, drivers did not need to stop at the intersection, and they were removed from the conflicting traffic upon entering the cross street. They had the opportunity to accelerate in their own lane on the cross street, and then change lanes downstream when they perceived that it was safe to do so.
(c) A channelized right-turn lane at a 65-degree skewed intersection without an exclusive use lane on the receiving street.
(d) A channelized right-turn lane at a 90-degree intersection without an exclusive use lane on the receiving street. Under this geometry, drivers needed to check the conflicting traffic and complete their turn into a through traffic lane on the cross street.
The right-turn maneuver at all locations was made against two lanes carrying through (conflicting) traffic. The two through lanes were the only ones that had a direct effect on the right-turn maneuver. All intersections were located on major or minor arterials within a growing urban area, where the posted speed limit was 56 km/h (35 mi/h). All intersections were controlled by traffic signals with yield control on the three channelized intersections.
Figure 2. Intersection geometries examined in the Staplin et al. (1996) field study of right-turn channelization.
The results indicated that right-turn channelization affects the speed at which drivers make right turns and the likelihood that they will stop before making a right-turn- on-red (RTOR) maneuver. Drivers, especially younger drivers (ages 25 to 45), turned right at speeds 4.8 to 8.0 km/h (3 to 5 mi/h) higher on intersection approaches with channelized right-turn lanes than they did on approaches with unchannelized right-turn lanes.
At the nonchannelized intersection, 22 percent of the young/middle-aged drivers, 5 percent of the young-old drivers, and none of the old-old drivers performed an RTOR without a stop. On approaches with channelized right-turn lanes, young/middle-aged (ages 25 to 45) and young-old drivers (ages 65 to 74) were much less likely to stop before making an RTOR. Where an acceleration lane was available, 65 percent of the young/middle-aged drivers continued through without a complete stop, compared to 55 percent of the young-old drivers and 11 percent of the old-old drivers. Old-old females always stopped before making an RTOR. The increased mobility exhibited by the younger drivers at the channelized right-turn lane locations was not, however, exhibited by the old-old drivers (ages 75 and older), who stopped in 19 of the 20 turns executed at the channelized locations. Also, drivers perceived making a right turn on an approach with a channelized right-turn lane without an acceleration lane on the cross street as being more difficult than at other locations, even more difficult than at skewed intersections.
Offset of Opposite Single Left-Turn Lanes at Intersections
The alignment of opposite left-turn lanes and the horizontal and vertical curvature on the approaches are the principal geometric design elements that determine how much sight distance is available to a left-turning driver. Operationally, vehicles in the opposite left-turn lane waiting to turn left can also restrict the (left-turning) driver's view of oncoming traffic in the through lanes. The level of blockage depends on how the opposite left-turn lanes are aligned with respect to each other, as well as the type/size of vehicles in the opposing queue. Restricted sight distance can be minimized or eliminated by offsetting opposite left-turn lanes so that left-turning drivers do not block each other's view of oncoming through traffic. When the two left-turn lanes are exactly aligned, the offset distance has a value of zero. Negative offset describes the situation where the opposite left-turn lane is shifted to the left. Positive offset describes the situation where the opposite left-turn lane is shifted to the right. Positively offset left-turn lanes and aligned left-turn lanes provide greater sight distances than negatively offset left-turn lanes, and a positive offset provides greater sight distance than the aligned configuration.
Studies examining the types of crashes in which older drivers are over-involved, and the types of maneuvers being performed just prior to the collision, have consistently found that they are over-involved in left-turning accidents at both rural and urban signalized intersections and that failure to yield right-of-way (as the turning driver) was the principal violation type (Council and Zegeer, 1992; Staplin and Lyles, 1991). Problems include the misjudgment of oncoming vehicle speed, misjudgment of available gap, assuming the oncoming vehicle was going to stop or turn, and simply not seeing the other vehicle. Joshua and Saka (1992) noted that sight distance problems at intersections that result from queued vehicles in opposite left-turn lanes pose safety and capacity deficiencies, particularly for unprotected (permissive) left-turn movements. These researchers found a strong correlation between the offset for opposite left-turn lanes—i.e., the distance from the inner edge of a left-turn lane to the outer edge of the opposite left-turn lane—and the available sight distance for left-turning traffic.
Several recent studies examining the minimum required sight distance for a driver turning left from a major roadway to a minor roadway, as a function of major road design speed have provided data necessary to determine: (1) the left-turn lane offset value needed to achieve the minimum required sight distance; and (2) the offset value that will provide unlimited sight distance. A fundamental premise in these studies, which are described below, is that it is not the amount of left-turn lane offset per se, but rather the sight distance that a given level of offset provides that should be the focus of any recommendations pertaining to the design of opposite left-turn lanes.
In a study conducted by McCoy, Navarro, and Witt (1992), guidelines were developed for offsetting opposite left-turn lanes to eliminate the left-turn sight distance problem. All minimum offsets specified in the guidelines are positive. For 90° intersections on level tangent sections of four-lane divided roadways, with 3.6-m (12-ft) left-turn lanes in 4.9-m (16-ft) medians with 1.2-m (4-ft) medial separators, the following conclusions are stated by McCoy et al.: (1) a 0.6-m (2-ft) positive offset provides unrestricted sight distance when the opposite left-turn vehicle is a passenger car, and (2) a 1.06-m (3.5-ft) positive offset provides unrestricted sight distance when the opposite left-turn vehicle is a truck, for design speeds up to 113 km/h (70 mi/h). Table 12 presents the required left-turn sight distance to clear one or both opposing through lanes. The required sight distances for all speeds are greater than the available sight distance to through vehicles in the left lane, and except at very low design speeds, are greater than the available sight distances to through vehicles in the right lane. Table 13 shows the minimum and desirable offsets determined by McCoy et al. (1992). The minimum offsets needed between opposite left-turn lanes to provide adequate sight distance were determined by setting the available sight distance equations equal to the required sight distance equation and solving for the offset.
Table 12. Required left-turn sight distance to clear one or both opposing lanes.
[Taken from Harwood et al., (1995), using data and assumptions from McCoy et al., (1992).]
|
Sight Distance (m) Required To: |
Design Speed of Major Road (km/h) |
||||||||||
|
32 |
40 |
48 |
56 |
64 |
72 |
80 |
89 |
97 |
105 |
113 |
|
|
Clear Opposing Left Through Lane |
75 |
90 |
110 |
130 |
145 |
160 |
180 |
200 |
215 |
235 |
255 |
|
Clear Opposing Left Through Lane |
75 |
95 |
110 |
130 |
150 |
170 |
190 |
210 |
225 |
245 |
265 |
|
Sight Distance (ft) Required To: |
Design Speed of Major Road (mi/h) |
||||||||||
|
20 |
25 |
30 |
35 |
40 |
45 |
50 |
55 |
60 |
65 |
70 |
|
|
Clear Opposing Left Through Lane |
240 |
300 |
360 |
420 |
480 |
530 |
590 |
650 |
710 |
770 |
830 |
|
Clear Opposing Left Through Lane |
250 |
320 |
370 |
430 |
490 |
550 |
620 |
680 |
740 |
800 |
860 |
Table 13. Minimum and desirable offsets for opposite left-turn lanes, as a function of opposite left-turn lane vehicle type (passenger car vs truck).
(Taken from McCoy et al., 1992.)
|
Design Speed (mi/h) |
Minimum Offset (ft) |
Desirable Offset (ft) |
||
|
Passenger Car |
Truck |
Passenger Car |
Truck |
|
|
40 |
1.0 |
2.5 |
2.0 |
3.5 |
|
45 |
1.0 |
3.0 |
2.0 |
3.5 |
|
50 |
1.5 |
3.0 |
2.0 |
3.5 |
|
55 |
1.5 |
3.0 |
2.0 |
3.5 |
|
60 |
1.5 |
3.0 |
2.0 |
3.5 |
|
65 |
1.5 |
3.0 |
2.0 |
3.5 |
|
70 |
1.5 |
3.0 |
2.0 |
3.5 |
Note: 1 ft = 0.305 m
The required sight distances used to determine the minimum offsets were computed using 8.5 s as the time needed to complete a left turn, using the AASHTO (1990) Green Book procedure for computing the required intersection sight distances for crossing maneuvers. The researchers note that the desirable offsets presented in table 13 would not change as a consequence of calculating required sight distance using values greater than or less than 8.5 s as the time to complete a left turn, because the desirable offset is not dependent on required sight distance; instead, the desirable offset provides unrestricted sight distance.
Harwood, Pietrucha, Wooldridge, Brydia, and Fitzpatrick (1995) conducted an observational field study and an accident analysis to develop and recommend appropriate design policies for the selection of median width at rural and suburban divided highway intersections based on operational and safety considerations. They found that at rural unsignalized intersections, both accidents and undesirable driving behavior decrease as median width increases. However, at suburban signalized and unsignalized intersections, accidents and undesirable behavior increase as the median width increases. At suburban intersections, it is therefore suggested that the median should not generally be wider than necessary to accommodate the appropriate median left-turn treatment needed to serve current and anticipated future traffic volumes. Harwood et al.(1995) state that wider medians generally have positive effects on traffic operations and safety, however, wider medians can result in sight restrictions for left-turning vehicles resulting from the presence of opposite left-turn vehicles. The most common solution to this problem is to offset the left-turn lanes, using either parallel offset or tapered offset left-turn lanes.
Figure 3 compares conventional left-turn lanes to these two alternative designs. As noted by the authors, parallel and tapered offset left-turn lanes are still not common, but are used increasingly to reduce the risk of accidents due to sight restrictions from opposite left-turn vehicles. Parallel offset left-turn lanes with 3.6-m (12-ft) widths can be constructed in raised medians with widths as narrow as 7.2 m (24 ft), and can be provided in narrower medians if restricted lane widths or curb offsets are used or a flush median is provided (Bonneson, McCoy, and Truby, 1993). Tapered offset left-turn lanes generally require raised medians of 7.2 m (24 ft) or more in width.
Staplin, Harkey, Lococo, and Tarawneh (1996) performed a laboratory study, field study, and sight distance analysis to measure driver age differences in performance under varying traffic and operating conditions, as a function of varying degrees of offset of opposite left-turn lanes at suburban arterial intersections. In the field study, where left-turn vehicles needed to cross the paths of two or three lanes of conflicting traffic (excluding parking lanes) at 90-degree, 4-legged intersections, four levels of offset of opposite left-turn lane geometry were examined as follows: (a) 1.8-m (6-ft) "partial positive" offset, (b) aligned (no offset) left-turn lanes, (c) 0.91-m (3-ft) "partial negative" offset, and (d) 4.3-m (14-ft) "full negative" offset. All intersections were located within a growing urban area where the posted speed limit was 56 km/h (35 mi/h). Additionally, all intersections were controlled by traffic-responsive semi-actuated signals, and all left-turn maneuvers were completed during the permissive left-turn phase at all study sites. In the analysis of the field study lateral positioning data, it was found that the partial positive offset and aligned locations had the same effect on the lateral positioning behavior of drivers. At the same time, drivers moved approximately 1.5 m (5 ft) to the left when there was a large negative offset (-4.3 m [-14 ft]), clearly indicating that sight distance was limited. There was also a significant difference between the partial negative offset geometry (-0.91 m [-3 ft]) versus the partial positive offset and aligned geometries, suggesting a need for longer sight distance when opposite left-turn lanes are even partially negatively offset. The fact that older drivers
Figure 3. Alternative left-turn treatments for rural and suburban divided highways.
[Taken from Bonneson, McCoy, and Truby (1993); in Harwood et al., (1995)].
(and females) were less likely to position themselves (i.e., pull into the intersection) in the field studies highlights the importance of providing adequate sight distance for unpositioned drivers.
Several issues were raised in the research conducted by Staplin et al. (1996) regarding the adequacy of the current and proposed ISD models for a driver turning left from a major roadway. At the same time, the findings of the research indicated that an increase in sight distance through positively offsetting left-turn lanes can be beneficial to left-turning drivers, particularly older drivers. The researchers exercised seven sight distance models, including the current AASHTO Case V model using 2.0 s for PRT, a modified AASHTO model using a 2.5 s PRT, and a gap model proposed by Harwood et al. (in press). A detailed description of the model parameters and output can be found in the FHWA report entitled Intersection Geometric Design and Operational Guidelines for Older Drivers and Pedestrians (Staplin et al., 1996). Of particular significance was the finding that the modified AASHTO model with the longer PRT of 2.5 s was the model most predictive of actual field operations. Also of significance was the dramatic decrease in required sight distance that occurred with the gap model compared to the traditional AASHTO model. Across all intersections and all design speeds, the required sight distance was approximately 23 percent less using the gap model. However, this was expected since the rationale behind the use of a gap model (c.f. Harwood et al., in press) in place of the current AASHTO model is the fact that drivers accept shorter gaps than those implied by the current model.
Regardless of which model is deemed most appropriate for computing ISD for drivers turning left off a major roadway, one way to increase the sight distance is through positively offset left-turn lanes. As shown in the study by Staplin et al. (1996), such designs result in significantly better performance on the part of all drivers, but especially for older drivers. Prior work by McCoy et al. (1992) examined the issue of offset left-turn lanes and developed an approach that could be used to compute the amount of offset that is required to minimize or eliminate the sight restriction caused by opposing left-turn vehicles. This approach was applied to the intersections in the study by Staplin et al. (1996) to determine the amount of offset that would be required when using the modified AASHTO model (i.e., J = 2.5 s). The left-turn lane offsets required to achieve the minimum required sight distances calculated using the modified AASHTO model (J = 2.5 s) are shown in figure 4, in addition to the offsets required to provide unrestricted sight distance. Based on intersections examined in the study, the offset necessary to achieve unrestricted sight distance for opposing left-turning cars is 1.25 m (4.1 ft) and for opposing left-turning trucks is 1.7 m (5.6 ft).
Interchanges/Ramps
Overall, freeways are characterized by the highest safety level (lowest fatality rates) when compared to the four other types of highways in rural and urban areas, categorized by pre-ISTEA Federal-aid category (AAA, 1995). At the same time, freeway interchanges are design features that have been shown to result in significant safety and operational problems. Taylor and McGee (1973) reported over 20 years ago that erratic maneuvers are a common occurrence at freeway exit ramps and that they occur in such large numbers, that the number of accidents in the vicinity of the exit ramp is four times greater than at any
1 ft = 0.305 m
1 mi/h = 1.61 km/h
Figure 4. Left-turn lane offset design values to achieve required sight distances using the modified AASHTO model (J=2.5 s) and unrestricted sight distances.
other freeway location. Two decades later, Lunenfeld (1993) reiterated that most freeway accidents and directional uncertainty occurs in the vicinity of interchanges.
Distinct patterns in the occurrence of freeway interchange accidents emerge in studies that look specifically at driver age. In a statewide (Michigan) accident analysis by Staplin and Lyles (1991), an induced-exposure-based examination of the accident involvement ratios and violation types of drivers ages 75 and older, ages 56 to 75, ages 27 to 55, and age 26 and under, showed that drivers over age 75 were overrepresented as the driver at fault in merging and weaving accidents near interchange ramps. With respect to violation type, the older driver groups were convicted most frequently for failing to yield, and improper use of lanes. Similarly, Harkey, Huang, and Zegeer's (1995) study of the pre-crash maneuvers and contributing factors in older driver freeway accidents indicated that they were cited most often with failure-to-yield as a contributing factor. These data raise concerns about the use of freeway interchanges by older drivers, in light of evidence presented by Lerner and Ratte (1991) that a dramatic growth in older-driver freeway travel occurred between 1977 and 1988, and with this trend expected to continue into the future.
The exit gore area is a transitional area that requires a major change in tracking. A driver (especially in an unfamiliar location) must process a large amount of directional information during a short period of time and at high speeds while maintaining or modifying his/her position within the traffic stream. When drivers must perform guidance and navigation tasks in close proximity, the chances increase that a driver will become overloaded and commit errors (Lunenfeld, 1993). Erratic maneuvers resulting from driver indecisiveness in such situations include encroaching on the gore area, and even backing up on the ramp or the through lane. When weaving actions are required, the information processing task demands for freeway interchange maneuvers—both entry and exit—are further magnified.
Studies dating back to the 1960's have addressed the effects of ramp design on driving performance; however, Koepke (1993) reports that the basic design criteria, and therefore design standards, used by governmental agencies to design exit and entrance ramp terminals have not changed in more than 30 years. Recommendations for selected design features on ramps at interchanges may be justified both in terms of the changing characteristics of the driving population, and by the operating characteristics of the highway system. Age-related functional decreases in visual acuity, motion judgement and information processing capabilities cause increased difficulty for older drivers entering and exiting highways, at the same time traffic density has increased dramatically, resulting in more complex decision-making and divided attention requirements at these sites. In a survey of 664 drivers age 65 and above, half of those surveyed (49 percent) reported that the length of freeway entry lanes was a highway feature that was more important to them now compared to 10 years ago (Benekohal, Resende, Shim, Michaels, and Weeks, 1992).
A review of accident rates and ramp characteristics produced only limited findings. Lundy (1967) found that off-ramp accident rates were consistently higher than on-ramp accident rates. However, Oppenlander and Dawson (1970) reported that at urban interchanges, 68 percent of the interchange ramp accidents occur at entrance ramps while 32 percent occur at exit ramps; for rural interchanges, these percentages were reversed. Similarly, Mullins and Keese (1961) reported that in urban areas, 82 percent of the interchange accidents occur at on-ramps and 18 percent at exit-ramps. Further, Lundy's (1967) study of 722 freeway ramps in California found that the accident rate is reduced for off-ramps when deceleration ramps are at least 274 m (900 ft) long (not including the length of the taper), for on-ramps when acceleration lanes are at least 244 m (800 ft) long, and for weaving sections that are at least 244 m (800 ft) long. Oppenlander and Dawson (1970) also concluded that safety is improved for on-ramps, off-ramps and weaving areas 244 m (800 ft) in length or greater. Other researchers who found that the accident rate at off-ramps is reduced as the length of the deceleration lane is increased include Mullins and Keese (1961) and Fisher (1961). Cirillo (1970) found that increasing the length of weaving areas will reduce accident rates, and increasing the length of acceleration lanes will reduce accident rates if the percentage of merging vehicles is greater that 6 percent of the mainline volume. Reduced accident rates from lengthening of deceleration lanes also appears to be related to the percentage of diverging traffic, with significant safety benefits beginning when 6 percent of the mainline traffic diverges (Cirillo, 1970).
More recently, Leisch (1993) stated that where interchanges are closely spaced and an auxiliary lane must be introduced at an entrance, the added lane should be carried to the exit of the following interchange or an added lane required for an exit should be extended back to the entrance of the previous interchange. With a particular focus on weaving sections, Leisch notes that an entrance followed by an exit requires the use of added width and certain minimum length (entrance to exit) to comply with capacity requirements. According to Leisch, an effective length of auxiliary lane on a full freeway should be at least 610 m (2,000 ft)—and preferably more—and should in no case be less than 457 m (1,500 ft). Since an auxiliary lane has the potential to trap a driver at its termination point, Leisch (1993) emphasizes the need for special pavement markings to be applied (as opposed to normal lane markings), in addition to overhead signing, to give both exiting and entering drivers a visual indication for positive guidance.
Although not specifically addressing the needs of older drivers, the most comprehensive work to develop guidelines for freeway speed change lanes was conducted in NCHRP Project 3-35 by Reilly, Pfefer, Michaels, Polus, and Schoen (1989), who collected data on the entry and exit processes by videotaping 35 sites in three states. An entrance model was developed, based on gap acceptance and acceleration characteristics of drivers as determined by the controlling geometry. An exit model was developed, based on the driver's behavioral response to design geometrics. The purpose of the research was to develop new criteria that would offer greater flexibility than the (then) current AASHTO (1984) guidelines, which "do not provide the designer with the ability to reflect important geometric and traffic conditions." In this research, it was reported that the AASHTO (1984) speed-change lane design criteria were based on the acceleration and deceleration characteristics of early model vehicles, with little regard to traffic flow characteristics or driver behavior. The design values produced by the NCHRP project entry model for speed-change lane length were slightly lower at low freeway speeds and significantly higher at moderate to high freeway speeds when compared to the 1984 AASHTO values. The exit model values for length were significantly higher than 1984 AASHTO values for all freeway and ramp speeds. The findings of the study suggest that for certain traffic conditions, the current speed-change lane design criteria do not provide sufficient length for proper execution of the merge or diverge process. This is of particular importance with regard to the age-related diminished capabilities of older drivers.
Beginning with a consideration of acceleration lanes and entrance ramps, Michaels and Fazio (1989) reported on the model of freeway merging developed during the conduct of NCHRP Project 3-35, to define the length of a speed change lane (SCL). In this model, the merge process is composed of four sequential decision components, to which a fifth component is added: (1) a steering control zone (SC), which involves the steering and positioning of the vehicle along a path by steering from the controlling ramp curvature onto the speed-change lane, (2) an initial acceleration zone (IA), in which the driver accelerates to reduce the speed differential between the ramp vehicle and the freeway vehicles to an acceptable level for completing the merge process, (3) a gap search and acceptance zone (GSA) during which the driver searches, evaluates, and accepts or rejects the available lags or gaps in the traffic stream, (4) a merge steering control zone (MSC) during which the driver enters the freeway and positions the vehicle in Lane 1 (although this zone is not considered a determinant of the speed-change lane length), and (5) a visual clear zone (VC) which provides a buffer between the driver and the end of the acceleration lane, where the driver can either merge onto the freeway in a forced maneuver or abort the merge and begin to decelerate at a reasonable rate. Associated with each of these components is a length; the total speed change lane length is the sum of the SC, IA, GSA, and VC components. The entry process is diagrammed in figure 5.
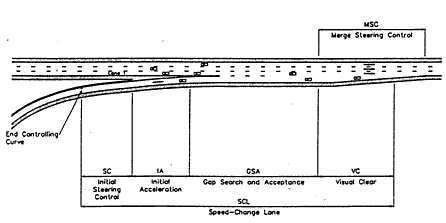
Figure 5. The entry process and components of the entry model developed in NCHRP 3-35.
Design values for entrance ramp acceleration lane lengths were developed as a part of NCHRP Project 3-35 based on driver behavior and traffic flow characteristics obtained from field studies and known human factors. The model assumes that a driver will adopt a significant non-zero, speed differential at the beginning of the GSA so as to facilitate entry into the traffic stream. In this model, it is recommended that a value of 16.09 km/h (10 mi/h) be used for that speed differential. In this research, it was found that it is not only the speed differential between the ramp and freeway vehicles, but also the position of the vehicles relative to each other and the availability of a suitable gap in the freeway traffic, which determines when the merge will occur. The time for the steering control zone (SC) is considered to be a constant, which is approximately 1 to 1.5 times the entry velocity, as it was estimated that a 1-s steering transition from ramp to acceleration lane would be sufficient. Therefore, at an entry speed of 15 m/s (50 ft/s), a maximum of 23 m (75 ft) should provide for the entry steering maneuver. The length of the acceleration segment (IA) depends on the magnitude of acceleration that is acceptable to the driver. If the driver accelerates at 1.5 m/s (4.8 ft/s) for only 2 s, he/she will have traveled 33.5 m (110 ft), which, when added to the steering control distance, means that the driver will have a clear view of oncoming traffic for a minimum of 49 to 56 m (160 to 185 ft). The appropriateness of these model assumptions for older drivers was not addressed in the NCHRP project, however.
As emphasized in NCHRP 3-35, the GSA zone is a key component of the entry model; this is especially true for older drivers. This length includes the distance required to search for and accept a headway, and is determined by the distribution of headways in Lane 1 of the freeway, the gap acceptance characteristics of the driver of the ramp vehicle, the design vehicle (car or truck) and the volume on the ramp. The angular velocity threshold—a critical variable because of its impact on GSA length and overall acceleration lane length—is set at 0.002 rad/s in the entry model. This value is based on field measurements and ensures that 85 percent of observed drivers in model validation studies (age not reported) will accept a gap producing an angular velocity of equal or greater value. The GSA length requires the use of 16 equations, which are documented in the NCHRP 3-35 report. There are a number of problems in applying these formulations using an older design driver, however. While it has been reported that drivers accept shorter gaps in freeway traffic than assumed by the model (Koepke, 1993), critical gap size for this as for other maneuvers increases significantly with increasing driver age. In addition, whereas Michaels and Fazio (1989) cite observed behavior whereby drivers judge gaps in sequence, increasing the probability of finding one acceptable by accelerating between successive searches, there is ample anecdotal evidence of older drivers slowing and often stopping in acceleration lanes when their initial search does not reveal an acceptable gap to merge with traffic on the mainline (TRB, 1988). Finally, noting the increased reliance on mirror information for gap judgments in this situation by (older) persons with reduced neck/torso mobility, exaggerated maneuver decision latencies for mirror-based lane change judgments in a study conducted by Staplin, Lococo, Sim, and Gish (1996) bear on GSA zone (and therefore, acceleration lane) length requirements.
The visual clear zone length is determined by the angular velocity of the target pavement area at the end of the ramp taper. It must provide the driver with sufficient distance to implement a forced merge or decelerate to a stop, to avoid running off the acceleration lane if they have not found an acceptable gap. In the model, if a driver on the acceleration lane is traveling at a speed of 21 to 24 m/s (70 to 80 ft/s), then as he/she approaches to within 61 to 76 m (200 to 250 ft) of the end of the lane or when the taper produces a lane width of less than 3 m (10 ft), the driver will begin to decelerate. Clearly, the delineation of the pavement width transition at the ramp terminus must be highly conspicuous, to accommodate older driver diminished visual capabilities.
Another issue addressed by NCHRP 3-35 was acceleration lane geometry. Koepke (1993) reported that 34 of the 45 States responding to a survey conducted as a part of NCHRP Project 3-35 on speed change lanes use a parallel design for entrance ramps. Thirty of the agencies interviewed use a taper design for exit ramps, and a parallel design for entrance ramps. The parallel design requires a reverse-curve maneuver when merging or diverging, but provides the driver with the ability to obtain a full view of following traffic using the side and rear-view mirrors (Koepke, 1993). Although the taper design reduces the amount of driver steering control and fits the direct path preferred by most drivers on exit ramps, the taper design used on entrance ramps requires the driver to multi-task between accelerating, searching for an acceptable gap, and steering along the lane. Reilly, Pfefer, Michaels, Polus, and Schoen (1989) point out that the taper design for entrance lanes poses an inherent difficulty for the driver, and is associated with more frequent forced merges than the parallel design. Forced merges were defined as any merge that resulted in the braking of lagging vehicles in Lane 1, or relatively quick lane changes by lagging vehicles from Lane 1 to a lane to the left. The parallel design would thus appear to offer strong advantages in the accommodation of older driver diminished capabilities.
Turning to a consideration of deceleration lanes and exit ramps, Livneh, Polus, and Factor (1988) reported that studies analyzing traffic behavior on deceleration lanes have been few in number. They summarized Fukutome and Moskowitz's (1963) efforts to determine whether the length of the ramp tangent approaching the ramp curve had any effect on ramp speed. Fukutome and Moskowitz (1963) found that the length of the deceleration lane from the end of the taper should be at least 137 m (450 ft) when the ramp curve has a radius of 122 m (400 ft), and noted that shorter distances resulted in significantly lower speeds at the nose, which were reflected backward, causing interference to through traffic on the freeway. The results suggested that the shorter distances resulted in unnaturally high rates of deceleration, primarily affecting unfamiliar drivers who are more likely to have adjustment problems when unusual deceleration rates are applied. Fukutome and Moskowitz (1963) found that drivers prefer some moderate deceleration rate as opposed to an extremely low one afforded by a lengthy distance in which to accomplish the speed change. The design should allow the vehicle to enter the deceleration lane at a speed comparable to the through flow speed and decelerate in the deceleration area to the velocity required to negotiate the exit ramp properly.
As in the case of acceleration lanes, the speed change maneuver on deceleration lanes was segmented into components in NCHRP 3-35 (Reilly et al., 1989). These include: (1) the diverge steering zone, LDS, which is the distance upstream from the exit gore at which a driver begins to diverge from the freeway; (2) the steering control zone, LSC, in which the driver steers and positions a vehicle from the freeway lane onto the deceleration lane; (3) the deceleration in gear zone, LDG, in which the vehicle decelerates prior to braking; and (4) the deceleration while braking zone, LDB, in which braking occurs in order to reach a reduced speed dictated by the geometrics, terminus, or traffic conditions on the off-ramp. The total deceleration lane length, LSCL, is equal to LSC+ LDG+LDB. Figure 6 diagrams the exit process defined in the NCHRP research. The lengths of the four zones in the exit process were combined into two design elements: the LSCL, which is the total length required to complete the exit process, and the LDS, which defines the distance upstream from the nose of the exit wedge at which the beginning of the deceleration lane must be placed. Depending on the location of the speed controlling point on the ramp, the driver will decelerate in-gear until the driver's angular velocity threshold has been reached and braking must occur. Therefore the total deceleration of the vehicle is a combined process between in-gear and braking. The length of the LDG zone is the most sensitive to variations in diverge speeds; the LSC and LDB zones vary little with diverge speed. The design criteria for deceleration lanes are presented in NCHRP 3-35 Speed-Change Lanes User Design Guidelines, and can be used to determine the required lengths for a new design, test the appropriateness of an existing design, or be used to retrofit older designs that are not used by designers today.
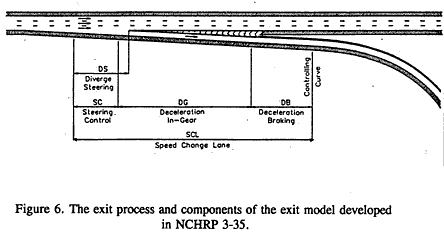
Figure 6. The exit process and components of the exit model developed in NCHRP 3-35.
A comparison of the values generated by the NCHRP exit model and current AASHTO values was presented by Reilly et al. (1989). For most freeway and ramp speeds, the model deceleration lane lengths are longer than the AASHTO values. The difference between the exit model and AASHTO values increases with increasing ramp speed.
The NCHRP model was validated using data observed at 12 sites. An assumption in the development of the exit model was that the speed of an exiting vehicle during the diverge steering maneuver was constant, and therefore the speed of the vehicle during the diverge equals the freeway speed. Data collected at 12 exiting sites during this study confirmed that the reduction in speed was normally less than 3.2 km/h (2 mi/h), regardless of the initial speed. However, it was found that a significant percentage of drivers reduce their speed while still on the freeway, prior to the diverge maneuver, with the average speed of 83.7 km/h (52 mi/h) across all sites prior to the diverge maneuver. Next, a critical element in the exit model is the threshold angular velocity that determines LDS and LDB. As a driver approaches an exit, he/she first recognizes the taper diverging from the freeway lane, which is essentially a widening of the overall roadway. This recognition is determined mainly by the change in the driver's visual angle subtended by the roadway; however, other elements such as edge markings and signing will generate a component of angular velocity. In addition, the angular velocity will reach threshold at greater distances for a curved ramp than for a simple diverging ramp, resulting in the use of more deceleration lane length in cloverleaf type interchanges than for diamond type.
Complementing the findings in NCHRP 3-35, Livneh et al. (1988) observed traffic using freeway deceleration lanes at two freeway sites to record actual behavior and compare it to current design practice. They concluded that a considerable difference exists between the AASHTO assumptions and actual driver behavior along deceleration lanes. The principal discrepancies were in average speeds and in rate and duration of deceleration in gear and while braking. The speed of both cars and heavy vehicles at the beginning of the deceleration lane was always lower than the average speed of through vehicles. The deceleration values obtained were lower than the values recommended by AASHTO. On properly designed long lanes, the duration and length of deceleration in gear were longer than 3 s, as assumed by AASHTO, and deceleration in gear took place for an average of 10 s until the speeds of vehicles slowed from about 85 percent of their average running speed on the through lane—the initial speed at the beginning of the taper—to an average of 67 percent. From this point, which was 200 m (650 ft) from the beginning of the deceleration lane, braking started and continued until speeds were further reduced to meet the average running speed required to negotiate safely the ramp curve that followed.
It is at this point that older driver needs deserve special consideration. The point of controlling curvature on an exit ramp, as well as the curve speed advisory, must be highly conspicuous to create an appropriate expectancy of the required vehicle control actions. With this expectancy, older drivers should be able to negotiate deceleration lane geometries meeting AASHTO or NCHRP guidelines competently (also assuming effective gore delineation). Raised curve delineation treatments may be recommended in this regard; post-mounted delineators or chevrons could be particularly effective. In addition, Holzmann and Marek (1993) note that ramp operations may be improved by moving the relatively sharp ramp curvature away from the ramp terminal.
Addressing another aspect of ramp geometry, researchers have determined that the long direct-taper deceleration lane is operationally superior to the parallel-type, as it provides a straight travel path maneuver preferred by drivers (Jouzy and Michael, 1963). In a survey of practice of State DOT’s conducted during NCHRP Project 3-35, 41 of the 45 States surveyed prefer the taper design for exit ramps over the parallel design (Koepke, 1993). An early study by the University of Toronto (1968) showed that 95 percent of all exiting drivers tend to drive directly for the ramp proper, even if the ramp terminal is designed as a parallel ramp. This study concluded that a tapered exit ramp fits vehicle paths better than the parallel type and that the lengths recommended by AASHTO for deceleration are sufficient to obtain the necessary speed reduction. In the NCHRP 3-35 survey, nearly all agencies reported use of deceleration lane lengths that equal or exceed AASHTO recommendations.
Finally, a recent review of interchange design issues, necessitated by changes in road user characteristics and current research, approaches ramp geometrics as a three-dimensional system (Keller, 1993). According to this review, the factors that influence ramp alignment and superelevation design include design consistency and simplicity, the roadway user, design speed, and (stopping and decision) sight distance. Because driver reaction time is slowed when elements of ramp geometry are different than expected, design should provide for long sight distances, careful coordination between horizontal and vertical alignment, generous curve radii, and smooth coordinated transitions, particularly when complex interchange designs are unavoidable. Increasing the sight distance and simplifying interchange layout can reduce some of the effects of decreasing visual acuity, short term memory decline, reduced decision-making ability, reduced ability to judge vehicle speed, decreased muscle flexibility and pain associated with arthritis, and early fatigue and slower reaction times associated with increasing driver age. With regard to design speed, Keller (1993) states that the ramp proper should be viewed as a transition area with a design speed equal to the speed of the higher-speed terminal wherever feasible, and that few diagonal or loop ramps are long enough to accommodate more than two design speeds. Thus, the terminals and the ramp proper should be evaluated to determine the appropriate speed for design.
In terms of stopping sight distance requirements, it was noted by Keller (1993) that designers can reduce drivers' stress at interchanges by providing sight distances greater than the minimum stopping sight distances. Although a brake reaction time of 2.5 s is representative of 90 percent of the drivers used in a 1971 study by Johansson and Rumar, and is used in the AASHTO stopping sight distance formula, it has been suggested that a 3.5 s perception and braking time should be used to accommodate the elderly with diminished visual, cognitive, and psychomotor capabilities (Gordon, McGee, and Hooper, 1984). Another assumption in the AASHTO calculations for stopping sight distance is a driver eye height of 1.06 m (3.5 ft); the eye height of older drivers is often less. Finally, alignment affects braking distance, such that curves impose greater demands on tire friction than tangents, resulting in increased braking distance when the friction requirements of curves and braking are combined (Glennon, Neuman, and Leisch, 1985).
Keller (1993) notes that locations where stopping sight distance values do not provide the time necessary to process information and react properly, highlight the importance of the use of decision sight distance. Examples of locations at interchange ramps where decision sight distance is desirable include the following: ramp terminals at the main road, especially at an exit terminal beyond the grade separation and at left exits; ramp terminals at the cross road; lane drops; and abrupt or unusual alignment changes. AASHTO (1994) notes that sight distance along a ramp should be at least as great as the safe stopping distance. The sight distance on a freeway preceding the approach nose of an exit ramp should exceed the minimum stopping distance for the through traffic speed, desirably by 25 percent or more, although the desirable goal remains decision sight distance (DSD).
Decision sight distance values—which include detection, recognition, decision, and response initiation and maneuver times—are provided in AASHTO (1994) table III-3 by design speed and type of avoidance maneuver required. Lerner et al. (1995) measured DSD for three driver age groups (ages 20 to 40, 65 to 69, and 70 and older) at six freeway lane drop locations. While PRT values measured by Lerner et al. (1995) were actually somewhat lower than the values assumed by AASHTO, they nevertheless found that the 85th percentile total time required by each age group for detection, decision and maneuvering exceeded the recommended AASHTO value of 14.5 s. The freeway total times averaged 16.5 s, 17.6 s and 18.8 s, for the younger, the young-old, and the old-old groups, respectively. The researchers explain that the original AASHTO work assumed free-flow traffic conditions, in which drivers were not required to wait for a gap in traffic to change lanes. The Lerner et al. (1995) study, by comparison, was conducted on heavily traveled urban freeways and subjects often had to wait for gaps in traffic before maneuvering. This led to significantly higher maneuver times than were assumed by AASHTO. No modifications to the existing DSD standards were deemed necessary. Keller (1993) reported that of the State design agencies responding to a 1991 survey about distances used when locating ramp exits beyond a crest vertical curve, 15 (38 percent) use the safe stopping sight distance, 9 (23 percent) use the safe stopping sight distance plus 25 percent, and 12 (31 percent) use decision sight distance.
Lane Width
Research studies have generally shown that an adequate pavement width is necessary for safe driving operation. Inadequate pavement widths can seriously impair highway safety. Choueiri and Lamm, (1987) reported the results of several early studies that showed a relationship between pavement width and accident rate. He reported several (pre-1970) studies that found a correlation between decreasing accident rates and increasing pavement widths.
Studies from the last 20 years have also shown similar correlations. Nilsson (1975) reported that for straight alignments with grades less than 1.5, the accident rate decreased by half, when pavement width was increased from 6.1 m (20 ft) to 13.1 m (43 ft). Kunze (1976) also found a relationship between decreasing accident rates with increasing pavement widths for all accidents, run-off-the-road-accidents, accidents at intersections, and head-on/rear-end accidents. Krebs and Kloeckner (1977) reported that for every 1 m (3.3 ft) increase in pavement width, a decrease of 0.25 in the accident rate (per million vehicle kilometers) could be expected. Zegeer, Hummer, Herf, Reinfurt, and Hunter (1987) showed that for two-lane rural roadways, lane widening of 0.3 m (1 ft)—e.g., widening a 3-m (10-ft) lane to 3.3 m (11 ft)—can be expected to reduce accidents such as run-off-the-road, head-on, and opposite- and same-direction sideswipes by 12 percent, and that 1.2 m (4 ft) of widening—e.g. from 2.4 m to 3.6 m (8 ft to 12 ft) will result in a 40 percent reduction in these accident types. Rumar (1985) also reported on before/after comparisons of accident risks, showing that accident ratios decrease with increasing pavement width, as depicted in figure 7.
Shoulders
The shoulder is that part of the roadway geometry immediately contiguous to the traveled way. Shoulders are important features of all roadways. They serve a wide range of functions. From a human factors standpoint, these functions include: recovery of temporary loss of control, or provision of room to perform emergency evasive action; provision for sufficient horizontal sight distance; maximization of traffic flow, and thereby capacity; and, serve as a primary clear area of obstruction.
Zegeer, Deen, and Mayes (1981) reviewed studies focusing on shoulder width and safety. They reported considerable variation in findings concerning correlations of shoulder width with accident occurrence. Some of these studies reported decreased accident rates with increased shoulder widths for specific AADT rates only (e.g., between 3,600-5,500 and 2,600-4,500). Others have found a definite benefit from wide shoulders. Zegeer et al. (1981) cited studies that showed twice as many injury accidents on roads with shoulder widths of 0.3 m to 0.9 m (1 to 3 ft) compared to road with shoulders of 1.8 m (6 ft). Other studies reported reductions in accidents with increased shoulder widths, especially in the 2,000 to 6,000 AADT range. Another study concluded that shoulders between 1.2 m and
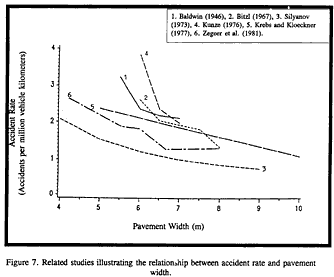
Figure 7. Related studies illustrating the relationship between accident rate and pavement width.
1.5 m (4 and 5 ft) wide were adequate on roads with good alignment, but shoulders more than 2.4 m (8 ft) were preferred on roads with poor geometrics. It was also reported that there is a lack of correlation with accidents on two-lane roads where AADT’s are less than 2,000. Wide shoulders appear to be most beneficial where ADT’s are between 3,000 and 5,000. Zegeer et al. (1981) reported on data collected on more than 24,135 km (15,000 mi) of roads. They found that wide shoulders (up to 2.7 m [9 ft]) were associated with lower accident rates. Cirillo and Council (1986) reported that most studies agree that shoulders up to 1.8 m (6 ft) wide on facilities with greater than 1,000 ADT provide a safety benefit. The effect beyond 1.8 m (6 ft) is unclear. No studies specifically relating older driver performance to shoulder width were identified.
Other Features
Other features that deserve mention when referring to highway geometry issues include roadside barriers, guide rails, attenuation devices, barriers, obstacles, and railroad crossings.
Hall, Burton, Coppage, and Dickinson (1976) examined the nature of single vehicle accidents involving fixed objects along the roadside of non-freeway facilities. They found that the majority of these types of accidents were reported as non-intersection related, occurring most frequently on weekends, at night, under adverse pavement and weather conditions, and on horizontal curvature (especially outside of curve). These accident types have high accident severity to drivers and passengers. Wright and Robertson (1979) reported that 40 and 31 percent of all fatal crashes in Pennsylvania and Maryland, respectively, resulted in a vehicle hitting a fixed object such as a tree, utility pole, or bridge abutment. They also conducted a study focused on 600 accident sites (and 600 comparison sites) involving fixed objects. They found that fixed object crashes are more likely to occur: (1) along arterial and collector roads, rather than along local roads; (2) on the right side of roadways than on the left side from the driver's perspective; (3) on curved sections, rather than along straight sections; (4) on the outside of curves, rather than on the inside; (5) in the area downstream from a curve, rather than in the area upstream; (6) on roadways with negative gradient, rather than those with positive gradient; and (7) on roadways with narrow pavements and shoulders. In addition, they found that approximately 90 percent of fixed object crashes result from collisions with objects within 9 m (30 ft) of the pavement edge. For the general population of fixed-object accidents, crash locations are best discriminated from comparison locations by a combination of curvature greater than 9 degrees and downhill gradient steeper than 3 percent. For the fatal fixed-object crash population, the crash locations are best discriminated from comparison locations by a combination of curvature greater than 6 degrees and downhill gradient steeper than 2 percent.
Driver behavior at railroad crossings has also been a concern. Leibowitz (1985) reported that there are over 650 fatalities and 7,000 accidents annually in the United States involving collisions between trains and vehicles. Wigglesworth (1976) found that of the human factors associated with accidents at railway level crossings, the largest number of fatal accidents occurred at open crossings (i.e., crossings protected by a static array of signs and with no automatic device warning of an approaching train), as opposed to those that had gates, booms, and flashing lights. Leibowitz (1985) noted that analysis of accidents reveals that in most cases, there was clear warning of the train's approach and adequate visibility, but for some unexplained reason, the driver of the vehicle chose to cross the track and was killed or seriously injured. Train crews report that motorists will ignore the warning and attempt to beat the train. Motorists generally have a low perceived risk of an accident, especially involving a train, since at many crossings encountering a train occurs very infrequently. Leibowitz (1985) noted that there are approximately 225,000 public grade crossings in North America, of which 50,000 are protected by active devices; the remainder have only a passive crossbuck. His analysis of driver behavior at grade crossings protected by active systems suggested that, for a variety of reasons, drivers ignore the official warnings and decide for themselves whether to attempt to cross. For crossings protected only by crossbucks, the decision to wait or attempt a crossing must be based on the driver's estimate of the safe time interval. Any such reliance on sensory and perceptual capabilities disproportionately penalizes older drivers.
Sonefeld (1980) noted a variety of measures that could be taken to reduce the possibility of collisions between vehicles and trains. The most effective geometric solution is to separate tracks and highways by overpasses or bridges, or construct barriers to prevent vehicle movement. Other treatments include activating lights and bells at grade crossings so that they more accurately indicate the arrival time of a train and have a salutary long-term effect on driver behavior.