
Sessions
Health Status and
Quality of Life Measures
The Sickness Impact Profile
(SIP)
In the Assessment of the Long-Term
Functional Outcome of an Injured
Patient
Charles Mock, M.D., Ph.D.
Evaluation of the effectiveness of trauma care has traditionally focused on mortality rates and length of stay as an indicator of in-hospital morbidity and resource utilization. Acceptably low rates of mortality and morbidity are, of course, the sine qua non of good medical care. However, they give no indication of the long-term functional outcome of patients who survive. As the ultimate goal of medical care is to restore ill or injured patients to their prior functional status, understanding functional outcome and the factors that influence it is important in assessing the effectiveness of medical care. The need for conferences such as this one underscores the complexity of addressing functional status.
In this presentation, the Sickness Impact Profile (SIP) and its potential role as a measure of patient perceived outcome is discussed:
- What is the SIP
- Experience with SIP
- In general
- For trauma
- Examples of use of SIP
- Clinical usefulness
- Research usefulness
- Benefits and Limitations
Review of the SIP
The SIP is a tool that consists of 136 statements, reflecting the breadth of activities of daily living. Patients check those statements that pertain to their status and which are health related. For example: under ‘ambulation’ there are statements such as “I walk by myself, but with difficulty,” “I can only walk with assistance,” “I cannot walk at all.”
Statements are grouped into 12 categories. These categories are grouped into a physical dimension, which includes three categories: ambulation, mobility, and body care and movement. A psychosocial dimension includes four categories: social interaction, alertness behavior, emotional behavior, and communication. There are five independent categories: sleep and rest, eating, work, home management, and recreation.
A sub-score is calculated for each of the categories and an overall SIP score is assigned, by combining all 12 categories. The category scores, the dimension scores (e.g., physical and psychosocial), and the overall SIP score are all on a scale of 0 – 100. Scores of 0 – 3 generally represent little or no disability, 4 – 9 mild disability, 10 – 19 moderate disability, and > 20 severe disability.
Since its development in the 1970’s, over 700 publications have reported its use in over 40 different disease entities. It has been extensively and successfully tested for its reproducibility and internal consistency. Its administration is feasible, taking most patients 20-30 minutes to complete.
Use of SIP in Trauma
The SIP has been most extensively studied in medical conditions. A few studies have used it to evaluate long-term functional status after elective surgical procedures, such as total joint replacement and transplantation. One recent article used the SIP to examine the long-term functional outcome of persons who had been admitted to a surgical intensive care unit (Lipsett et al., 2000; Bergner et al., 1981; Rosemblum et al., 1993).
Thirty studies have now used it to study the outcome of trauma patients. By way of example:
One study each on burns and spinal cord injuries showed the usefulness of the SIP in categorizing patients with different rehabilitation requirements (Siosteen et al., 1990; Questad et al., 1988).
Two studies on head injuries demonstrated the ability of SIP to identify dysfunction across the spectrum of daily activities, up to 4 years post-injury (Temkin et al., 1989; Klonoff et al., 1986).
Several studies have used SIP to look specifically at outcome of patients with extremity fractures. These studies have had the advantage of being able to compare fairly objective measurements such as range of motion and strength with the relatively more subjective SIP measurements (Mock et al., 1997; Jurkovich et al., 1995; Faergemann et al., 1998 ).
Examples from Our Work
Outlined below are a few examples of the findings regarding the use of SIP from work undertaken by Dr. Ellen MacKenzie and investigators from three other centers (Mock et al., 1997; Jurkovich et al., 1995).
This study was carried out at three trauma centers, including the Maryland Institute for Emergency Medical Services, Vanderbilt University, and Harborview Medical Center. The study reviewed the outcome of 444 patients whose main injury consisted of lower extremity fractures. Long-term outcome of these patients, and physical impairment or degree of functioning of the extremity, which took into account range of motion and strength, was evaluated using the SIP.
Some findings from this study that reflect upon the usefulness of the SIP are:
- Frequent responses. The table below shows the most frequently endorsed items at 12 months.
| Item | Percentage |
|---|---|
| Ambulation - Walk more slowly | 40% |
| Ambulation - Walk shorter distances | 34% |
| Emotional Behavior - Rubbing or holding area that hurts | 25% |
| Sleep and Rest - Sleeping less | 25% |
| Work - Not working because of health | 25% |
- Categorization by severity. Half of the patients had no disability and half had some degree of disability: 23% with mild disability, 16% moderate, and 9% severe.
- Twelve individual categories. The mean pre-injury overall SIP score was 2.5, which is comparable to scores obtained in a general, healthy, adult population. At 12 months, the mean overall SIP score had increased to 6.8, indicating a mild level of disability in the patient group on average. Disability was distributed across the activities of daily life, with elevations of all category scores, except for communication and eating. For more detailed information, see Table 1 in Jurkovich et al. (1995).
- The table below shows more details of changes over time. The mean overall and dimensional SIP scores are shown. It can be seen that all outcomes (overall, physical, and psychosocial) were worsened at 6 months, but improved by 12 months, though, by no means back to baseline.
| Pre-injury | 6 months | 12 months | |
|---|---|---|---|
| Overall | 2.5 | 9.5 | 6.8 |
| Physical | 1.3 | 8.2 | 5.5 |
| Psychosocial | 2.5 | 6.8 | 5.5 |
We were also able to look at some correlates of the functional outcome.
- Fracture characteristics. The following fracture characteristics were associated with worsened outcome in the form of higher mean SIP scores at 6 months: Increased number of fracture sites; higher energy fracture pattern, and higher AIS of the extremity. None of these factors was associated with worsened outcome at 12 months.
- Fracture site. There were no major differences in SIP scores among the various sites of fracture in the leg, with the exception of the foot. Somewhat surprisingly, patients with foot fractures had worsened outcome compared to those with other fracture sites.
- Associated injuries. The cohort had been pre-selected to have no major head injuries. Patients with Glasgow Coma Scale of 14 or less at three days were excluded. However, it is notable that patients with even minor head injuries had consistently worsened outcomes compared to other patients.
- Relationship to impairment. The relationship between impairment, as measured by the percent of loss of leg function (based on strength and range of motion compared to the other side); and disability, as indicated by the overall SIP score is outlined. The overall SIP score was correlated with increased impairment, especially in the more severely impaired categories. However, only 23% of the variation in SIP scores among the patients can be explained by or attributed to the differences in the impairment scores. Numerous other factors appeared to influence the relationship between impairment (e.g., physical dysfunction) and SIP scores (e.g. patient perceived functional outcome).
These examples demonstrate the usefulness of the SIP both as a clinical tool and as a research tool. Some of the useful attributes of the SIP are summarized below.
Use as a Clinical Tool
- Sensitive to changes over time
- Able to discriminate between groups
- Able to detect unexpected problems
- Foot fractures
- Minor head injuries
- Psychosocial problems even in patients whose main injuries were lower extremity fractures
- Able to predict groups that might benefit from additional intervention
Use as a Research Tool
The SIP is useful for investigating the relationship between factors influencing the progression of objective physical impairment to subjective, patient perceived disability (Mock et al., 1997).
Obviously other tools could be useful as well. It is helpful to review the benefits and limitations of the SIP from the viewpoint of social science instruments.
Benefits and Disadvantages of SIP for Trauma Outcome Evaluation
Benefits- Reliability and internal consistency have been demonstrated in both low and high severity ranges (Bergner et al., 1981; Bergner et al., 1976).
- Its external validity and clinical applicability have been demonstrated in multiple studies (Bergner et al., 1981; Bergner et al., 1976; DeBruin et al., 1992; Patrick et al., 1989).
- Acceptability and feasibility of administration has also been repeatedly demonstrated (Bergner et al., 1981; Bergner et al., 1976; DeBruin et al., 1992; Patrick et al., 1989; Read et al., 1987). On average, it takes 20-30 minutes to complete. Reliability does not change under different circumstances of administration (e.g., trained interviewer, self-administration).
- It has been used in clinical research and in health care policy analysis.
- It is the research tool that has been most widely used to compare the functional status of patients with different disease entities (Patrick et al., 1989).
- Retrospective administration has been validated.
- Multi-dimensional perspective; it assesses physical as well as cognitive, social, and emotional functioning in the performance of many activities of daily life (Bergner et al., 1981; Bergner et al., 1976; DeBruin et al., 1992; Patrick et al., 1989; McDowell and Newell, 1987).
Disadvantages
- The SIP has not been tested for test-retest reliability or internal consistency in trauma patients. However, the SIP was pilot tested and then utilized and evaluated in numerous groups of patients with varying medical conditions. It has also been translated and evaluated in several European nations. Its reliability and reproducibility are consistent in all of these circumstances (Bergner et al., 1981; Bergner et al., 1976; DeBruin et al., 1992; Patrick et al., 1989). Although trauma patients may differ from other patient groups in characteristics such as age and behavior patterns, there is no a priori reason to suspect that the reliability of their responses to the SIP questions would be markedly different from that of the numerous groups on whom the SIP has already been tested.
- Most of the work on SIP has thus far come from specific types of injuries: e.g. burns, spinal cord, head injuries, extremity fractures. Hence, the ability to generalize the findings from these studies to the functional outcome of all trauma patients, especially those with multi-system injuries, is unknown. There has thus far been only one study looking at the use of the SIP in a general group of trauma patients (Richmond et al., 1998).
- Time of administration: longer than most other measures that might be considered (e.g., FIM, SF-36).
Comparisons of SIP to Other Measures
Corrigan et al used several measures to evaluate the outcome of head injured patients. The Functional Independence Measure (FIM) was found to be superior to the SIP and the Medical Outcome Study Short-Form Health Survey (SF–36) in predicting the need for minutes of assistance and need for supervision (Corrigan et al., 1997).
In our own study, we did not compare measures; in one of the papers, we delineated why we chose the SIP over other measures (Jurkovich et al., 1995). In particular for the patients with isolated extremity fractures, we felt that the SIP:
- Goes beyond the traditional measures of self-maintenance and mobility to include social function, recreation, and role function (including work and household management).
- Is more sensitive to less severe outcomes that are typical after a fracture to the lower extremity. The FIM has been shown to be useful in evaluating changes in function after a severe injury to the head or spinal cord because it focuses on the level of independence achieved in self-care, bladder and bowel management, locomotion, and mobility. At 1 year post-injury, only 10% of our patients required assistance in one or more of these activities. Yet, many more had difficulty resuming their pre-injury levels of work and recreation.
Conclusions
- The SIP offers the combination of both a broad and an in-depth assessment.
- Multi-dimensional: Combines constructs of physical function, daily activities, and social role.
- Extensive literature on its reliability, consistency, validity, and clinical usefulness.
- Comparability to other disease entities.
- There are probably certain disease specific circumstances where other measures may be more useful or accurate (such those already mentioned with the FIM and head injuries).
- The main disadvantage of the SIP compared to other measures is that of administering time.
References
- Bergner M, Bobbit RA, Kressel S, et al. The Sickness Impact Profile: conceptual formulation and methodology for the development of a health status measure. Int J Health Serv. 1976;6:393-415.
- Bergner M, Bobbitt RA, Carter WB, et al. The SIP: Development and final revision of a health status measure. Med Care. 1981;19:787-805.
- Corrigan JD, Smith-Knapp K, Granger CV. Validity of the functional independence measure for persons with traumatic brain injury. Arch Phys Med Rehabil. 1997; 78:828-834.
- DeBruin AF, DeWitte LP, Stevens F, et al. Sickness Impact Profile: the state of the art of a generic functional status measure. Soc Sci Med. 1992;35:003-1014.
- Faergemann C, Frandsen PA, Rock ND. Residual impairment after lower extremity fracture. J Trauma. 1998;45:123-126.
- Jurkovich GJ, Mock CN, MacKenzie EJ, et al. The Sickness Impact Profile (SIP) as a tool to evaluate functional outcome in trauma patients. J Trauma. 1995; 39:625-631.
- Klonoff PS, Snow WG, Costa LD. Quality of life in patients 2 to 4 years after closed head injury. Neurosurgery. 1986;19:735-43.
- Lipsett PA, Swoboda SM, Dickerson J, et al. Survival and functional outcome after prolonged intensive care unit stay. Ann Surg. 2000;231:262-268.
- McDowell I, Newell C. Measuring Health: A Guide to Rating Scales and Questionnaires. New York: Oxford University Press, 1987;290-295.
- Mock CN, MacKenzie E, Jurkovich GJ, et al. Determinants of disability after lower extremity fracture. In: Proceedings of the 52nd Annual Sessions of the Owen H. Wangensteen Surgical Forum, 1997 Clinical Congress, Chicago, Illinois; October 1997. Chicago, Illinois: American College of Surgeons; 1997;XLVIII;586-588.
- Patrick DL, Erickson P. Health Status and Health Policy: Allocating resources to health care. New York: Oxford University Press; 1993.
- Questad KA, Patterson DR, Boltwood MD, et al. Relating mental health and physical function at discharge to rehabilitation status at three months post-burn. J Burn Care Rehabil. 1988;9:87-89.
- Read JL, Quinn RJ, Hunter MA. Measuring overall health: an evaluation of three important approaches. J Chron Dis. 1987;40:7S.
- Richmond TS, Kauder D, Schwab CW. A prospective study of predictors of disability lths after non-central nervous system trauma. J Trauma. 1998;44:635- 642.
- Rosemblum DS, Rosen ML, Pine ZM, et al. Health status and quality of life following cardiac transplantation. Arch Phys Med Rehabil. 1993;74:490-493.
- Siosteen A, Lundqvist C, Blomstrand C, et al. The quality of life of three functional spinal cord injury subgroups in a Swedish community. Paraplegia. 1990;28:476-488.
- Temkin NR, Dikmen S, Machamer J, et al. General versus disease-specific measures: further work on the Sickness Impact Profile for head injury. Med Care. 1989;27:S44-53.
SF-36 as a Measure of
Consequences
of Injuries
Branko Kopjar, M.D., M.S., Ph.D.
Injury is a sudden event resulting in an acute decline of health. Knowing the type and amount of this decline is important for several reasons. It enables quantification of burden of injury, estimation of effectiveness of treatment modalities and helps in identifying needs for assistance. It may lead to improvements in the provision of health and social services for the injured, and to a more rational allocation of resources for injury prevention.
Evaluating the impact of injury on health is a complex task in part because injuries represent a large number of diagnoses and because patients with the same diagnosis may differ in the severity of their injury. An additional challenge is that the type and amount of impact on health depends on host factors. Moreover, some patients sustain multiple injuries. A model for injury impact on health status is shown in Figure 1.
FIGURE 1
Impact Of Injury On
Health

The figure shows that injury results in a significant impact on health at the moment of injury. Over time, damage to the tissue is repaired and the injured person recovers from the injury. Health status improves. This period is called the short-term impact of injury. The length of this period varies for different injuries and among patients with the same injury. If the health status does not completely regain the pre-injury level, there is a residual impact of injury and permanent loss of health.
Health is a complex state. Injury impacts some, but not necessarily all dimensions of health. Health dimensions could be impacted at different times and with different durations. Therefore, it is more correct to describe impact of injury on a profile of health dimensions, rather then on a single index health dimension. At the same time, that increases complexity and prevents economic calculations of quality-of-life costs of injuries.
Unfortunately, little is known about the profiles of injury impact on health. One particular challenge is how to measure this impact. Unlike other diseases, injuries are a group of conditions and are not suitable for disease-specific measures. A useful measure of decline in health due to injury should provide a common descriptor for various injury diagnoses; it should be responsive to changes in health status over time; and it should be able to describe changes in several health dimensions.
Generic measures of health status and health-related quality of life reflect the dimensions of health conceptualized by the general public. There is a growing interest in the development and application of such measures. Currently, the most commonly used generic measure of health status is the Medical Outcome Study Short-Form 36 health survey (SF-36). The origin of this is the Rand Corporation’s health insurance experiment questionnaire, originally consisting of 108 items. Although the original instrument was valid and sensitive, it was too long for general use. A shorter version, SF-36 questionnaire has appeared to be more useful.
The SF-36 is a self-administered questionnaire consisting of 36 items, requiring 5-10 minutes to complete. The 36 items generate a profile of scores across eight dimensions of health: Physical Functioning (10 questions), Social Functioning (2 questions), Role Limitations-physical problems (4 questions), Role Limitation-emotional problems (3 questions), Mental Health (5 questions), Vitality (4 questions), Pain (2 questions), General Health (5 questions). One question addressing health change (transition) is not scored nor represented in the eight dimensions. Studies have shown that the SF-36 has high internal consistency, good criterion validity, reliability, and is replicable.
There have been several studies that applied the SF-36 to patients with acute injuries. Studies have been conducted for all injuries and for specific types of injuries: brain, spinal cord, fracture, osteoporotic fracture, back injury, carpal tunnel syndrome.
Empirical Study
We have conducted a study using the SF-36 among a general sample of injured patients seeking medical help with the emergency medicine department in Stavanger General Hospital, Norway. The study included 387 patients who responded to a follow-up questionnaire containing the SF-36. The questionnaire was administered 4-6 weeks after the injury. The distribution of patients by nature of injury is shown in Table 1.
| Type of Injury | Number of Patients | Percent of Patients |
|---|---|---|
| Fracture | 97 | 25 |
| Dislocation | 3 | 1 |
| Sprain, strain | 127 | 33 |
| Brain concussion | 13 | 3 |
| Internal injury | 3 | 1 |
| Open wound | 64 | 17 |
| Superficial injury | 5 | 1 |
| Contusion | 29 | 7 |
| Foreign body | 33 | 9 |
| Burn | 7 | 2 |
| Multiple injury | 3 | 1 |
| Other | 3 | 1 |
| Total | 387 | 100 |
The patients were grouped according to activity restriction status into two groups: with and without activity restriction. Figure 2 shows scores on SF-36 dimensions for patients with and without activity restriction 4-6 weeks after the injury.
FIGURE 2
SF-36 Scores
for Patients with and without
Activity Restriction 4-6 Weeks after
Injury
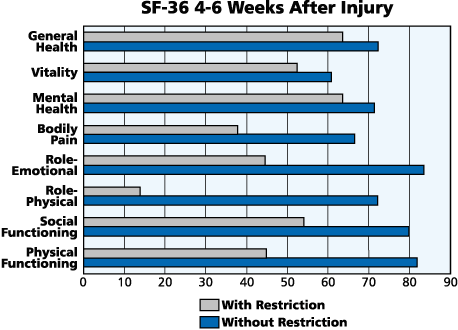
Figure 2 shows that the scores on SF-36 dimensions are lower for those with activity restriction compared with patients without reported activity restrictions. The difference is more pronounced for dimensions describing physical health than dimensions describing mental health.
Patients with activity restriction have been followed to record the dynamic of the changes in their health status. Figure 3 shows the changes at 6 months after the injury, compared with 4-6 weeks after the injury.
FIGURE 3
SF-36 Scores for
Patients with Activity Restriction
6-10 Weeks after Injury and 24-28
Weeks after Injury
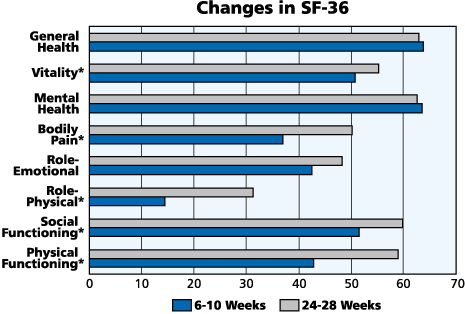
The health status improved for all dimensions describing physical health while the mental health dimensions showed less change. It is important to emphasize that the mental health has been less impacted by the injury.
Conclusion
This and other studies show that the SF-36 appears to be a valid instrument to measure impact of injury on health status. However, some limitations that affect wide application of the SF-36 as an empirical measure of health impact of injuries need to be mentioned. Large numbers of different injuries coupled with large random variations in the health impact of the same injuries, and dependency on host factors pose logistical challenges for mapping the impact of injury by the SF-36. The approach could be to first identify only the injuries that result in residual loss of health and measure the impact of those standardized for the main factors such as age and gender.
Injury Outcome Measures in Childhood:
The Issues and an Appraisal of the
Child Health
Questionnaire
Shanthi N. Ameratunga, M.B. Ch.B., M.P.H.
Child health advocates are wont to remind us “children are not just small adults.” Biological and developmental issues, a greater dependency on others for care and support, and specific sources of vulnerability and resiliency, place children in a relatively unique context with respect to their health and response to injury. Theories and applications of health status measurement however have focused primarily on adults. Relatively little attention has been paid to the development of conceptually sound and reliable measures of child health.
This may reflect a historical apathy in commitment to child health issues, the higher use of healthcare resources by adults, the limited opportunities young people have for autonomy and participation in the healthcare debate, and the perception that children are, in general, healthy. In considering the utility of available instruments to assess outcomes of injury, however, it is also important to recognize specific conceptual and methodological challenges in measuring health in childhood.
Concept of Health
As noted by Szilagyi and Schor (1998), “there is not, nor is there likely to be a single definition of child health that will serve all purposes or be adapted universally.” Most robust measures of health status typically draw on some specified definition of health and a related conceptual model. Very broad definitions of health make it difficult to explore, measure and address the specific components that may be affected by injury while narrow definitions (e.g., focus on physical health or functional limitations alone) exclude critical concepts of health that are relevant for children. Most widely used measures of child health have drawn on broad, all-encompassing conceptual models, although comparative analyses reveal important differences in the underlying concepts (Landgraf and Abetz, 1996).
Concept of Disability
The manifestations of disability in childhood differ from those in adult years in several ways. Problems may manifest not only as restrictions in function and performance, but also as delays in growth and development. Likewise, participation in relation to specific contexts such as school, peer networks, play and recreation, and the heightened significance of the immediate environment (e.g., primary caregivers, interior space) in the context of dependency, add dimensions sometimes overlooked in adult-oriented conceptualizations of disability. These limitations are exemplified in the International Classification of Impairments, Disabilities and Handicaps (ICIDH) published by the World Health Organization (WHO) in 1980 and cited as the basis for some child health measures (Landgraf and Abetz, 1996; Simeonsson et al., 2000). The changes heralded in the revised ICIDH-2 (beta-version) and the incorporation of “participation” in the framework, are welcome advances in these respects.
Developmental Context
Rapid growth, development and changes in function and performance capacity pose particular challenges to defining both health and disability in the first 2 decades of life. “Normative values” in these spheres are effectively “moving targets” across this age spectrum. Furthermore, the achievement of particular levels of function is additive and dependent on what has been attained previously. From a measurement perspective, it is therefore a more complex task to evaluate deviations from a projected developmental trajectory compared with estimating variances from a theoretically stable state (e.g., pre-injury health in adults).
The substantial variability in growth and development of young people at any particular age (particularly in relation to differences in gender and culture) also makes it difficult to differentiate normal from abnormal behaviors and function, and determine meaningful differences in scores (compared with “noise”) in measures of health status.
Social Context
As illustrated in Figure 1, the nature and etiology of many child health “problems”are social in nature. All domains of child health and development (e.g., physical, cognitive, psychological and social) are also more intimately interconnected and overlap with one another than may be expected for adults. For example, problems relating to physical function following injury may impact on social development (e.g., language). By virtue of their dependency on parents or other caregivers, children’s physical, emotional and educational outcomes and behaviors are also typically dependent on experiences within the family. Thus, a child’s inability to attend school may in part be due to physical morbidity but may also reflect caregiver perceptions of the child’s fitness to attend school, ability to arrange childcare and other competing social stressors. Conversely, adverse outcomes in an injured child may have direct and pervasive consequences for his/ her family in terms of social, emotional and financial difficulties.
Perspective of Relevance
Last but not least, in considering appropriate measures and methodologies to assess outcomes of injury in children, it is critical that thoughtful attention be paid to the issue of the most salient respondent. While the answer depends largely on the question of interest, it is evident that the perspectives of children, their parents/ caregivers, clinicians and other potential respondents are not mutually exchangeable sources of information. Pantell and Lewis (1987) noted that while reports from parents and children were highly correlated with respect to aspects of physical function and limitations thereof, there was relatively minimal concordance in responses to more subjective and sensitive items such as family coping strategies and the child’s social functioning. However, most studies of child health outcomes primarily canvass the opinion of parents or caregivers as proxy respondents, even though empiric evidence suggests children as young as 5 years of age can provide reliable and valid information regarding their health experiences (Tyler et al., 1993; Bush and Davidson, 1982). The United Nations Convention on the Rights of the Child among other imperatives challenges us to forge a way forward in developing, implementing and evaluating appropriate methodologies and instruments to engage children as salient rather than silent partners in describing their experiences.
With this background, my brief today is to review the Child Health Questionnaire (CHQ) and its potential utility in assessing outcomes following injury in childhood.
Child Health Questionnaire - Development and Content
The CHQ is a generic health outcome assessment tool for children and their families, developed by Jeanne Landgraf, Linda Abetz and John Ware of the Health Institute of Boston (1996). It is the product of the Child Health Assessment Project initiated in 1990, the mission of which was to “enhance the voice of children and their families in the healthcare arena” (Landgraf, 1999). The specific goal of the project was to develop a tool that could measure physical, emotional and social well-being of children from the parent/ guardian, and where possible, from the child directly. As described in the CHQ User’s Guide (Landgraf and Abetz, 1996), the construction of the instrument was facilitated by a critical review of previous generic pediatric outcomes tools, the formulation of a set of core concepts with respect to child health and the authors’ previous experience in instrument development. The tool was subsequently tested for validity and normed in a representative US sample.
Fourteen health concepts were incorporated into the final instrument. These included: the child or adolescent’s perceived general health and change in health; physical functioning; limitations in school work and activities with peers due to physical problems, emotional problems or behavioral problems; bodily pain or discomfort; general behavior; mental health; self-esteem; emotional and time impact on parent; limitations on family activities and family cohesion. The items are intended to reflect a balance of both positive and negative health states and a 4-week recall period for most items.
The CHQ has been developed for completion by (a) parents of children aged 5 years and older (98, 50 and 28 item versions available); and (b) children aged 10 years and older (87 item version with a shorter version under development). The raw scale scores of the CHQ are converted to a 0-100 scale, with a higher score indicative of more favorable health and well-being. CHQ results are typically presented in one of two ways: (a) a health profile representing the means and distributions for each of the 14 domains computed using a summated ratings procedure; and/ or (b) the distributions of two aggregated summary measures: physical and psychosocial health. These summary profiles may be presented in comparison with scores for the same participants at another point in time (e.g., pre- vs. post-injury, pre- vs. post-intervention), normative scores in the general population, or scores in a relevant “control” population.
Applications of the CHQ
The CHQ has been translated or adapted for use in 16 countries, primarily in North and Central America, Europe and Australia. It has been applied in several clinical settings (hospital and school-based clinics, Health Maintenance Organization, primary care) and noted to be a useful intervention evaluative tool in asthma, epilepsy, cystic fibrosis, juvenile rheumatoid arthritis, cancer, attention deficit hyperactive disorder (ADHD) and renal disease (Landgraf et al., The CHQ User’s Manual, 1996; Landgraf, 1999). Large-scale population-studies using the CHQ have also been undertaken in Australia, Ireland and the United Kingdom (HealthAct, 2000). To date, there have been no published studies or reports documenting the use of the CHQ as a measure of injury outcomes from JM Landgraf on. However, in a conversation with JM Landgraf she noted that several such studies are currently in progress.
Strengths and Advantages
The CHQ has an explicit and well-grounded conceptual framework that has addressed many of the limitations of previous instruments in this field (Landgraf and Abetz, 1996). The multi-dimensional structure provides the foundation for a comprehensive generic health-related quality-of-life outcome measure. A self-report form for young people aged 10 years and older has been developed although its use, in practice, has been less frequent compared with that of the parent form. The instrument is practical and relatively easy to administer in clinic and research settings and there is a short-version (28-items) of the parent report form. Despite its relatively recent launch in the field, translations, adaptations and normative data for representative populations are now available in several countries outside the US.
Limitations
A major weakness of the CHQ is the relatively limited and indirect coverage of the cognitive domain. This is an important consideration with respect to the experience of injury (with or without traumatic brain injury as a main component). The pre-school age group is not covered by the CHQ (although this is understood to be under development) and there is currently no self-report form for children under 10 years of age. The current self-report form for children/ youth is an 87-item instrument. A short version of this is being developed (Landgraf, 1999).
Application of the CHQ to Measure Injury Outcomes in Children
The CHQ appears to be a promising generic tool with core properties relevant for measuring the burden of injury in children. As with other generic health-related quality-of-life measures, however, the CHQ may not have as high a level of discriminant validity as a condition-specific scale (McGrath et al., 1999). Therefore, supplementary items/ tools need consideration for specific contexts. An index of cognitive function (e.g., in the context of school and learning) may need particular attention.
Practical experience in applying the CHQ to measure injury outcomes appears relatively limited and no studies reporting its utility in this context have been published to date. Particular performance characteristics that need review include potential ceiling and floor effects, responsiveness to change, and the validity of the instrument in a broader spectrum of populations defined by socio-economic status, language and culture. The latter appears particularly relevant given the reportedly major but poorly appraised burden of injury in developing countries (World Health Organization, 1996).
Finally, as promising an instrument as the CHQ and others of its kind may be, there remains a major challenge to further explore effective means by which children across the globe can be effectively engaged as spokespersons for their embodied experience of injury and violence.
References
- Bush PJ, Davidson FR. Medicine and drugs: what do children think? Health Educ Q. 1982;9:113-128.
- HealthAct. Available at: http://www.nhtsa.dot.gov/exit.cfm?link=http://www.healthact.com. This site links to the Child Health Questionnaire (CHQ) site. Available at: http://www.nhtsa.dot.gov/exit.cfm?link=. This site provides a bibliography of published work related to the CHQ. Available at: http://www.nhtsa.dot.gov/exit.cfm?link=. Accessed May 1, 2000.
- Landgraf JM, Abetz LN. Measuring health outcomes in pediatric populations: issues in psychometrics and application. In: Spilker B, ed. Quality of Life and Pharmacoeconomics in Clinical Trials. Philadelphia, PA: Lippincott-Raven Publishers; 1996.
- Landgraf JM, Abetz LN, Ware JE. The CHQ User’s Manual. Boston, MA: The Health Institute, New England Medical Center; 1996.
- Landgraf JM. Measuring pediatric outcomes in applied clinical settings: an update about the Child Health Questionnaire (CHQ). Quality Of Life Newsletter. 1999;23:7-8.
- McGrath M, Bukstein DA, Buchner DA, Guzman GL, Landgraf JM, Goss T. Assessment of the relationship between disease severity and general and disease specific health-related quality of life in pediatric asthma patients. Amb Child Health. 1999;5(3):249-260.
- Pantell RH, Lewis CC. Measuring the impact of medical care on children. J Chron Dis. 1987;40(suppl 1):99S-108S.
- Simeonsson RJ, Lollar D, Hollowell J, Adams M. Revision of the International Classification of Impairments, Disabilities and Handicaps. J Clin Epidemiol. 2000;53:113-124.
- Szilagyi PG, Schor EL. The health of children. Health Services Research. 1998;33 (4 Part 2):1001-39.
- Tyler DC, Ahn Tu JD, Chapman CR. Toward validation of pain measurement tools for children: a pilot study. Pain. 1993;52: 301-309.
- World Health Organization. Murray CJL, Lopez AD, eds. The Global Burden of Disease, Volume 1. Geneva, Switzerland: World Health Organization; 1996.
The Functional Independence Measure (FIMSM)
John D. Corrigan, Ph.D..
The Functional Independence Measure (FIM) is probably the most widely used functional assessment scale in the world. It is the centerpiece of the Uniform Data System for Medical Rehabilitation (UDSMR) that is used for program evaluation in over 1,400 facilities in the United States, Canada, Hong Kong, Finland, the United Kingdom, and Australia (Uniform Data System for Medical Rehabilitation, 2000). It is an essential element of the FIM-Function-Related Groups (Stineman, et al., 1994) that will be used in the United States by the Health Care Financing Administration to determine prospective payment of inpatient rehabilitation for Medicare patients. The FIM is also used in long-term care facilities and home health programs.
The FIM was developed to address the lack of a uniform measurement of disability, particularly in the context of evaluating rehabilitation outcomes (Fiedler and Granger, 1996). It describes a person’s functional abilities and limitations in activities required for daily living. The FIM is intended as a measure of disability, not impairment. Items rate what people usually do, not what they are capable of doing. The FIM emerged from a comprehensive developmental process, sponsored by the American Congress of Rehabilitation Medicine and the American Academy of Physical Medicine and Rehabilitation (Granger et al., 1986). A National Task force first convened in 1983 reviewed items from 36 published and unpublished functional assessment scales before agreeing on an instrument (Hamilton et al., 1987). Reliability and validity testing began in 1984 and was supported by a grant from the National Institute on Disability and Rehabilitation Research (NIDRR) in the United States Department of Education.
Structure
The recommended methods of administration are clinician observation or structured interview conducted by a certified rater (there is a training program for certification that includes self-study, videos and practice tests). Both methods provide comparable results (Karamehmetoglu et al., 1997). Structured interviews with persons who have had traumatic brain injuries or their significant others yield equivalent scores (Tepper et al., 1996); though proxy agreement on cognitive functioning may be less reliable than clinician reporting (Segal et al., 1996). Experienced users can complete the scale in 5 to 10 minutes for subjects known to them; the structured phone interview requires 15 to 20 minutes for experienced users evaluating subjects with whom they have no prior knowledge.
The FIM can be used for persons 7 years of age and older. A WeeFIM was developed in 1987 for children age 6 months to 7 years. (The WeeFIM uses the same items and rating scale, but includes benchmarks for ratings that are age-appropriate.) The FIM measures independent performance in self-care, sphincter control, transfers, locomotion, communication, and social cognition (see Table 1). FIM item ratings range from 1 to 7 (see Table 2). A FIM item score of 7 is categorized as “complete independence,” while a score of 1 is “total assistance” (performs less than 25% of task). Scores falling below 6 require another person for supervision or assistance.
A total score is calculated by adding ratings from all 18 items and may range from 18 (lowest) to 126 (highest). Factor analytic (Stineman et al., Arch Phys Med Rehabil, 1996) and Rasch analyses (Heinemann et al., Topics in Stroke Rehabilitation, 1994; Linacre et al., 1994) have suggested that the FIM consists of two underlying constructs – physical function (FIM Motor) and cognitive function (FIM Cognitive). The FIM Motor score is a linear combination of the 13 items representing self-care, sphincter control, mobility and locomotion. The FIM Cognitive score is a linear combination of the 5 items comprising the communication and social cognition domains. Because of attenuation at the extremes of these scales, Rasch transformed FIM Motor and Cognitive scores are recommended for research purposes (Heinemann et al., Topics in Stroke Rehabilitation, 1994).
TABLE 1
Items from the
Functional Independence Measure (FIM)
MOTOR ITEMS
Self-care
- Eating
- Grooming
- Bathing
- Dressing – upper body
- Dressing – lower body
- Toilet
Sphincter Control
- Bladder management
- Bowel management
Transfers
- Bed, chair, wheelchair
- Toilet
- Tub, shower
Locomotion
- Walk, wheelchair
- Stairs
COGNITIVE ITEMS
Communication
- Comprehension
- Expression
Social Cognition
- Social interaction
- Problem solving
- Memory
| Value | Rating | Description |
|---|---|---|
| 7 | Complete independence | No helper, no devices, reasonable time and safety |
| 6 | Modified independence | No helper, uses device, more time, or safety is a concern |
| 5 | Supervision or set-up | Helper for set-up, cueing or supervision only |
| 4 | Minimal assistance | Helper contributes less than 25% of effort required |
| 3 | Moderate assistance | Helper contributes less than 50%, but more than 25% |
| 2 | Maximal assistance | Helper contributes less than 75% but more than 50% |
| 1 | Total assistance | Helper contributes more that 75% of the effort required |
Measurement Properties
Evaluation of the reliability of the FIM has been extensive (Dodds et al., 1993; Hamilton et al., 1994; Chau, et al., 1994; Fricke et al., 1993; Ottenbacher et al., 1994, 1996). The FIM has been found to be highly reliable, which is further improved by rater training. Rasch analysis has supported the internal consistency of the FIM Motor and FIM Cognitive scales (Heinemann et al., Topics in Stroke Rehabilitation, 1994; Linacre et al., 1994).
Content validity can be presumed from the method of development (i.e., international experts selecting items from 36 published and unpublished rating scales). Concurrent validity has been observed in relation to other functional indicators including the Barthal Index (Kidd et al., 1995; Roth, 1995) and the Patient Evaluation Conference System (Fisher et al., 1995). Predictive validity has been demonstrated by the ability to use rehabilitation admission scores to predict intensity of nursing needs, intensity of therapeutic modalities, rehabilitation length of stay, discharge function, and discharge disposition (Heinemann et al., Arch Phys Med Rehabil, 1994, 1997; Heinemann et al., 1995). Construct validity has been supported by the relationship between FIM scores and average daily minutes of direct assistance from another person (Granger, et al., 1990, 1993; Granger et al., 1995; Corrigan et al., 1997). When combined with measures of psychological distress and extent of community participation, the FIM can also contribute to the prediction of general life satisfaction (Granger, et al., 1990, 1993).
Normative data are reported annually for approximately one-quarter million patients receiving acute rehabilitation in facilities participating in the Uniform Data System for Medical Rehabilitation (Fiedler et al., 1998; Fiedler et al., 2000). Separate item and total scores are reported for stroke, orthopedic conditions (including amputations), neurological conditions, traumatic and non-traumatic brain dysfunction, and traumatic and non-traumatic spinal cord dysfunction.
Clinical Utility for Injury Populations
There is considerable evidence for the utility of the FIM for planning treatment, monitoring progress and evaluating programmatic outcomes during rehabilitation (Heinemann et al., Arch Phys Med Rehabil, 1994, 1997; Heinemann et al., 1995; Stineman, et al., Topics in Stroke Rehabilitation, 1994; Stineman, et al., Am J Phys Med Rehabil, 1996). The FIM has applicability to the full range of etiologies of disability, including that caused by trauma-related fractures (Copes, 1996; Czyrny et al., 1998), amputation (Melchiorre et al., 1996; Muecke et al., 1992), spinal cord injury (Hall et al., 1999; Hamilton et al, 1999), and brain injury (Cifu et al., 1996; Hall et al., 1996; Harrison-Felix et al., 1998; Whitlock and Hamilton, 1995).
The only qualifications of the FIM’s utility in rehabilitation arise from possible limitations of sub-scale scores within certain populations. Some studies have suggested that the cognition items are not sensitive enough to detect mild brain injury among spinal cord injured patients (Davidoff et al., 1990; Ditunno et al., 1995). Conversely, the two-factor structure may not be as robust for populations with serious cognitive and physical impairments (e.g., traumatic brain injury, multiple trauma) due to cognitive impairments affecting the performance of physical functions (Smith-Knapp et al., 1995; Stineman et al., Arch Phys Med Rehabil, 1996).
While there is considerably less research on the clinical utility of the FIM with acute hospital injury populations, support has been expressed in relation to both adult and pediatric trauma (DiScala et al., 1992; Emhoff et al., 1991; Hetherington & Earlam, 1994; Hetherington et al., 1995; van der Sluis et al., 1997). Beneficial attributes have included the FIM’s applicability to all patients; reliability; short administration time; ability to monitor progress (including by patients and families); and contribution to treatment planning. Given the concerns expressed by Dillingham, Pezzin & MacKenzie (1998) regarding influences on discharge decision-making, the utility of the FIM as an aid in predicting who will benefit from rehabilitation may be its most salient characteristic (DiScala et al., 1992; Emhoff et al., 1991; Hetherington et al., 1995).
Monitoring Outcomes from Injury
The effectiveness of the FIM for monitoring short- and long-term outcomes of injury is more equivocal than its utility during intervention. A range of outcomes, particularly significant differences associated with discharge disposition, are evident in the first year following injury (Hetherington et al., 1995; van der Sluis et al., 1997). However, studies of longer-term follow-ups for children with multiple traumas (van der Sluis et al., 1997) and persons with open pelvic fractures (Brenneman et al., 1997) have found minimal deviations from maximum scores, perhaps due to a ceiling effect. In contrast, patients with spinal cord injuries, particularly tetraplegia (Daverat et al., 1995), and children with more severe traumatic brain injuries (Massagli et al., 1996) continue to show a range of FIM scores many years following trauma.
These conflicting findings may appear to be due simply to severity of the condition; however even among traumatic brain and spinal cord injury rehabilitation populations, ceiling effects on the FIM are evident at 1 year post-injury (Hall et al., 1996, 1999). Despite apparent ceiling effects, the FIM remains an important predictor of quality of life indicators such as employment and life satisfaction, one year after traumatic brain and spinal cord injuries (Burnham et al., 1996; Daverat et al., 1995; Greenspan et al., 1996; Massagli et al., 1996; Menter et al., 1991; Webb et al., 1995). The apparent contradiction in these findings may in part be due to different underlying factors that comprise quality of life indicators.
References
- Brenneman FD, Katyal D, Boulanger BR, et al. Long-term outcomes in open pelvic fractures. J Trauma. 1997;42:773-777.
- Burnham RS, Warren SA, Saboe LS, Davis LA, Russell GG, Reid DC. Factors predicting employment 1 year after traumatic spine fracture. Spine. 1996;21:1066-1071.
- Chau N, Daler S, Andre JM, Patris A. Inter-rater agreement of two functional independence scales: the Functional Independence Measure (FIM) and a subjective uniform continuous scale. Disability and Rehabilitation. 1994;16(2):63-71.
- Cifu DX, Kreutzer JS, Marwitz JH, Rosenthal M, Englander J, High W. Functional outcomes of older adults with traumatic brain injury: a prospective, multi-center analysis. Arch Phys Med Rehabil. 1996;77:883-888.
- Copes WS, Stark MM, Lawnick MM et al. Linking data from national trauma and rehabilitation registries. J Trauma. 1996;40:428-436.
- Corrigan JD, Smith-Knapp K, Granger CV. Validity of the functional independence measure for persons with traumatic brain injury. Arch Phys Med Rehabil. 1997; 78:828-834.
- Czyrny JJ, Kelley D, Brentjans M. Functional outcomes of patients with multiple limb trauma. Am J Phys Med Rehabil. 1998;77:407-401.
- Daverat P, Petit H, Kemoun G, Dartigues JF, Barat M. The long term outcome in 149 patients with spinal cord injury. Paraplegia. 1995;33:665-668.
- Davidoff GN, Roth EJ, Haughton JS, Ardner MS. Cognitive dysfunction in spinal cord injury patients: sensitivity of the Functional Independence Measure subscales vs neuropsychologic assessment. Arch Phys Med Rehabil. 1990;71:326-329.
- Dillingham, TR, Pezzin LE, MacKenzie EJ. Incidence, acute care, length of stay, and discharge to rehabilitation of traumatic amputee patients: an epidemiologic study. Arch Phys Med Rehabil. 1998;79:279-287.
- DiScala C, Grant CC, Brooke MM, Gans BM. Functional outcome in children with traumatic brain injury: agreement between clinical judgment and the Functional Independence Measure. Arch Phys Med Rehabil. 1992;71:145-148.
- Ditunno JF, Cohen ME, Formal CS, Whiteneck GG. Functional outcomes in spinal cord injury. In: Stover SL, Whiteneck GG and DeLisa J eds. Spinal Cord Injury: Clinical Outcomes from the Model Systems. Gaithersburg, MD: Aspen Publications; 1995.
- Dodds TA, Martin DP, Stolov WC, Deyo RA. A validation of the Functional Independence Measurement and its performance among rehabilitation inpatients. Arch Phys Med Rehabil. 1993;74(5):531-536.
- Emhoff TA, McCarthy M, Cushman M, Garb JL, Valenziano C. Functional scoring of multi-trauma patients: who ends up where? J Trauma. 1991;31:1227-1232.
- Fiedler RC, Granger CV, Post LA. The Uniform Data System for Medical Rehabilitation: report of first admissions for 1998. Am J Phys Med Rehabil. 2000;79:87-92.
- Fiedler RC, Granger CV, Russell CF. The Uniform Data System for Medical Rehabilitation: report of first admissions for 1997. Am J Phys Med Rehabil. 1998;77:440-450.
- Fiedler RC, Granger CV. The Functional Independence Measure: a measurement of disability and medical rehabilitation. In: Chino N, Melvin JL, eds. Functional Evaluation of Stroke Patients. Tokyo: Springer-Verlag; 1996:75-92.
- Fisher WP, Harvey RF, Taylor P, Kilgore KM, Kelly CK. Rehabits: a common language of functional assessment. Arch Phys Med Rehabil. 1995;76(2):113-122.
- Fricke J, Unsworth C, Worrell D. Reliability of the Functional Independence Measure with occupational therapists. The Australian Occupational Therapy Journal. 1993;40(1):7-15.
- Granger CV, Cotter AC, Hamilton BB, Fiedler RC, Hens MM. Functional assessment scales: a study of persons with multiple sclerosis. Arch Phys Med Rehabil. 1990;71:870-875.
- Granger CV, Cotter AC, Hamilton BB, Fiedler RC. Functional assessment scales: a study of persons after stroke. Arch Phys Med Rehabil. 1993;74:133-138.
- Granger CV, Divan N, Fiedler RC. Functional assessment scales: a study of persons after traumatic brain injury. Am J Phys Med Rehabil. 1995;74:107-113.
- Granger CV, Hamilton BB, Keith RA, Zielezny M, Sherwin FS. Advances in functional assessment for medical rehabilitation. Topics in Geriatric Rehabilitation. 1986;1(3):59-74.
- Greenspan AI, Wrigley JM, Kresnow M, Branche-Dorsey CM, Fine PR. Factors influencing failure to return to work due to traumatic brain injury. Brain Injury. 1996;10(3):207-218.
- Hall KM, Cohen ME, Wright J, Call M, Werner P. Characteristics of the Functional Independence Measure in traumatic spinal cord injury. Arch Phys Med Rehabil. 1999;80:1471-1476.
- Hall KM, Mann N, High WM, Wright J, Kreutzer JS, Wood D. Functional measures after traumatic brain injury: ceiling effects of FIM, FIM+FAM, DRS, and CIQ. Head Trauma Rehabil. 1996;11(5):27-39.
- Hamilton BB, Deutsch A, Russell C, Fiedler RC, Granger CV. Relation of disability costs to function: spinal cord injury. Arch Phys Med Rehabil. 1999;80:385-391.
- Hamilton BB, Granger CV, Sherwin FS, Zielezny M, Tashman JS. Uniform national data system for medical rehabilitation. In: Fuhrer MJ ed. Rehabilitation Outcomes: Analysis and Measurement. Baltimore, MD: Paul H. Brookes Publishing Co.; 1987:137-147.
- Hamilton BB, Laughlin JA, Fiedler RC, Granger CV. Inter-rater agreement of the 7-level Functional Independence Measure (FIM). Scandinavian Journal of Rehabilitation Medicine. 1994;26(3):115-119.
- Harrison-Felix C, Zafonte R, Mann N, Dijkers M, Englander J, Kreutzer J. Brain injury as a result of violence: preliminary finding from the traumatic brain injury model systems. Arch Phys Med Rehabil. 1998; 79:730-737.
- Heinemann AW, Hamilton BB, Linacre JM, Wright BD, Granger CV. Functional status and therapeutic intensity during inpatient rehabilitation. Am J Phys Med Rehabil. 1995;74(4):315-326.
- Heinemann AW, Kirk P, Hastie BA, Semik P, Hamilton BB, Linacre JM, Wright BD, Granger CV. Relationship between disability measures and nursing effort during medical rehabilitation for patients with traumatic brain and spinal cord injuries. Arch Phys Med Rehabil. 1997;78:143-149.
- Heinemann AW, Linacre JM, Wright BD, Hamilton BB, Granger C. Measurement characteristics of the Function Independence Measure. Topics in Stroke Rehabilitation. 1994;1(3):1-15.
- Heinemann AW, Linacre JM, Wright BD, Hamilton BB, Granger CV. Prediction of rehabilitation outcomes with disability measures. Arch Phys Med Rehabil. 1994;75(2): 133-143.
- Hetherington H, Earlam RJ, Kirk CJC. The disability status of injured patients measured by the Functional Independence Measure (FIM) and their use of rehabilitation services. Injury. 1995;26:97-101.
- Hetherington H, Earlam RJ. Rehabilitation after trauma. Injury. 1994;24:527.
- Karamehmetoglu SS, Karacan I, Elbasi N, Demirel G, Koyuncu H, Dosoglu M. The Functional Independence Measure in spinal cord injured patients: comparison of questioning with observational rating. Spinal Cord. 1997;35:22-25.
- Kidd D, Stewart G, Baldry J, Johnson J, Rossiter D, Petruckevitch A, Thompson AJ. The Functional Independence Measure: a comparative validity and reliability study. Disability and Rehabilitation. 1995;17(1):10-14.
- Linacre JM, Heinemann AW, Wright BD, Granger CV, Hamilton BB. The structure and stability of the Functional Independence Measure. Arch Phys Med Rehabil. 1994;75(2):127-132.
- Massagli TL, Michaud LJ, Rivara FP. Association between injury indices and outcome after severe traumatic brain injury in children. Arch Phys Med Rehabil. 1996;77:125-132.
- Melchiorre, PJ, Findley T, Boda W. Functional outcome and co-morbidity indexes in the rehabilitation of the traumatic versus the vascular unilateral lower limb amputee. Am J Phys Med Rehabil. 1996;75:9-14.
- Menter RR, Whiteneck FF, Charlifue SW, Gerhart K, Solnick SJ, Brooks CA, Hughes L. Impairment, disability, handicap and medical expenses of persons aging with spinal cord injury. Paraplegia. 1991;29:613-619.
- Muecke L, Shekar S, Dwyer D, Israel E, Flynn JPG. Functional screening of lower-limb amputees: a role in predicting rehabilitation outcome? Arch Phys Med Rehabil. 1992;73:851-858.
- Ottenbacher KJ, Mann WC, Granger CV, Tomita M, Hurren D, Charvat B. Inter-rate agreement and stability of functional assessment in the community-based elderly. Arch Phys Med Rehabil. 1994;75:1297-1301.
- Ottenbacher KJ, Yungwen H, Granger CV, Fiedler R. The reliability of the Functional Independence Measure: a quantitative review. Arch Phy Med Rehabil. 1996;77(12):1226-32.
- Roth E. Functional assessment in spinal cord injury: a comparison of the Modified Barthel Index and the ‘adapted’ Functional Independence Measure. Clinical Rehabilitation. 1995;4:277-285.
- Segal ME, Gillard M, Schall RR. Telephone and in-person proxy agreement between stroke patients and caregivers for the Functional Independence Measure. Am J Phys Med Rehabil. 1996;75:208-212.
- Smith-Knapp K, Corrigan JD, Arnett JA. Predicting functional independence from neuropsychological tests following traumatic brain injury. Brain Injury. 1996;10:651-661.
- Stineman MG, Hamilton BB, Goin JE, Granger CV, Fiedler RC. Functional gain and length of stay for major rehabilitation impairment categories. Am J Phys Med Rehabil. 1996;75:68-78.
- Stineman MG, Shea JA, Jette A, Tassoni CJ, Ottenbacher KJ, Fiedler R, Granger CV. The Functional Independence Measure: tests of scaling assumptions, structure and reliability across 20 diverse impairment categories. Arch Phys Med Rehabil. 1996;77:1101-1108.
- Stineman MG. Function-based classification for stroke rehabilitation and issues of reimbursement: using patient classification systems to scale payment to patient complexity. Topics in Stoke Rehabilitation. 1994;1(3):40-50.
- Tepper S, Beatty P, DeJong G. Outcomes in traumatic brain injury: self-report versus report of significant others. Brain Injury. 1996;10(8):575-581.
- Uniform Data System for Medical Rehabilitation (UDSmr). The FIM Systemsm. Available at: http://www.nhtsa.dot.gov/exit.cfm?link=http://www.udsmr.org/ Accessed May 7, 2000.
- van der Sluis CK, Kingma J, Eisma WH, ten Duis HJ. Pediatric polytrauma: short-term and long-term outcomes. J Trauma. 1997;43:501-506.
- Webb CR, Wrigley M, Yoels W, Fine PR. Explaining quality of life for persons with traumatic brain injuries 2 years after injury. Arch Phys Med Rehabil. 1995;76:1113-1119.
- Whitlock JA, Hamilton BB. Functional outcome after rehabilitation for severe traumatic brain injury. Arch Phys Med Rehabil. 1995;76:1103-1112.
The Quality of Well-Being
Scale:
Development and Use in Trauma Outcomes Research
Troy L. Holbrook, Ph.D.
The Quality of Well-being Scale (QWB) is an interview-based measure of well-being. The QWB scale combines preference-weighted measures of symptoms and functioning to provide a numerical point-in-time expression of Well-being, which ranges from zero (0) for death to one (1.0) for asymptomatic full functioning (Kaplan et al., 1976 1979, 1982). The QWB scale includes a symptom-scale and three scales of function: Mobility (MOB), Physical Activity (PAC), and Social Activity (SAC). Each symptom and step on these scales has its own associated preference weight. The overall QWB score is based on a preference-weighted average of the previous six-days functioning with respect to symptoms and the three function scales. Thus, a “pre-injury” QWB score may be computed for subjects with an injury-event during the six-day reporting period by using scores from those days recorded before the injury occurred. Individual sub-scale and symptom scores are not routinely reported both because of the preference-weighting and the greater utility and the ability to generalize a summary score. In support of this paradigm, Schwartz et al. have argued that the utility of domain-specific scores may obscure the entirety of the illness experience; “the ‘gestalt’ of the illness experience may be lost by separating its parts from the whole” ( Schwartz et al., 1999). A list of symptom/problem complexes, and sub-scale items along with their associated calculating weights and formulas are shown at the bottom of this discussion.
The QWB is now available in both interviewer-administered and self-administered formats for all ages. The instrument can also be administered by proxy for all age groups when necessary. Translations in Spanish, German, Chinese and other languages are available. Versions of the QWB are available in paper form (hardcopy) and also designed in templates for direct computer entry and scoring using Filemaker.
The overall QWB score, when combined with terms for the number of people involved and time duration, produces the expression Well-Years (or Quality-Adjusted Life-Years). It can thus be utilized to measure the outcome of various health programs and policies with one single evaluative expression, thus allowing comparison of results across diseases and treatments (e.g., chemotherapy for lung cancer vs. Tylenol for headache). The validity of the measure is well established (Kaplan et al., 1978) and both the sensitivity and predictive value independent of the measure have been estimated to be above 0.90 (Anderson et al., 1986, 1988).
The QWB was chosen for the following reasons: (1) the documented sensitivity of the index to the ‘well’ end of the functioning continuum and (2) consensus recommendations by the Agency for Health Research and Quality (now AHRQ, formerly AHCPR) and the National Institutes of Health for the use of quality of life outcome measures with wide ability to generalize in health research. The QWB has been used in a wide variety of medical studies (Kaplan et al., 1984; Kaplan, 1988) and successfully applied in the Trauma Recovery Pilot Project (Holbrook et al., 1994).
Recently, the QWB was adapted and used in a large prospective epidemiological study of functional outcome after major trauma, the Trauma Recovery Project (TRP). Over an enrollment period of two years, nine months, the TRP enrolled 1048 trauma patients triaged to any of four participating San Diego County Trauma Centers. QWB outcome was assessed at discharge, and six, twelve and eighteen months after discharge. Results from the each follow-up time point are available as publications in the Journal of Trauma (Holbrook et al., 1998, 1999).
| Number | CPX Description | Weight |
|---|---|---|
| 1 | Death (not on respondent’s card) | -.727 |
| 2 | Loss of consciousness such as seizure (fits), fainting, or coma (out cold or knocked out) | -.407 |
| 3 | Burn over large areas of face, body, arms, or legs | -.367 |
| 4 | Pain, bleeding, itching, or discharge (drainage) from sexual organs – does not include normal menstrual (monthly) bleeding | -.349 |
| 5 | Trouble learning, remembering, or thinking clearly | -.340 |
| 6 | Any combination of one or more hands, feet, arms, or legs either missing, deformed (crooked), paralyzed (unable to move) or broken – includes wearing artificial limbs or braces | -.333 |
| 7 | Pain, stiffness, weakness, numbness, or other discomfort in chest, stomach (including hernia or rupture), side, neck, back, hips, or any joints of hands, feet, arm or legs | -.299 |
| 8 | Pain, burning, bleeding, itching, or other difficulty with rectum, bowel movements, or urination (passing water) | -.292 |
| 9 | Sick or upset stomach, vomiting or loose bowel movements, with or without fever, chills, or aching all over | -.290 |
| 10 | General tiredness, weakness, or weight loss | -.259 |
| 11 | Cough, wheezing, or shortness of breath with or without fever, chills, or aching all over | -.257 |
| 12 | Spells of feeling upset, being depressed, or of crying | -.257 |
| 13 | Headache, or dizziness, or ringing in ears, or spells of feeling hot, or nervous, or shaky | -.244 |
| 14 | Burning or itching rash on large areas of face, body, arms, or legs | -.240 |
| 15 | Trouble talking, such as lisp, stuttering, hoarseness, or inability to speak | -.237 |
| 16 | Pain or discomfort in one or both eyes (such as burning or itching) or any trouble seeing after correction | -.230 |
| 17 | Overweight or underweight for age and height or skin defect of face, body, arms or legs, such as scars, pimples, warts, bruises, or changes in color | -.186 |
| 18 | Pain in ear, tooth, jaw, throat, lips, tongue;
missing or crooked permanent teeth — includes wearing bridges or false teeth; stuffy, runny nose; any trouble hearing — includes wearing a hearing aid |
-.170 |
| 19 | Taking medication or staying on a prescribed diet for health reasons | -.144 |
| 20 | Wore eyeglasses or contact lenses | -.101 |
| 21 | Breathing smog or unpleasant air | -.101 |
| 22 | No symptoms or problem (not on respondent’s card) | -.000 |
| 23 | Standard symptom/problem (not on respondent’s card) | -.257 |
| 24 | Trouble sleeping | -.257 |
| 25 | Intoxication | -.257 |
| 26 | Problems with sexual interest or performance | -.257 |
| 27 | Excessive worry or anxiety | -.257 |
| STEP | BRIEF STEP DEFINITION | WEIGHT |
|---|---|---|
| Mobility Scale (MOB) | ||
| 5 | No limitations for health reasons | -.000 |
| 4 | Limited in travel, health-related | -.062 |
| 2 | In hospital, health related | -.090 |
| Physical Activity Scale (PAC) | ||
| 4 | No limitations for health reasons | -.000 |
| 3 | Limited in walking, health related | -.060 |
| 1 | In bed, chair, couch or wheelchair, health related | -.077 |
| Social Activity Scale (SAC) | ||
| 5 | No limitations for health reasons | -.000 |
| 4 | Limited in other role activity, health related | -.061 |
| 3 | Limited in major (primary) role activity, health related | -.061 |
| 2 | Performed no major role activity, health related, but did perform self-care activities | -.061 |
| 1 | Performed no major role activity, health related, and limited in self-care activities, health related | -.106 |
Calculating Formulas:
Formula 1: Point-in-time Well-being score for an individual (W):
W = 1 + (CPXwt) + (MOBwt) + (PACwt) + (SACwt)
Where wt is the preference-weighted measure for each factor and CPX is symptom/problem complex. For example, the W score for a person with the following description profile may be calculated for one day as follows:
| Element | Description | Weight |
|---|---|---|
| CPX-11 | Cough, wheezing, or shortness of breath, with or without fever, chill, or aching all over | -.257 |
| MOB-5 | No limitations | -.000 |
| PAC-1 | In bed, chair, or couch health related | -.077 |
| SAC-2 | Performed no major role activity, health related, but did perform self-care activities | -.061 |
W = 1 + (-.257) + (-.000) + (-.077) + (-.061) = .605
Formula 2: General Health Policy Model Formula for Well-Years (WY) as output measure:
QALY = [No. of Persons X (CPXwt + MOBwt + PACwt + SACwt)] X Time
References
- Anderson JP, Bush JW, Berry CC: Classifying function for health outcome and quality of life evaluation: Self versus interviewer modes. Medical Care. 1986;24:454-469.
- Anderson JP, Bush JW, Berry CC: Internal consistency analysis. J Chron Dis. 1988;41:127-137.
- Holbrook TL, Anderson JP, Sieber WJ, Browner D, Hoyt DB. Outcome after major trauma: discharge and 6-month follow-up results from the Trauma Recovery Project. J Trauma. 1998;45:315-324.
- Holbrook TL, Anderson JP, Sieber WJ, Browner D, Hoyt DB. Outcome after major trauma: 12 month and 18-month follow-up results from the Trauma Recovery Project. J Trauma. 1999;46:765-773.
- Holbrook TL, Hoyt DB, Anderson JP, Hollingsworth-Fridlund, Shackford S. Functional limitation after major trauma: A more sensitive assessment using the Quality of Well-being scale – The Trauma Recovery Pilot Project. J Trauma. 1994;36:74-78.
- Kaplan RM, Atkins CJ, Timms RM: Validity of a Quality of Well-being scale as an outcome measure in chronic obstructive pulmonary disease. J Chron Dis. 1984;37,85-95.
- Kaplan RM, Bush JW, Berry CC. Health status: Types of validity and the index of well-being. Health Services Research. 1976;11:478-507.
- Kaplan RM, Bush JW, Berry CC: Health status index: Category rating versus magnitude estimation for measuring levels of well-being. Med Care. 1979;17:501-523.
- Kaplan RM, Bush JW, Berry CC. The reliability, stability and generalizability of a health status index. In: Proceedings of the American Statistical Association, Social Statistics Section; 1978;704-709.
- Kaplan RM, Bush JW. Health-related quality of life measurement for evaluation research and policy analysis. Health Psychol. 1982;1:61-80.
- Kaplan RM: Health-related quality of life in cardiovascular disease. J Consult Clin Psych. 1988;56:1-11. Schwartz CE,
- Kaplan RM, Anderson JP, Holbrook TL, Genderson MW: Co-variation of physical and mental symptoms across illnesses: results of a factor analytic study. Ann Behav Med. 1999;21:122-127.
- Schwartz CE, Kaplan RM, Anderson JP, Holbrook TL, Genderson MW: Co-variation of physical and mental symptoms across illnesses: results of a factor analytic study. Ann Behav Med. 1999;21:122-127.
Lessons Learned Using the Functional Capacity Index (FCI)
Roderick J. McClure, Ph.D.
Ellen J. MacKenzie, Ph.D.
Steve Luchter,
B.S.
Introduction
The individual and community burden of non-fatal injury is increasingly becoming the focus of clinical, preventive and health services research. Research of this kind relies upon valid and reliable measures, suitable for use at the population level, which can accurately predict the long-term outcomes of injury. The Functional Capacity Index (FCI) has been developed as just such a measure and preliminary studies suggest it has the potential to serve as the principal instrument in this context (MacKenzie et al., 1996).
The FCI maps Abbreviated Injury Scale 1990 Revision (AIS 1990) unique identifiers into total body scores that reflect expected levels of reduced functional capacity experienced by a person twelve months after sustaining the specified injury (Association for the Advancement of Automotive Medicine, 1990). This total body score is a number between 0 (no limitations) and 1 (death) and is comprised of weighted summed scores representing the injury’s effect on each of 10 attributes: eating, excretory function, sexual function, ambulation, hand/ arm function, bending/ lifting, vision, hearing, speech, and cognitive function. Thus the FCI is a Multi-Attribute Utility Scale.
The FCI was initially constructed in several stages but effectively these reduce to two basic steps. First, a panel of experts described an expected functional capacity profile for each of the injuries in the AIS 1990 across the ten attributes. Second, a convenience sample from the community was asked to provide their preference ratings for deficits in each of these dimensions. These preference ratings were used to create value weights which, when applied to the functional capacity profiles described by the expert panel became the FCI. It is well recognized that epidemiological study of injury is not possible without a means to group the heterogeneous entity into relevant subsets on the basis of severity, and the injury severity scores based upon the AIS have proven to be universally useful. With the increasing concentration of research efforts on long-term outcomes of injury, it has become clear that it would be advantageous to extend the AIS to include a disability index that scored injuries according to their predicted 12-month outcomes. Thus it can be seen that the FCI was not initially a health status measurement instrument – but rather a means of categorizing injury on the basis of “threat to functional capacity.”
The methods of construction of the FCI, however, provide it with a powerful attribute. While it does not measure the burden of injury, it can be used to estimate the burden for specific populations using the routinely collected AIS unique identifiers, which operate in this context as anatomical prognostic factors. This is, of course, a far less expensive process than routine measurement of injury outcomes themselves.
Outcome events are the deterministic consequence of multiple prognostic factors, most of them unknown, operating in a multi-level web of causation. Prognostic studies describe outcomes within population samples “stratified” on the basis of the key causal prognostic factors. In its predictive function, the FCI is an estimate of the loss of functional capacity attributable to the anatomic injury (AIS unique identifier). Experience shows that outcomes of health conditions are multi-factorial and the amount of variation in outcome is rarely explained by one factor alone. While the FCI, based on the anatomical predictors, will not explain all the variation in long-term outcome, a simple model can be used alone and a more complex model can be combined with other non-injury predictors.
The clear point remains however that for any of the claimed benefits of the FCI to be real the FCI must be a valid and reliable predictor of that aspect of long-term functional capacity that is directly due to the anatomic injury. Further testing of this instrument is necessary to demonstrate this.
Subsequent to the initial FCI development (Mackenzie et al., 1996), a survey form suitable for telephone administration in English has been now developed for measuring functional capacity in injured patients. This results in a functional capacity profile across the same 10 dimensions described in the development of the FCI. It is now possible to calculate FCI scores for functional capacity profiles obtained from this survey form where these scores are then “observed” rather than “predicted” values. The addition of this instrument to the FCI suite ensures that it is the most complete and flexible means available for the measurement of outcomes of injury. This instrument now enables the validity of the FCI to be formally tested in an empirical study.
The aim of this study is to test the validity of FCI by comparing the predicted total body functional capacity with that empirically observed in a sample of people twelve months after their injury.
Methods
Study Design: A criterion validity, prospective cohort study.
Setting: The project was conducted in the Brisbane area over an eighteen-month period between 1 June 1998 and 14 January 2000. Brisbane is a sub tropical metropolitan city on the eastern seaboard of Australia with two trauma centers serving a population of 1.5 million people.
Participants and Process: All patients who are admitted for more than 24 hours to one of the two trauma centers via the emergency department with an acute condition that can be coded to an ICD9-CM category between 800.0 and 959.9 are included in the Queensland Trauma Registry.
During the first six-month of the study period, Registry patients were approached while in hospital and consented to a twelve month follow-up. Baseline data obtained included: hospital number; name; date of birth; gender; address; date of injury; injury cause; place of injury; admission date and time; disposal from emergency department; injury outcome at discharge; diagnosis (an AIS code is assigned to each injury); and injury severity score (ISS) is calculated and estimated outcomes at 12 months (FCI estimated on basis of AIS unique identifier).
Between 12 and 13.5 months following their injury, each of the participants was contacted by telephone and a 30-minute questionnaire was administered (Mackenzie et al., 1996). Those not captured in this six-week window were considered lost to follow up.
Analytic Strategy: The initial analysis is descriptive and considers the distribution of functional capacity decrements across each of the 10 attributes for the range of participants and injuries in the sample. This paper describes a work in progress and it is these results that are presented in this paper. The next step is to calculate observed FCI scores from the measured health profiles and compare predicted versus observed FCI using in Chi squared, paired “t” tests and Intra class correlations in order to establish the criterion validity of the instrument.
Preliminary Results – Response rates and sample characteristics: Of the patients registered in the Queensland Trauma Registry, 665 registered in the follow-up study. There were 619 who were contacted and completed the questionnaire at twelve months thus resulting in a response rate of 93 percent. Mean time of questionnaire completion for fully recovered was 2 minutes (SD = 2) and for the residual disability group, 17 minutes (SD = 12). A small majority (i.e., 335 or 54%) reported full recovery while 284 reported some residual disability. The time to recovery for the sample is illustrated in Figure 1. As is clear from the figure, complete recovery (i.e., return to pre-injury functional capacity) in a population appears to follow a standard decay curve with a consequent suggestion that some recovery (or accommodation) is still expected after a twelve-month interval.
FIGURE 1
Time Until
Recovery
Base-line characteristics of the responders are shown in Table 1. The Table also indicates the characteristics of the total population of persons admitted to the two trauma center hospitals during the twelve months of 1998. Differences between the study group and the reference group are particularly notable with respect to gender and injury severity.
| Characteristics | Sample Study Population
n=619
Number |
Sample Study Population
n=619
Percent |
Total Study Population
1998
Percent |
|---|---|---|---|
|
Age | |||
| 16-24 | 178 | 29% | 26% |
| 25-34 | 124 | 20% | 18% |
| 35-44 | 83 | 13% | 13% |
| 45-54 | 92 | 15% | 9% |
| 55-64 | 43 | 7% | 5% |
| 65-74 | 52 | 8% | 7% |
| 75-84 | 33 | 5% | 10% |
| 85 + | 13 | 2% | 9% |
| Missing | 1 | - | 2% |
| Sex | |||
| Male | 452 | 73% | 64% |
| Female | 167 | 27% | 36% |
| ISS | |||
| <4 | 78 | 13% | 15% |
| 4-8 | 248 | 40% | 29% |
| 9-15 | 219 | 35% | 32% |
| 16-24 | 40 | 7% | 7% |
| >24 | 34 | 6% | 17% |
| Length of Stay (in weeks) | |||
| <1 | 360 | 59% | 55% |
| 1-2 | 139 | 23% | 17% |
| 2-6 | 34 | 6% | 9% |
| 6-26 | 5 | 1% | 2% |
| 26-52 | 2 | - | 1% |
| Missing | 79 | 13% | 17% |
Loss of functional capacity across the 10 FCI attributes is described in Table 2. While the majority of Functional Capacity loss was in the dimensions of hand/arm function, lifting and bending, and ambulation; important deficits were also noted across the full range of attributes. Of particular note is the relatively large number of people in the sample who described a residual cognitive defect at 12 months post injury.
| FCI Attribute | Decrement Observed Number |
Decrement Percent |
|---|---|---|
| Eating | 23 | 4% |
| Excretory Function | 28 | 5% |
| Sexual Function | 16 | 3% |
| Ambulation | 205 | 3% |
| Hand/arm Function | 264 | 43% |
| Bending lifting | 259 | 42% |
| Vision | 30 | 5% |
| Hearing | 10 | 2% |
| Speech | 21 | 4% |
| Cognitive Function | 76 | 12% |
Significantly, as is illustrated in Table 3, the distribution of decrements across dimensions is associated with the nature of injury sustained. For example, 26 percent of people who sustained head injuries complained of some cognitive defect 12-month after their injury while only 10% of those without head injury complained of some cognitive loss. Hearing, speech, and vision loss was several times higher in patients who had head injury compared with those without, while the basic physical and ambulation attributes were more equitably distributed.
| FCI Attribute | Number With Head Injury n = 104 | Percent of Subtotal With Decrement | Number Without Head Injury n = 515 | Percent of Subtotal With Decrement |
|---|---|---|---|---|
| Eating | 7 | 7% | 16 | 3% |
| Excretory Function | 10 | 10% | 18 | 4% |
| Sexual Function | 3 | 3% | 11 | 2% |
| Ambulation | 48 | 46% | 157 | 30% |
| Hand/arm Function | 56 | 54% | 208 | 40% |
| Bending lifting | 51 | 49% | 195 | 38% |
| Vision | 12 | 12% | 10 | 2% |
| Hearing | 4 | 4% | 2 | - |
| Speech | 10 | 10% | 11 | 2% |
| Cognitive Function | 26 | 26% | 50 | 10% |
The amount of functional capacity lost within the relevant attributes also relates to the severity of injury as recorded by the AIS severity score. Table 4 indicates that only 8% of people with an AIS 1 injury to the lower limb had residual disability at 12 months compared with 30 percent of people with an AIS 2 or 3 injury.
| FCI Attribute | AIS 1 n = 133 |
Percent of Subtotal With Decrement | AIS 2-3 n = 205 |
Percent of Subtotal With Decrement |
|---|---|---|---|---|
| Ambulation | 3 | 8% | 79& | 29% |
| Hand/arm Function | 1 | 3% | 10 | 4% |
| Cognitive Function | 1 | 3% | 4 | 1% |
Discussion
Support for the FCI as the most complete and flexible tool for measuring and classifying the outcomes of injury depends upon it being demonstrated that the FCI is a valid and reliable predictor of that aspect of long term functional capacity, which is directly due to the anatomic injury. The preliminary results presented here are not sufficiently progressed to be conclusive on this issue although there is considerable indication that with a more complete analysis the project described here will contribute to the growing body of literature demonstrating the properties of the Index.
What is clear from the preliminary results is that the recently developed, functional capacity measurement instrument associated with the FCI is simple to use. This is confirmed by the fact that the entire battery of questionnaires (of which the FCI constituted about half the questions) took, on average, only 17 minutes to administer by telephone to the residually injured and 2 minutes to administer to the recovered. It is also clear from the preliminary analysis that the instrument has some degree of face validity as the distribution of deficits identified in the patient profiles displayed an appropriate range and distribution with respect to type and severity of the original injury sustained. Deficits were noted in all of the ten FCI dimensions and, as in the case of cognitive function, in a sufficiently high frequency to argue for the inclusion of all these dimensions in any such score which measures outcomes from injury.
While completion of the results in this study will provide valuable insight into the validity of the FCI, wide and frequent use of this instrument is necessary for its properties to be properly evaluated. Beyond the issues of predicting that component of injury due to anatomical damage, information is also required on non-injury related determinants of recovery. Also required is more information on the valuing of health states in the context of injury and the factors that effect preference weights. The study has shown that the FCI suite is extremely user friendly. On the basis of this work, there is every reason to encourage this instrument to be included in all long-term injury outcome studies in order to provide the data to better understand the full capabilities of the score.
References
- Association for the Advancement of Automotive Medicine (AAAM). The Abbreviated Injury Scale. 1990 Revision. Des Plaines, Illinois: Association for the Advancement of Automotive Medicine; 1990.
- MacKenzie EJ, Damiano A, Miller T, Luchter S. The development of the Functional Capacity Index. J Trauma. 1996;41:799-807.
The European Quality of Life Scale – EQ-5D
Sari Ponzer, M.D.
The European Quality of Life Scale (EuroQoL) is a generic instrument for describing and valuing health-related quality of life. An international team, the EuroQoL Group, developed it in 1987. The EuroQoL was first published in 1990, although, since then the instrument has undergone slight changes. The five-dimensional EuroQoL, the EQ-5D, has remained unchanged since 1991 (Brooks, 1996).
Any quality of life instrument should capture the multi-faceted domains of physical, psychological, and social functioning. The EuroQoL was intended to complement other quality of life or disease-specific measures. One of the characteristics of the EuroQoL is that it is simple. Being simple, it loses some of its multi-dimensionality. However, as the EuroQoL group has stated, the instrument was never designed to be as comprehensive as, for example, the Short Form 36 Health Survey (SF-36), even though the goal was to cover the health spectrum from best to worst. The EuroQoL Group planned from the outset to generate a measure that reflected the valuations of the public. Therefore, it is preference-based and also one of the few instruments that make it possible to combine different dimensions of health to form an overall index, as required for health care evaluations.
The EQ-5D contains four components; the first two, the health status profile and the visual analogue scale (VAS), are used for data collection and the last two, the valuation section and the background data, for valuation of different health states (The EuroQoL group, 1990). The health status profile has five dimensions: mobility, self-care, usual activities, pain/discomfort and anxiety/depression. Each dimension is divided into three degrees of severity: no problem, some problems, or major problems. The second part is a 20-cm visual analogue scale where the respondent is asked to mark off his or her own current state of health on a thermometer-like line calibrated from zero to 100. Zero indicates the worst and 100 the best imaginable state of health. The third and fourth parts are designed for valuing the 243 (53) possible states of health for specified populations. The third part defines 13 different states of health and the state of unconsciousness, and the respondents are asked to value these health states. This is usually done with the aid of a visual analog scale. The respondent is asked to rate the composite states of health on a 0-100 thermometer-like scale by drawing a line from each state of health, to the value on the thermometer chosen by the respondent. This approach has been widely used since it is the simplest and can be used in mailed questionnaires. Dolan used the Time Trade-Off (TTO) method to rate these different health states (Dolan et al., 1996). A large United Kingdom (UK) population sample (>3000 respondents) was interviewed by trained interviewers and asked to rate 42 of the possible health states. These ratings are considered to characterize the views of a representative UK adult population.
For the purpose of calculating quality-adjusted life years, QALYs, a simple index measure, such as the EQ-5D, is required. However, it should be remembered that the EQ-5D could be used to generate data for such purposes as monitoring treatment, even if the QALY approach is not adopted (Williams, 1995).
The validity of the EQ-5D has been assessed within the general population in different countries and within a number of different patients groups (Brazier et al., 1993, 1996; van Agt et al., 1994; Hurst et al., 1997; Dorman et al., 1998). The EQ-D5 has been shown to compare favorably in terms of internal and external validity with more elaborate quality-of-life tests, being only slightly less sensitive than the SF-36. In 1996, Brazier et al. compared the EQ-5D and the SF-36 in a mail survey. They concluded that “the SF-36 provides a more sensitive description of health across the dimensions and may be more useful for measuring health in populations with less severe morbidity, and that the large ceiling effects of the EQ-5D suggest that it would be more suitable for measuring the health of populations with more morbidity.” In 1997, Essink-Bot et al. compared the Nottingham Health Profile, the SF-36, the COOP/WONCA charts, and the EuroQoL in measuring the impact of migraine on health status. They concluded: “None of the instruments performed uniformly as ‘best’ or ‘worst.’
In general, the choice of the most suitable instrument for generic health status assessment in a particular study should be guided by the special features of each candidate instrument under consideration.” Johnson and Coons (1998) compared the EQ-5D and the SF-12 via a mail survey and also reported the SF-12 to be more sensitive to differences associated with less severity.
The EuroQoL has not been used frequently in trauma and injury research. However, during the last few years there has been a growing interest and additional studies have been done. Coast et al., (1998) studied the use of EuroQoL among elderly acute care patients. In 1999, Dolan et al. used the EQ-5D in a study on Colles´ fractures. Gabriel et al. (1999) studied the importance of the source of preference and its impact on the cost-effectiveness of osteoporosis interventions. Jonsson et al. (1999) conducted a study on the cost-effectiveness of treatment that reduces the risk of hip fracture using a computer simulation model, and Salkeld et al. (2000) estimated the utility associated with hip fracture and the fear of falling among elderly women.
Our experience of the EQ-5D is based on studies of patients with hip fractures. We conducted a study with the main purpose of investigating whether the EQ-5D questionnaire was suitable for use in an elderly hip fracture population (preliminary data: Tidermark et al., 1998). Ninety consecutive patients with hip fractures, treated with internal fixation were included and followed up prospectively during one year. Patients with cognitive failure at the time of inclusion were excluded. All patients were able to fill out the health status profile questionnaire at inclusion, 97% at 4 months, and 89% at 12 months. The decreasing number was mainly explained by a failing cognitive function. A weight for each state of health was calculated based on the scoring functions presented by Dolan et al. in 1996. The results showed a decrease in the quality of life values during the follow-up, and the patients did not regain their pre-fracture health status level during the study period. At each assessment, the mean quality of life was higher for those with healing fractures than for those with healing complications, even if this was significant only at 17 months.
We also attempted to use the EQ-5D-VAS among these elderly hip fracture patients, but even when an interviewer explained the VAS question, only about 70% of the patients were able to give an answer. We concluded that the EQ-5D health status profile is suitable for use in an elderly hip fracture population where the post-fracture morbidity is pronounced, but also that the EQ-5D-VAS seems less easily understood by elderly persons. Our results also imply that the EQ-5D produces information useful for monitoring the surgical complications after a hip fracture.
One of the limitations of the EuroQol is that a cognitive dimension is not included in the health states and their values. Krabbe and colleagues (1999) have addressed this issue by adding a cognitive dimension to the EQ-5D in their study. They showed that the cognitive dimension generated systematically different values compared with the standard version. This question needs to be looked at further.
The EuroQol appears to have potential as an instrument for measuring outcome after injuries in populations with pronounced morbidity. The health status profile is simple and easy to use, which is an important point in injury research. It also generates an index for health care evaluation. However, before the EQ-5D can be fully adopted in injury research, additional studies are needed.
References
- Agt HME van, Essink-Bot ML, Krabbe PFM and Bonsel GJ. Test-retest reliability of health state valuations collected with the EuroQol questionnaire. Soc Sci Med. 1994;39:1537-44.
- Brazier J, Jones N, Kind P. Testing the validity of the EuroQol and comparing it with the SF-36 Health Survey Questionnaire. Qual Life Res. 1993;2:169-180.
- Brazier J, Walters SJ, Nicholl JP, Kohler B. Using the SF-36 and EuroQol in an elderly population. Qual Life Res. 1996;5:195-204.
- Brooks R, with the EuroQoL Group. EuroQoL: the current state of play. Health Policy. 1996;37:53-72.
- Coast J, Peters TJ, Richards SH, Gunnell DJ. Use of the EuroQoL among elderly acute care patients. Qual Life Res. 1998;7(1):1-10.
- Dolan P, Gudex C, Kind P, Williams A. The Time Trade-Off method: Results from a general population survey. Health Econ. 1996;5:141-154.
- Dolan P. Torgerson D, Kakarlapudi TK. Health-related quality of life of Colles’ fracture patients. Osteoporosis Int. 1999;9:196-199.
- Dorman PJ, Slattery J, Farrell B, Dennis MS, Sandercock PAG and the UK collaborators in the International Stroke Trial. A randomised comparison of the EuroQoL and Short Form-36 after stroke. BMJ. 1997;315:461.
- Essink-Bot ML, Krabbe PFM, Bonsel GJ, Aaronson NK. An empirical comparison of four generic health status measures. The Nottingham Health Profile, The Medical Outcomes Study 36-Item Short-Form Health Survey, the COOP/WONCA Charts and the EuroQoL instrument. Med Care. 1997;35:522-537.
- EuroQol Group. EuroQol: a new facility for the measurement of health-related quality of life. Health Policy. 1990;16:199-208.
- Hurst N, Kind P, Ruta D, Hunter M, Stubbings A. Measuring health-related quality of life in rheumatoid arthritis: validity, responsiveness and reliability of EuroQoL (EQ-5D). British Journal of Rheumatology. 1997;36:551-559.
- Johnson JA, Coons SJ. Comparison of the EQ-5D & SF-12 in an adult US sample. Qual Life Res. 1998;7:155-166.
- Jonsson B, Kanis J, Dawson A, Oden A, Johnell O. Effect and Offset of treatments for hip fracture on health outcomes. Osteoporosis Int. 1999;10:193-199.
- Krabbe PF, Stouthard ME, Essink-Bot ML, Bonsel GJ. The effect of adding a cognitive dimension to the EuroQoL multi-attribute health-status classification system. J Clin Epidemiol. 1999;52(4):293-301.
- Salkeld G, Cameron ID, Cumming RG, Easter S, Seymour J, Kurrle SE, Quine S. Quality of life related to fear of falling and hip fracture in older women: a time trade off study. BMJ. 2000;320:241-246.
- Tidemark J, Panzer S, Törnkvist H, Svensson O. Quality of life after cervical hip fracture. In: Proceedings of the Swedish Orthopedic Society Meeting. 1998.
- Williams A. The role of the EuroQoL instrument in QALY calculations. York Centre for Health Economics Discussion Paper No. 130. York, England: University of York; l995.