CHAPTER 5 - HURRICANE MODELING
FRAMEWORK: A CASE STUDY FOR ELIZABETH CITY AND LOUISBURG
Introduction
This chapter describes the assumptions, inputs, and results of the
traffic simulation model created to analyze the emergency vehicular evacuations
of Elizabeth City and Louisburg, North Carolina. Since some sectors of the
population (specifically, the elderly and disabled) may not be able to evacuate
by their own means, the study presents a methodology to determine the
scheduling of buses to be used for that purpose. This methodology is presented as a case study for both Elizabeth
City and Louisburg. Additionally, the
study determined the expected time to evacuate the entire population under a
natural threat such as a hurricane, identified the locations of the potential
traffic bottlenecks, and assessed traffic operation strategies aimed at
mitigating the resulting congestion.
Methodology to
Model Regional Emergency Evacuations
The analysis and planning process of regional evacuations consists of
several steps. First, it is necessary
to determine the area at risk, that is, the region to be evacuated. This, in turn, involves the delineation of
the Emergency Planning Zones (EPZs), which includes the Immediate Response Zone
(IRZ), the Protective Action Zone (PAZ), and the Precautionary Zone (PZ). Although the delineation of these three
zones involves many considerations, in general, the IRZ is defined as an area
where an effective and prompt response is critical in order to avoid the loss
of human lives; the PAZ is an area slightly farther removed from immediate
danger but is potentially threatened depending upon the type of disaster and,
in some cases, weather conditions; and the PZ is the farthest area where no
adverse effects may be expected for the population. For both Elizabeth City and Louisburg, the consideration is that
the IRZ involves the entire metropolitan areas (approximately 30 square miles
in both cases).
Second, it is necessary to assess the population at risk, not only to
identify their location and geographical distribution, but also to estimate the
reaction times. In the case of a
hurricane, the reaction time can be relatively long, that is, there is usually
ample time and adequate warning in advance for the population to evacuate in an
organized manner. Since most people
would choose to depart from their residences, census data are often used to
estimate the population distribution within the IRZ. This would also be the case for certain incidents with relatively
short reaction time. For example,
evacuation planning for an accidental release of toxic gases during the nighttime
can be based on census data assuming most people would slumber at home. On the other hand, if the accidental gas
release occurs during the day, it would be more challenging to predict the
population distribution (i.e., people may be at work, school, home, or en
route) within the IRZ. For such cases,
the short reaction time makes it impossible to assume that people would go home
before evacuating the area.
Finally, behavioral analysis models are used to estimate the number of
people that may actually choose to evacuate and to determine their departing
times, destinations, and vehicle occupancy.
These behavioral models depend on the type and severity of a disaster;
for example, one might expect that a lower percentage of the population to
evacuate the IRZ in the case of a hurricane than that of a toxic gas release.
These three steps produce a demographic model that includes the origin
and destination (O-D) data and transportation network loading estimates as
functions of time. This information,
along with the transportation network topology and link capacities, serves as
the inputs to the traffic simulation model.
The traffic simulation model used in this study is the Oak Ridge
Emergency Management Systems (OREMS).
It is a microcomputer-based system that simulates traffic flow during
emergency vehicular evacuations. It
calculates the duration of the evacuation process of the population within the
entire planning zones and also for specific sections of the EPZs, allowing the
determination of the percentage of the population at risk over time based on
the rate of at which the evacuation is proceeding. The model also produces a variety of spatially distributed
traffic and transportation measures of effectiveness (MOEs) that permit the
identification of potential “hot spots” or traffic operations bottlenecks
within the EPZs.
OREMS consists of three major components: a data input manager, a
traffic simulation model, and an output data display manager. The roadway system is represented in the
input module as a network of nodes and links, where the former represent major
intersections on the network while the latter refers to a unidirectional
roadway segment of urban streets or freeways.
Besides network topology, other necessary input data include geometry
and traffic channelization information, traffic volumes and departing times
(from demographic information), traffic control devices and settings, and other
traffic operational characteristics.
After running the traffic simulation, the output display utility of
OREMS presents the expected evacuation time and other results such as for
example average speeds, and number of trips at user-specified time
intervals. The statistics are provided
for individual links as well as for the entire network in a summary format.
Modeling Vehicular Evacuation
Operations
Geographical
Location Description
Elizabeth City is located on the north-east part of the state on the
mouth of the Pasquotank River. The main
roads crossing the town are US Highway 17 (to the south-west and north-west)
and US Highway 158 (to the east and north-west). The closest Interstate Highway is 95, approximately 90 miles to
the west of Elizabeth City. Louisburg
is located in the north-central area of North Carolina, approximately 25 miles
north-east of Raleigh. US Highway 401
is the major road crossing the town (north south direction); other roads
include State Roads 39, 56, 561, and 581.
The closest interstate highways are Interstate 85, approximately 25
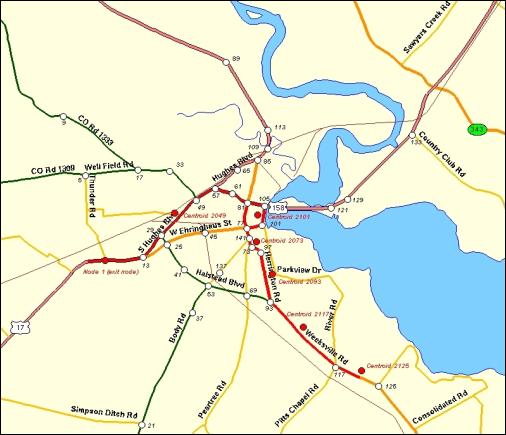
miles west of Louisburg, and Interstate 95 about 27 miles to the east. Figures 5.1 and 5.2 show maps of the two
cities indicating the major roads.
Network Topology
and Geometric Characteristics
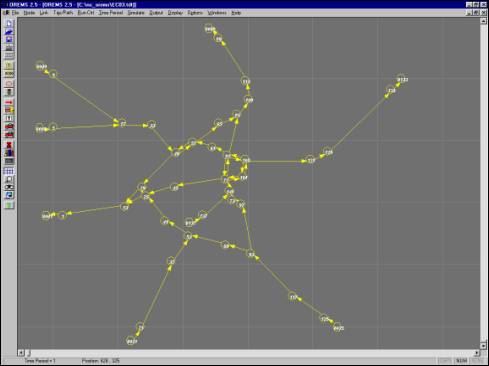
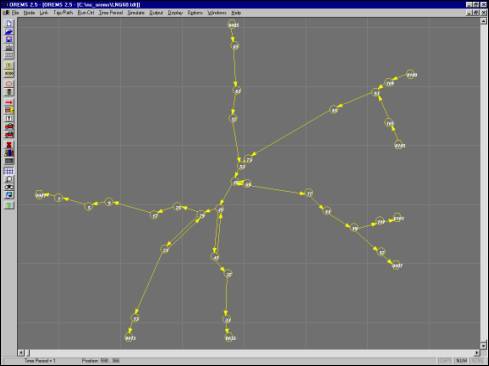
As described previously, the traffic network is represented in OREMS by
placing nodes at major intersections and at points where the geometry of the
roadway changes and connecting those nodes with links representing
unidirectional roads. Figures 5.1 and
5.2 show the location of the nodes —represented as white circles— that were
selected to model the traffic networks of Elizabeth City and Louisburg,
respectively (the numbers beside the nodes correspond to the node
identification numbers used in OREMS).
Figures 5.3 and 5.4 show the representation of the traffic networks in
OREMS.
For Elizabeth City it is assumed that in case of an emergency
evacuation, the evacuation routes will be US Highway 158 (east and northbound)
and US Highway 17 westbound. In the
case of Louisburg, the evacuation routes are assumed to be US Highway 401
southbound, State Route 56 westbound, State Route 39 southbound, and State
Route 581 eastbound. Under these
assumptions, only the outgoing links are represented in OREMS.
The traffic simulation model also requires information about the
geometric characteristics of the links, specifically their capacity as
represented by the number of lanes available and the free-flow speed, and the
specifications of the intersection traffic control types and settings. Appendix A presents two tables, Table A1 for
Elizabeth City and Table A2 for Louisburg, with information about each link’s
number of lanes and turning bays —for left and right turners—, grade, and free-flow
speed (the links are identified by their upstream and downstream nodes). Tables A1 and A2 also show the type of
traffic control devices at the downstream nodes of each link, as well as
related parameters such as mean-queue discharge headways and start-up lost
time. For nodes controlled by pre-timed
traffic signals, the OREMS files included with this report present all the
relevant information (i.e., phases and timing) that is not included in the
tables of Appendix A.
Traffic Control
Information
In order to model the network at each site, traffic control device
information is needed for all intersections.
Such may include traffic signals (pre-timed or actuated), stop-signs,
etc. Appendixes C and D identify such
information for Elizabeth City and Louisburg, respectively.
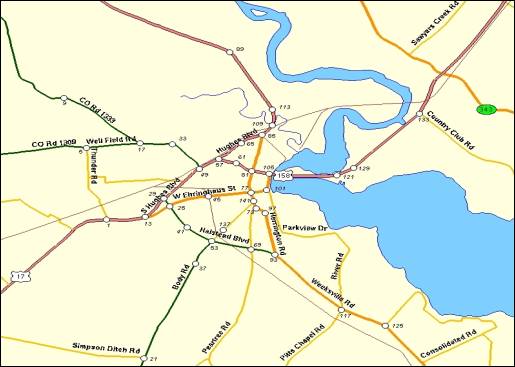
Figure 5.1 - Elizabeth City Major Roads
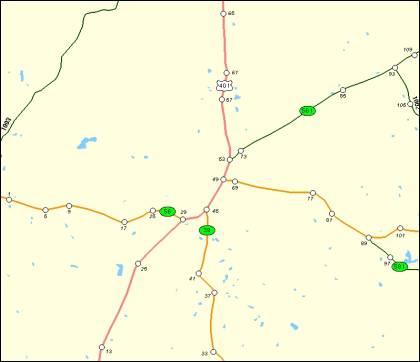
Figure 5.2 - Louisburg Major Roads
Figure
5.3 - OREMS Representation of the Elizabeth City Traffic Network
Figure
5.4 - OREMS Representation of the Louisburg Traffic Network
It should be noted that while most of the intersections are controlled
by fully-actuated signals, they are most likely to be replaced by police or
other personnel with proper jurisdictional oversight responsibilities. In addition, the two-way stop-sign
controlled intersections will likely give very limited, if any, time-allotment
to side-streets under a typical hurricane evacuation condition.
Demographic Model
The traffic simulation model requires not only information about the
topology, geometric characteristics, and traffic controllers of the
transportation network, but also about the location and characteristics of the
population to be evacuated.
Specifically, the demographic model must include information regarding
the geographical points and times at which the population will enter the
traffic network during an emergency evacuation.
Those entry points are represented as cancroids attached to each link
in the traffic network. To assign the
population to each one of these cancroids, census track and census block
information was used along with assumptions about the most likely roads to be
used by the population within these tracks and blocks in case of an emergency
evacuation. Figures 5.5 and 5.6 show
the census tracks and blocks and as well as the traffic network for Elizabeth
City and Louisburg, respectively.
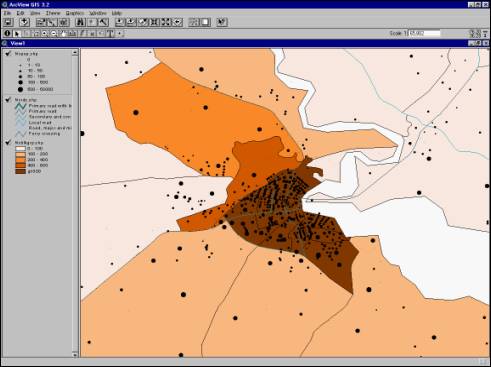
Figure
5.5 - Population Distribution and Traffic Network for Elizabeth City
In order to assign population to cancroids, it was assumed that the
population within a census track or block was uniformly distributed. Areas of influence for each road within and
surrounding a given census track were defined by taking into account the type
of road (the higher the level of the road, the greater its influence in
attracting evacuating population), and its distance to that census track or
block (the closer to the population location, the greater its influence in
attracting evacuating population).
Based on these measures, an index was created that allowed the
assignment of the population in each census track or block to roads in the area. Appendix B presents tables showing this
assignment for both Elizabeth City and Louisburg.
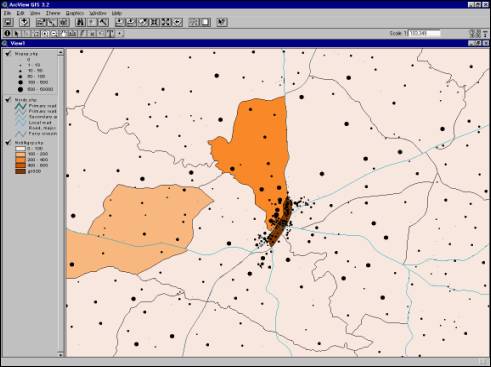
Figure
5.6 - Population Distribution and Traffic Network for Louisburg
Evacuation trips do not commence instantaneously after the official
warning to evacuate. There is a lag
between the time the public is notified to evacuate and the time at which the
actual evacuation begins. This time lag
varies by persons, households, time-of-day, locations, and type of
disaster. It is represented in the
simulation model as a distribution describing the range of responses, also
known as loading curves or departing time curves. That is, these curves represent how the network is loaded
(vehicles per hour entering the network vs. time) at each population
centroid. Figure 5.7 shows such
distribution for a centroid in the Elizabeth City network (similar
distributions were adopted for all the other centroids in this network and on
Louisburg’s network as well).
These distributions depend heavily on the type of disaster being
analyzed since they reflect the reaction time of the population. In the case shown in Figures 5.7 and 5.8, it
is assumed that the population would be departing from their homes within 9
hours after the order to evacuate (AOE) was issued. This is typical for a hurricane evacuation; for other types of
disasters this time may be shorter as shown in Figure 5.8 for a release of a
toxic gas, or other similar disaster, for a centroid in Elizabeth City. Notice that while the shape of the curves is
the same as before (the shape is correlated to how the population behaves in
case of an emergency evacuation), the time span is shorter and the density of
vehicles entering the network higher.
Figure
5.7 - Departing Curve for a Centroid in
Elizabeth
City during an Evacuation Due to a Hurricane
Figure
5.8 - Departing Curve for a Centroid in Elizabeth City
During an
Evacuation Due to the Release of Toxic Gases
Simulation Results
The most important MOE in emergency evacuations is the estimated
evacuation time (EET) of the population at risk to safe areas. The simulation model was run first under the
current network conditions; that is, as if the evacuation would be performed
with the day-to-day operational characteristics of the traffic network for both
Elizabeth City and Louisburg.
For hurricane evacuations, in which as assumed before it would take
about 9 hours for the population to depart, the simulation model gave EETs of
slightly over 9 hours. A close analysis
of the results indicated the presence of congestion earlier in the evacuation
on some of the links in Elizabeth City (no congestion was observed at any time
in Louisburg). This congestion,
however, dissipated as the evacuation progressed, and did not have any
significant impact on the total evacuation time (which, by definition, cannot
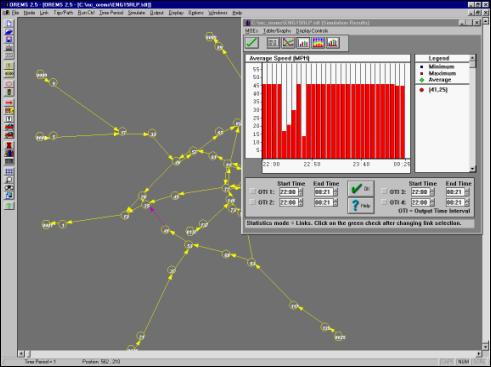
be less than the total departing time of 9 hours in this case). Figure 5.9 shows a graph of average speed
—a measure of congestion— vs. time for one segment of Halstead Boulevard in
Elizabeth City. In fact the entire
Halstead Boulevard from Weeksville Road in the south to West Ehringhaus Street
in the north end presents the same behavior.
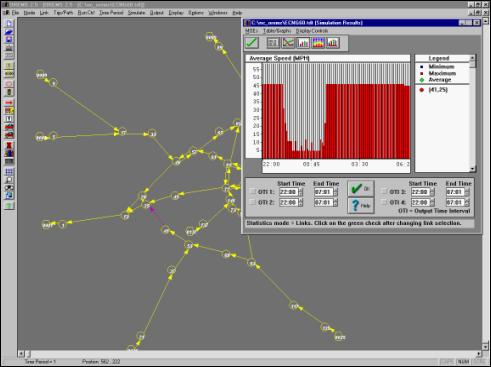
Figure
5.9 - Average Speed vs. Time for Halstead Boulevard South
of the Intersection with West Ehringhaus Street in Elizabeth City
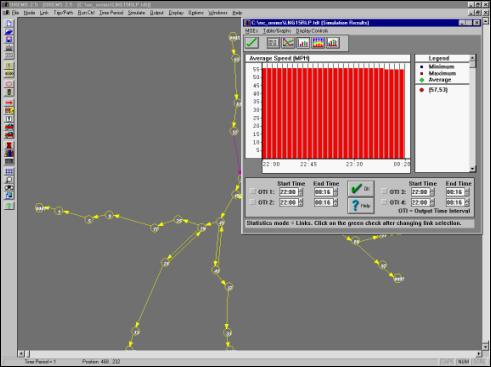
One traffic management approach that could be used to mitigate this
congestion is to deploy a reverse lane strategy on Halstead Boulevard; that is,
the southbound lane of Halstead Boulevard could be open to northbound traffic
during an emergency evacuation increasing the capacity of that roadway. This approach, tested with the simulation
model, indicated that the congestion completely disappeared and that Halstead
Boulevard operated at its free-flow speed during the entire evacuation (see
Figure 5.10).
For other type of disasters, such as for example a spillover of
hazardous materials that would produce the release of toxic gases to the
atmosphere, the population reaction time is shorter (as explained before),
therefore, the network is “loaded” more rapidly and in consequence it is more
likely that severe congestion would appear on the network. The two networks were analyzed under the
assumption of a total departing time of 2 hours and 15 minutes (for example,
a-release-of-toxic-gases-to-the-atmosphere scenario). The simulation model indicated EETs of 3 hours and 4 minutes for
Elizabeth City and 2 hours and 16 minutes for Louisburg. Elizabeth City, under these conditions,
showed severe congestion on some links (see Figure 5.11 below). On the other hand, Louisburg showed only
mild congestion on some of the links, especially at the beginning of the
evacuation (see Figure 5.12).
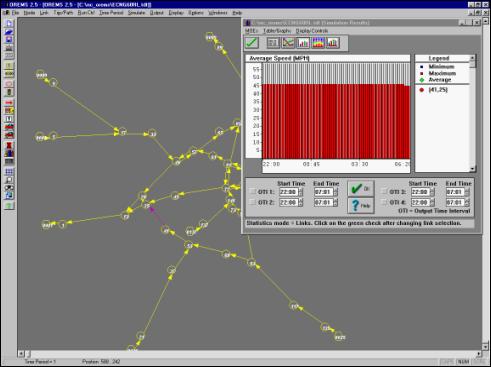
Figure
5.10 - Average Speed vs. Time for Halstead Boulevard (with Reverse Lane
Strategy
Deployed) South of the Intersection with West
Ehringhaus Street in Elizabeth City
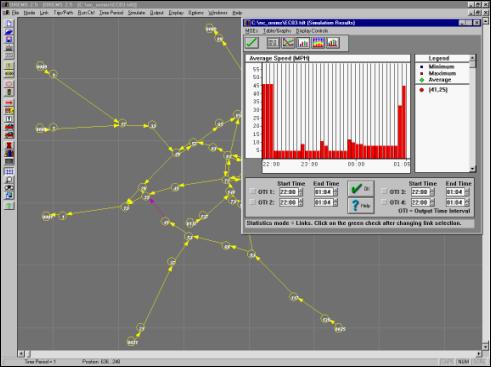
Figure
5.11 - Average Speed vs. Time for Halstead Boulevard
Figure
5.12 - Average Speed vs. Time for US Highway 401 Southbound.
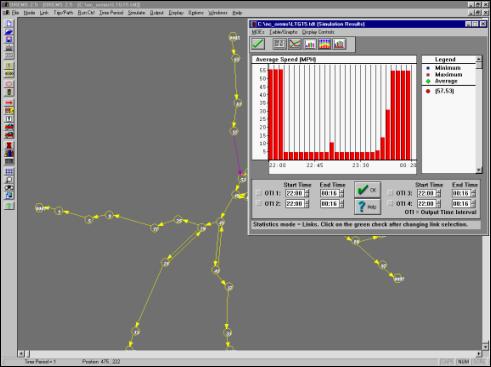
Figure
5.13 - Average Speed vs. Time for Halstead Boulevard with Reverse
Reverse Lane Strategy and Policemen Controlling Traffic at Key Intersections
Reverse lane strategies alone were not able to dissipate the congestion
in the latter of the two cases.
Therefore, a combination of this type of traffic management approach and
the deployment of policemen to direct traffic at key intersections was
studied. For Elizabeth City reverse
lanes were simulated on Halstead Boulevard and on West Ehringhaus Street. The policemen would be deployed at the
intersections of South Hughes Boulevard and West Ehringhaus Street (node 13 on
Figure 5.1), Halstead Boulevard and West Ehringhaus Street (node 25), Hughes
Boulevard and Well Field Road (node 49), and Hughes Boulevard and US Highway
158 (node 57). With these traffic strategies
deployed, the simulation showed an EET of 2 hours 21 minutes (a decrease of
almost 25% in the evacuation time), with significant reductions in congestion
(see Figure 5.13).
For Louisburg, a reverse lane strategy on US Highway 401 south bound
was studied along with the deployment of policemen at the intersections of US
Highway 401 and State Route 561 (node 53 on Figure 5.2) and US Highway 401 and
State Route 56 (node 49). With these
traffic strategies deployed, the congestion disappeared completely (see Figure
5.14).
Figure
5.14 - Average Speed vs. Time for US Highway 401 Southbound
with Reverse Lane Strategy and Policemen Controlling Traffic at Key
Intersections
Modeling the Use of Buses in
Evacuation Operations
The simulation model produced very detailed results for each network
link as a function of time during the entire evacuation. One such statistic provided by the model is
the travel time vs. time on each link in the network. This information can be used to construct travel times from any
node (or centroid) to any other node (or centroid) in the network as a function
of time, which in turn can be used to schedule trips such that the total travel
time is minimized.
One application of this derived statistic could be in scheduling bus
trips to evacuate certain sectors of the population (e.g., the elderly and the
disabled) that otherwise would not be able to evacuate by their own means. The case study presented here used the
Elizabeth City network with the release-of-toxic-gases-to-the-atmosphere
scenario. It is assumed that the buses
are at a garage located on the south part of the city, centroid 2125, and that
the pick–up points are at centroids 2117, 2093, 2073, 2101, and 2049 (see
Figure 5.15). It is also assumed that
once node 1 (Figure 5.15) has been reached, the immediate response zone has
been cleared.
Figure
5.15 - Bus Garage (Centroid 2125),
Route
(Shown in Red), and Pick-up Points in Elizabeth City.
For this Case study it is assumed that the buses would depart from the
garage, arrive at an assigned pick-up point, load the evacuating population,
and follow a predetermined route to exit the network at node 1. Other types of assignments can be studied,
such as stops at several pick-up points for the same bus, but this strategy may
not be the best during an emergency evacuation.
Three pick-up points are considered in this analysis: centroid 2117,
2101, and 2049. Consider for example
centroid 2117. Figure 5.16 shows the
travel time from the garage (centroid 2125) to this pick-up point as function
of time (minutes after the start of the evacuation). For example, if a bus were to depart 5 minutes after the order to
evacuate (AOE) has been given, then it would take less than 2 minute for the
bus to arrive at the pick-up point.
However, if the bus were to depart 35 minutes AOE, then it would take
about 37 minutes to reach centroid 2117.
Figure
5.16 - Travel Time vs. Departing Time from the
Bus
Garage (Centroid 2125) to Pick-up Point 2117
Figure 5.17 shows the travel time from centroid 2117 to node 1. Assuming a bus loading time of 20 minutes,
the bus departing the garage 5 minutes AOE would arrive at centroid 2117 within
7 minutes AOE and would depart from there at 27 minutes (i.e., 7 minutes plus
20 minutes) AOE. Figure 5.17 indicates
a travel time of approximately 26 minutes to node 1 if the departing time is 27
AOE, and so the expected arrival time at node 1 is 53 minutes AOE, with a total
in-route time of about 48 minutes (i.e., 53 minutes minus 5 minutes). This procedure can be automated to determine
the total en-route travel time as function of the departing time from the
garage and the loading time at the pick-up point.
Table 5.1 presents these results for pick-up point 2117. It shows that for loading times of 20, 25,
and 30 minutes, the optimal departing times from the garage are at 10, 10, and
0 minutes AOE, respectively. The table
also shows that the worst time to depart is 40 minutes AOE, which represent an
increase in en-route travel time of 134%, 141%, and 128% for loading times of
20, 25, and 30 minutes, when compared to the optimal en-route times.
Figures 5.18 and 5.19 and Table 5.2 below show the information
described above for pick-up point 2101; and Figures 5.20 and 5.21, and Table
5.3 for pick-up point 2049.
Figure
5.17 - Travel Time vs. Departing Time from Pick-up Point 2117 to Exit Node 1
Table 5.1
- En-route Travel Time as Function of Departing Time
from
Garage and Loading Time at Pick-up Point 2117
|
|
|
Loading
Time |
||
|
Bus
Departs at |
20
Min |
25
Min |
30
Min |
|
|
0
min AOE |
49.67 |
57.20 |
58.15 |
|
|
10
min AOE |
48.15 |
49.35 |
66.05 |
|
|
20
min AOE |
56.05 |
57.63 |
58.68 |
|
|
30
min AOE |
51.65 |
54.22 |
58.87 |
|
|
40
min AOE |
64.65 |
69.70 |
74.70 |
|
|
50
min AOE |
56.63 |
61.72 |
66.72 |
|
|
60
min AOE |
53.72 |
58.72 |
63.70 |
|
|
Max
vs. Min |
134% |
141% |
128% |
|
Figure
5.18 - Travel Time vs. Departing Time from the
Bus
Garage (Centroid 2125) to Pick-up Point 2101
Figure 5.
19 - Travel Time vs. Departing Time
from
Pick-up Point 2101 to Exit Node 1.
Table 5.2
- En-route Travel Time as Function of Departing
Time from
Garage and Loading Time at Pick-up Point 2101
|
|
|
Loading
Time |
||
|
Bus
Departs at |
20
Min |
25
Min |
30
Min |
|
|
0
min AOE |
30.17 |
34.50 |
39.65 |
|
|
10
min AOE |
29.65 |
35.13 |
39.03 |
|
|
20
min AOE |
54.30 |
59.53 |
64.52 |
|
|
30
min AOE |
69.50 |
74.30 |
79.55 |
|
|
40
min AOE |
66.60 |
71.53 |
76.62 |
|
|
50
min AOE |
58.62 |
63.52 |
68.62 |
|
|
60
min AOE |
55.60 |
60.65 |
65.27 |
|
|
Max
vs. Min |
234% |
215% |
204% |
|
Figure
5.20 - Travel Time vs. Departing Time from
the Bus
Garage (Centroid 2125) to Pick-up Point 2049
Figure
5.21 - Travel Time vs. Departing Time
from
Pick-up Point 2049 to Exit Node 1.
Table 5.3
- En-route Travel Time as Function of Departing Time
from
Garage and Loading Time at Pick-up Point 2049
|
|
|
Loading
Time |
||
|
Bus
Departs at |
20
Min |
25
Min |
30
Min |
|
|
0
min AOE |
30.08 |
34.50 |
39.58 |
|
|
10
min AOE |
29.58 |
35.05 |
38.93 |
|
|
20
min AOE |
53.10 |
58.10 |
63.10 |
|
|
30
min AOE |
69.10 |
74.10 |
79.10 |
|
|
40
min AOE |
66.10 |
71.10 |
76.10 |
|
|
50
min AOE |
58.10 |
63.10 |
68.12 |
|
|
60
min AOE |
55.10 |
60.12 |
65.12 |
|
|
Max
vs. Min |
234% |
215% |
203% |
|
Summary of Findings
·
For
hurricane evacuations, the simulation model gave EETs of slightly over 9
hours. An analysis of the results
indicated the presence of congestion earlier in the evacuation on some of the
links in Elizabeth City (no congestion was observed at any time in
Louisburg). The introduction of reverse
lane strategy effectively eliminated the congestion and brought the simulated
results in line with expected evacuation times.
·
For
other type of disasters, such as a hazardous material spillover that would
release toxic gases into the atmosphere, the population reaction time is
shorter. The simulation model indicated EETs of 3 hours and 4 minutes for
Elizabeth City and 2 hours and 16 minutes for Louisburg. Elizabeth City, under these conditions,
showed severe congestion on some links.
Louisburg, however, showed only mild congestion on some of the links,
especially at the beginning of the evacuation.
·
Reverse
lane strategies alone were not able to dissipate the congestion in the latter
of the two cases. Therefore, a
combination of this type of traffic management approach and the deployment of
policemen to direct traffic at key intersections was studied. For Elizabeth City reverse lanes were
simulated on Halstead Boulevard and on West Ehringhaus Street. The policemen were deployed at the
intersections of South Hughes Boulevard and West Ehringhaus Street (node 13 on
Figure 5.1), Halstead Boulevard and West Ehringhaus Street (node 25), Hughes
Boulevard and Well Field Road (node 49), and Hughes Boulevard and US Highway
158 (node 57). With these traffic strategies
deployed, the simulation showed an EET of 2 hours 21 minutes (a decrease of
almost 25% in the evacuation time), with significant reductions in congestion.
·
For
Louisburg, a reverse lane strategy on US Highway 401 south bound was studied
along with the deployment of policemen at the intersections of US Highway 401
and State Route 561 (node 53 on Figure 5.2) and US Highway 401 and State Route
56 (node 49). With these traffic
strategies deployed, the congestion disappeared completely.
·
With
the use of buses for evacuation operations,
the results show generally that for loading times of 20, 25, and 30
minutes, the optimal departing times from the garage are at 10, 10, and 0
minutes AOE, respectively. The
simulation also shows that the worst time to depart is 40 minutes AOE. This represents an increase in en-route
travel time of 134%, 141%, and 128% for loading times of 20, 25, and 30
minutes, when compared to the optimal en-route times except for pick up points
2101 and 2049 that has the worst departure time of 30 minutes.