Table of Contents
Page
Table of Contents............................................................................................................... 2
List of Figures..................................................................................................................... 4
List of Tables...................................................................................................................... 8
Foreward/Notice................................................................................................................. 9
Acknowledgement............................................................................................................. 10
Executive Summary.......................................................................................................... 11
1.
Introduction.................................................................................................................. 12
2. Project Tasks............................................................................................................... 13
2.1 Materials and Product Forms Technology........................................................ 13
2.1.1 Long Fiber Thermoplastic (LFT) Extrusion Trial
Runs......................... 13
2.1.2.. Thermoplastic Composite Pellet and
Tape............................................ 16
2.1.3.. Woven Broadgoods................................................................................. 17
2.2 Processing Technology...................................................................................... 20
2.2.1 Vacuum Assisted Resin Transfer Molding............................................ 20
2.2.2 Processing Woven Thermoplastic Broadgoods...................................... 33
2.2.3.. Mechanical Testing Results................................................................... 41
2.2.3.1 Tensile Data on Compression-Molded Panels-Effects of Test
Sample Width........................................................................... 41
2.2.3.2 Polypropopylene/Glass Impact
Investigations-Gas Gun,
Falling Dart, and Izod
Tests.................................................... 42
2.2.3.3 SMA/Glass Mechanical Tests Results................................... 53
2.2.3.4 Polyurethane/Glass Panel Impact Results.............................. 55
2.2.4 Fire Safety of Flooring............................................................................ 55
2.3 Joining Studies................................................................................................... 59
2.3.1 Lap Shear Tests of Neat Polymer.......................................................... 59
2.3.2 Surface Roughness Effects on Joining................................................... 62
Table of Contents
Page
2.3.2.1.. Materials and Experimental Procedure.................................. 63
2.3.2.2.. Experimental Procedure for Surface
Roughness................... 63
2.3.3 Single-Lap Shear Tests........................................................................... 66
2.3.4 The Effect of Release Agent on Single-Lap Shear Strength................. 68
2.3.5 Lap Shear Testing of Ultrasonically Bonded Samples.......................... 69
2.3.6 Thermoplastic Joint Impact Tests.......................................................... 70
2.3.7 Joining Conclusions................................................................................. 73
2.4 Tooling Development.......................................................................................... 74
2.5 Design, Analysis, and Testing of Bus Flooring Module.................................... 82
2.5.1.. American Public Transportation
Association Floor Part
.......... Guidelines................................................................................................ 82
2.5.2.. Design Concepts..................................................................................... 88
2.5.2.1 Balsa Core and Face Sheets.................................................... 88
2.5.2.2 Sine Core Design..................................................................... 89
2.5.2.3 Isogrid Design Analysis........................................................... 91
2.5.2.4 Flattened Sine (Hat)................................................................. 93
2.5.2.5 Processing Consideration and Shape Efficiency..................... 98
2.5.3 Component Testing and Analysis......................................................... 108
3.
Future Work............................................................................................................... 123
References...................................................................................................................... 124
Appendix ........................................................................................................................ 125
Glossary and Abbreviations........................................................................................... 127
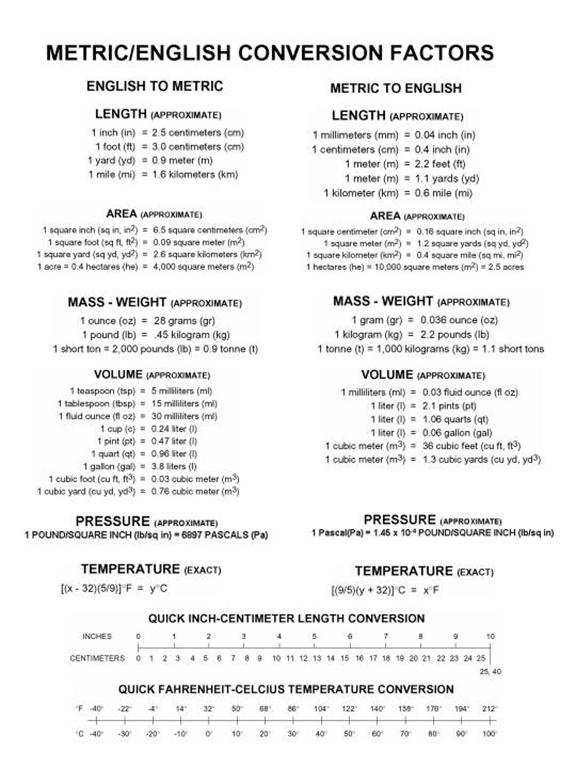
Metric Chart................................................................................................................... 129
List
of Figures
Figure Page
2.1.1-1 ..... Extrusion
Die with Heating Elements in Zones 1, 2, & 3 and Cooling Lines in Zone 4 13
2.1.1-2 ..... Extruded
PP/glass LFT................................................................................. 14
2.1.1-3 ..... Temperature Gradient across the
Extrusion Die
................... Heating/Cooling
Zones.................................................................................. 15
2.1.1-4 ..... Fiber
Condition after Flat Sheet Extrusion from Burn-out Sample............ 16
2.1.3-1 ..... Roll
of Woven Polypropoylene/E-glass Fabric............................................ 17
2.1.3-2 ..... Close-up
View of Woven Polypropylene/E-glass Fabric............................. 18
2.1.3-3....... Consolidated Sheet of Woven
Polypropylene/E-glass................................ 18
2.1.3-4....... Close-up of Consolidated Woven
Polypropylene/E-glass........................... 19
2.2.1-1....... Low Cost VARTM Processing..................................................................... 20
2.2.1-2 ..... Illustration
of FASTRAC Process for Rapid Processing............................ 22
2.2.1-3 ..... High
Temperature Set-up for Nylon VARTM Processing......................... 23
2.2.1-4 ..... The High Temperature Processing Set-up................................................... 24
2.2.1-5 ..... Various
Stages of Processing of FASTRAC Processing............................. 25
2.2.1-6 ..... Wet
Out Characteristics of Nylon to E-glass Fiber..................................... 26
2.2.1-7 ..... Carbon
Fiber Preform Bagged under Vacuum and Prepared for Insulation with Caprolactam 27
2.2.1-8 ..... Resin
Infusion of Caprolactam in Progress................................................. 28
2.2.1-9 ..... High
Temperature VARTM Set-up............................................................. 28
2.2.1-10 .... Details of Heating and Mixing Unit
for Caprolactam................................. 29
2.2.1-11 .... Scanning Electron Micrograph Showing
Cross-Section and Wet-out of Nylon/Carbon Composite Plate Processed under VARTM
(2500 X)................................................... 30
2.2.1-12 .... Scanning Electron Micrograph Showing
Cross-Section and Wet-out of Nylon/Carbon Composite Plate Processed under VARTM
(8000 X)................................................... 30
2.2.1-13 .... Scanning Electron Micrograph Showing
a Section Parallel to the Fibers and the Wet-out of Nylon to E-glass Composite
Plate Processed under VARTM (2500 X)................... 31
2.2.1-14 .... Different Scanning Calorimetry
Comparison of Commercial Nylon (upper panel) and Nylon Produced with VARTM
Process................................................................................... 32
2.2.2-1 ..... Roll
of Woven Polypropylene/E-glass Fabric.............................................. 34
2.2.2-2 ..... Close-up
view of Woven Polypropylene/E-glass Fabric.............................. 34
2.2.2-3 ..... Consolidated
Sheet of Woven Polypropylene/E-glass Fabric..................... 35
2.2.2-4 ..... Close-up
of Consolidated Woven Polypropylene/E-glass Fabric................ 35
2.2.2-5 ..... Loom
Weaving Thermoplastic Prepeg......................................................... 36
2.2.2-6 ..... Take-up
Accumulator for Woven Prepeg Fabric......................................... 37
2.2.2-7 ..... Schematic
of Double Belt Press................................................................... 37
2.2.2-8 ..... Aluminum
Mold Half Showing Inserted Cartridge Heaters....................... 38
2.2.2-9 ..... Mold
Prepared for Vacuum Bag Thermoforming........................................ 39
2.2.2-10 .. Preparation
for Part Bonding with Low Melt Adhesive.............................. 40
2.2.2-11 .. Placement
of Secondary Part of Flooring Subcomponent to be Adhesively Bonded 40
List
of Figures
Figure Page
2.2.3.1-1 .. Ultimate
Tensile Strength as a Function of Specimen Width and Orientation 41
2.2.3.1-2 .. Modulus
as a Function of Specimen Width and Orientation....................... 42
2.2.3.2-1 .. Typical
Force-Time-Energy Curve for LVI of LFT Glass/PP Plate........... 44
2.2.3.2-2 .. LVI
to LFT Glass/PP Plate, Impact Side and Tensile Side............................. 45
2.2.3.2-3 .. LVI
to LFT Glass/PP Plate, Fracture Path and Fiber Pull-out........................ 46
2.2.3.2-4 .. Gas
Gun Test Apparatus.............................................................................. 46
2.2.3.2-5 .. Energy
Absorption vs. Areal Density for Three Samples........................... 47
2.2.3.2-6.... Sample 020919-1-38b Showing IVBOI
without Penetration....................... 47
2.2.3.2-7.... Sample
020919-1-33b Showing IVBOI without Penetration....................... 48
2.2.3.2-8 .. Sample 020919-1-01b Showing IVBOI with Penetration............................. 48
2.2.3.2-9 ... Sample 020919-1-65b High-Speed Image of the
Onset of Damage........... 49
2.2.3.2-10 Sample
020919-1-65b High-Speed Image Showing the Perforation of the Sample 49
2.2.3.2-11 Sample
020919-1-34b Impacted with a 100g (38.1mm f) /sabot at 53.1 m/s 50
2.2.3.2-12 SEM Normal to the Fracture Surface of
Sample 020919-1-34b Showing Fiber Pullout, Matrix Crazing, and Fiber Fracture.......................................................................... 51
2.2.3.2-13.. SEM
Normal to the Fracture Surface Showing Fiber Pullout, Matrix Crazing, and Fiber
Fracture 51
2.2.3.2-14.. SEM
Normal to the Fracture Surface of Sample 020919-1-39b after an IVBOI Test 52
2.2.4-1....... Critical
Points of Flame Retardancy Function............................................. 56
2.2.4-2....... Several
Flame Retardants and Respective Modes of Operation.............. 56
2.2.4-3....... Sample
of 40 Weight Percent Glass Composite without Flame Retardant after Dynatup
Impact Testing........................................................................................................... 57
2.2.4-4....... Sample
of 40 Weight Percent Glass Composite without Exolit AP751 after Dynatup Impact
Testing........................................................................................................................ 58
2.3.2.2-1.... Unsealed
Example of Surface Roughness Amplitude................................. 64
2.3.2.2-2.... Surface
Roughness Profiles of FRP (with Medium Vf)............................... 65
2.3.5-1....... Schematic
of Ultrasonic Welding Instrument.............................................. 69
2.3.5-2....... Comparison
of Single-Lap Shear Strength of FRP/FRP Bonded by Adhesive DP 8005 and
Ultrasonic Welding.......................................................................................................... 70
2.3.6-1....... The Schematic of the Samples for LVI Test................................................ 72
2.3.6-2....... Comparison
of Impact Resistance of Bonded Samples.............................. 73
2.4-1 ......... Assembly
Drawing of the Die with the four Heating Zones Noted............. 74
2.4-2.......... Bottom
Die Assembly (Cavity Visible)........................................................ 75
2.4-3.......... Solid
Model of Identical Parts A and B....................................................... 75
2.4-4.......... Dimensions
of Identical Parts A and B........................................................ 76
2.4-5.......... Solid
Model of Parts C and D....................................................................... 76
2.4-6.......... Dimensions
of Parts C and D....................................................................... 77
List
of Figures
Figure Page
2.4-7.......... Cross-section
View Showing Thermocouple Wells and Heater Holes....... 77
2.4-8.......... Placement
of Heating/Cooling Channels in Part C and D........................... 78
2.4-9.......... Picture
of Part A of Extrusion Die During Fabrication............................... 79
2.4-10........ Drawing
of the Bus Floor Subcomponent Design........................................ 80
2.4-11........ Line
Drawing of Part and Tool for Bus Flooring Subcomponent................ 81
2.4-12........ Exploded
View of Tooling Design Including Steel Shim and Part.............. 81
2.4-13........ Inverted
Exploded View of Tooling and Part............................................... 82
2.5.1-1....... NABI
Conventional Bus Floor..................................................................... 84
2.5.1-2....... Close-up
of Conventional Bus Floor............................................................ 85
2.5.1-3....... Steel
and Plywood Floor used on Conventional Bus Floor.......................... 86
2.5.1-4....... Unit
Cell of Conventional Bus Floor............................................................ 86
2.5.1-5....... Dynamic
Modes of Typical Bus Structure................................................... 87
2.5.2.1-1.... Carbon/Nylon
(VARTM) Sandwich Composite with Balsa Core............... 88
2.5.2.1-2.... Glass/polypropylene
(Thermoformed, extruded) Sandwich
Composite with Balsa Core 88
2.5.2.1-3.... Stress
Development Balsa/Glass Sandwich Composite.............................. 89
2.5.2.2-1.... General
Concept of Sine Wave and Deck Plate Bus Floor Design............ 90
2.5.2.2-2.... Definition
of Dimension for Sine Wave Panel............................................. 90
2.5.2.2-3.... Illustration
of Composite Layup................................................................... 90
2.5.2.2-4.... Deflection vs. Wavelength for the
Sine Model........................................... 91
2.5.2.3-1.... Isogrid
Panel Design Elements.................................................................... 92
2.5.2.3-2.... Isogrid
Panel Design Parameters................................................................. 92
2.5.2.4-1.... General Schematic of Flattened Sine
Structure.......................................... 93
2.5.2.4-2.... Illustration of Design Parameters
that can be Optimized........................... 93
2.5.2.4-3.... Schematic Model of Flattened Sine
Layup Sequence................................. 93
2.5.2.4-4.... Comparison of Maximum Deflection for
Sine-Hat Models as a Function
................... of
Height, Wavelength, and Contact Distance............................................ 94
2.5.2.4-5.... Comparison of Maximum Stress for
Several Sine-Hat Models as a
................... Function of Height, Wavelength, and Contact
Distance............................ 95
2.5.2.4-6.... Principal Stresses Distribution for
Sine-Hat 6............................................. 95
2.5.2.4-7.... Principal Stresses Distribution for
Sine-Hat 10........................................... 96
2.5.2.4-8.... Dimensions for Model Sine-Hat 6................................................................ 96
2.5.2.4-9.... Dimensions for Model Sine-Hat 10.............................................................. 97
2.5.2.5-1.... Shape Efficiency of Hat Stiffened
Structures (Budiansky et al, 1990)....... 98
2.5.2.5-2.... Concept Modified Sine-Hat Stiffened
Floor Part........................................ 99
2.5.2.5-3.... Parameters of the Sine Rib Structure
Studied for ANSYS....................... 100
2.5.2.5-4.... Details of Shell 99 Element used in
ANSYS.............................................. 101
2.5.2.5-5.... Laminate Sequence for Face and Rib
Plies-Woven Fabric Idealized as Cross-Ply 101
2.5.2.5-6.... Meshed Modified Sine-Hat Stiffened Floor Unit
Cell.............................. 102
2.5.2.5-7.... Boundary Conditions used in
Analysis-Simple Supported on Two Edges and Fully Fixed 103
List
of Figures
Figure Page
2.5.2.5-8.... Loading Conditions on Floor Unit
Cell....................................................... 104
2.5.2.5-9.... Stress and Deflection Profile for
6mm Face.............................................. 105
2.5.2.5-10.. Stress and Deflection Profile for 6mm
Face.............................................. 106
2.5.2.5-11.. Stress and Deflection Profile for 9mm
Face.............................................. 106
2.5.2.5-12.. Stress and Deflection Profile for 9mm
Face.............................................. 107
2.5.2.5-13.. Stress and Deflection Profile for 9mm
Face.............................................. 107
2.5.3-1....... Detailed Drawing and Finished
Part.......................................................... 109
2.5.3-2....... Component Testing-Load Frame and
Part Close-up Showing Support Frame 110
2.5.3-3....... Additional Component Test
Details, LVDT, and Load Frame................. 111
2.5.3-4....... Load-Deflection Curves Tested
Samples.................................................. 112
2.5.3-5....... Conventional Floor-Details of
Unit Cell and Cross0Section of the Three Major Elements 114
2.5.3-6....... Flattened Sine Composite Floor
Design.................................................... 115
2.5.3-7....... Details of Plywood and Welded
Frame Structure (Major Section of Conventional Floor 116
2.5.3-8....... Details of Sine-Hat Stiffened
Floor (Major Section of
Composite Floor 117
2.5.3-9....... Deflection Analysis Assuming Unit
Cell is Extended across Entire Width
................... of
the Floor.................................................................................................. 118
2.5.3-10..... Modularization Concept of Composite
Unit Cells making up Floor Structure 119
2.5.3-11..... Modularization Concept of Composite
Unit Cells making up Floor Structure, and Extending across Entire Width................................................................................................ 120
2.5.3-12..... Modularization Concept in
Longitudinal Directional, Incorporating Wires and Rod Routing 121
2.5.3-13..... Modularization Concept in
Longitudinal Directional, Incorporating Foam Filling for Sound and Vibration
Damping....................................................................................................... 121
2.5.3-14..... Modularization Concept in Integrating
Upper Frame Skeleton to Continue through Bottom Floor 122
List of Tables
Table Page
2.1.1-1 ..... Extrusion
Die Channels and Zones used for the First Two Trial Runs...... 14
2.1.2-1 ..... Additional
Combinations of Resin and Fiber for Thermoplastic Composite Applications................... 17
2.2.1-1 ..... Summary
of Mechanical Tests on Carbon/Nylon Composite made by VARTM Process................... 33
2.2.3.2-1 .. Summary
of Falling Dart Impact Tests for Polypropylene/Glass............... 45
2.2.3.2-2 .. Intermediate
Velocity Tests on Polypropylene/Glass Panels..................... 50
2.2.3.2-3 .. Low
Velocity Impact Tests on Polypropylene/Glass Panels....................... 53
2.2.3.3-1 .. Unidirectional
SMA/glass Fiber Tensile Properties.................................... 53
2.2.3.3-2 .. Random
Fiber SMA/glass Tensile Properties-Longitudinal
................... Orientation..................................................................................................... 54
2.2.3.3-3 ... Random Fiber SMA/glass Tensile
Properties-Transverse
................... Orientation..................................................................................................... 54
2.2.3.3-4 ........................................... Low
Velocity Impact Data-SMA Random Panels...................................... 54
2.2.3.4-1.... Polyurethane/Glass Panel Impact
Results................................................... 55
2.2.4-1....... Flame Spread and Smoke Testing
Results.................................................. 58
2.3.1-1....... Adhesive Candidates and Manufacturers................................................... 60
2.3.1-2....... Single-Lap Shear Strength of
PP-PP............................................................ 61
2.3.1-3....... Single-Lap Shear Strength of PA-PA........................................................... 61
2.3.1-4....... Single-Lap Shear Strength of
PBT-PBT...................................................... 62
2.3.2.1-1.... Adhesive Candidates.................................................................................... 63
2.3.2.2-1.... Surface Roughness of Different
Substrates before and after Surface Treatment............................... 64
2.3.3-1....... Single-Lap
Shear Strength of PP/PP, PBT/PBT, and PA/PA...................... 66
2.3.3-2....... Single-Lap
Shear Strength of Bonding of Dissimilar Polymers.................. 67
2.3.3-3....... Single-Lap
Shear Strength of FRP/FRP Bonded by DP8005..................... 67
2.3.4-1....... Shear
Strength Comparison with and without Release Agent.................... 68
2.3.5-1....... Effect
of Welding Setting on Shear Strength and Failure Mode of FRP/FRP...................................... 70
2.3.6-1....... Gas
Gun Impact Test Results of Adhesively Bonded Samples.................. 71
2.5.2.2-1.... Parameter Combinations for Various
Sine Models..................................... 90
2.5.2.3-1.... Parameter Combinations for Several
Isogrid Models................................ 92
2.5.2.4-1.... List of Flattened Sine Ribbing
Variations.................................................... 94
2.5.2.5-1.... Parameters of the Sine-Hat Studied
for ANSYS Analysis........................ 100
2.5.2.5-2.... Material Properties for
Glass/Polypropylene used in Analysis................ 105
2.5.2.5-3.... Loading, Boundary Conditions,
Maximum Deflection and Maximum Stress........... 108
2.5.3-1....... Conventional Floor Unit Cell
Weight Calculations.................................... 113
2.5.3-2....... Composite Floor Weight
Calculation......................................................... 116
2.5.3-3....... Weight Calculations for Major
Section of Conventional Floor................. 117
2.5.3-4....... Weight Calculations for Major
Section of Floor made from Sine-Hat Stiffened Composite 117
Foreward
This component describes steps
required to apply the technology of long fiber and continuous woven
thermoplastic composites in transit bus flooring applications for the
Department of Transportation and the Federal Transit Administration. The goals of improved safety, reduced weight,
and lower cost are very important to the transportation industry. This report describes the design guidelines
and fabrication methods related to the thermoforming of long-fiber
thermoplastic composite flooring for transit bus application.
Notice
This document is disseminated
under the sponsorship of the U.S. Department of Transportation in the interest
of information exchange. The United
States Government assumes no liability for its contents or use thereof.
The United States Government does
not endorse manufacturers or products. Trade names appear in the document only
because they are essential to the content of the report.
Acknowledgment
The authors wish to express their
appreciation to the Federal Transit
Administration for the support of this work.
We thank the C.A. Lawton Company for the use of their plastication
equipment and North American Bus Industries for their guidance in component
selection and design guidelines. We
acknowledge the following for their contributions to the technical effort of
this project: George Husman, Tim
Hartness, Uday Vaidya, Greg Janowski, Krish Chawla, Joel Dyksterhouse, Patric
Moriarty, Mike Dyksterhouse, Andy Grabany, Chad Ulven, Shane Bartus, and Brian
Pillay. We acknowledge and thank Lisa
White for her assistance with the preparation of reports.
Executive Summary
The primary work addressed during
this project was directed at the design, fabrication and testing of a bus floor
subcomponent. The principal objectives
associated with the bus floor project were safety, weight, and cost.
The primary safety issue
(excluding the sufficiency of the structure) is flammability and smoke
generation during potential fire incidents.
The use of topically applied fire retardant coatings appears to present
the best solution to mitigating flame spread and smoke production. The high percentage of fiberglass content (60
percent by weight) reduces the polymer available as potential fuel for a
fire. Discussions are ongoing with a
fire retardant supplier to optimize the use of surface-coated retardants to a
bus floor application.
The bus floor design and
prototype subcomponent saves an estimated 40 percent in weight using
polypropylene and E-glass as reinforcement fiber. The design was based on a flat panel bonded
to a flattened sine wave rib structure.
The design was sufficient to meet American Public Transportation Association (APTA) deflection
standards under maximum loading conditions.
It is expected that the integration of the floor with a sidewall and
frame design will likely yield additional weight savings and performance
improvements.
The prototype design saved
approximately 40 percent in cost.
Material cost savings are in excess of 50 percent. In addition to the basic cost advantage, the
lifetime of the floor is equal to the expected lifetime of the bus itself; that
is, about 12 years. Normal plywood based
floors are often replaced after about 6 years due to rotting caused by water
exposure. The replacement cost and
downtime would also be a savings, but was not calculated as part of this
analysis.
It is anticipated that further
development will be performed with a focus on integrating frame, sidewalls and
flooring. This system integration is
necessary to provide the best mechanical performance with the lightest weight
and lowest cost.
1. Introduction
The Federal Transit
Administration (FTA) has encouraged innovative technologies to be implemented
in mass transit applications, particularly when improvements in performance,
cost, weight reduction, or safety may be realized. The results of efforts made by Southern
Research Institute under FTA Project AL-26-7001-01 were directed to the
fabrication woven prepreg thermoplastic composite bus flooring subcomponents
with demonstration of several contributing technologies. The
previous Phase 1 effort was focused on material production and compression
molding fabrication methods. In the
Phase 1 work, a two-person bus seat was molded in one piece. This design yielded a 40 percent cost savings
and 30 percent weight reduction for a typical transit bus seat.
The choice of bus flooring as the
test subcomponent was based on the desire to fabricate a large-area,
weight-bearing structure that would potentially save considerable weight. Bus frame and side panels were also
considered; however, it was felt that the consideration of frame and side
panels should be handled in a more comprehensive future study in which the
surface finish of the side panels and the complex loading of the frame could be
properly addressed with an integrated design of flooring, frame and
panels. Primary considerations for the
flooring application were safety, weight savings to reduce fuel consumption,
and cost savings to encourage usage in commercial applications. The choice of bus flooring as a thermoplastic
composite application goal was the result of consideration of overall weight
reduction calculations for several candidate bus components. The primary selection issue was based on the
total weight of flooring installed on a standard transit bus as well as the
potential increase in functional lifetime over conventional flooring structures. Design, fabrication, and mechanical testing
of the flooring subcomponent are described in the following report.
2. Project Tasks
2.1 Materials and Product Forms Technology
2.1.1 Long Fiber Thermoplastic (LFT) Extrusion
Trial Runs
Two sets of extrusion trials were
executed with polypropylene/Glass (PP/Glass) LFT using a Southern Research
Institute (SRI) plasticator and an extrusion die fabricated at the University
of Alabama at Birmingham (UAB)
Physics Department machine shop.
Temporary modifications were made to the plasticator that allowed
continuous flow of PP/Glass LFT melt in an extruder-like mode. The processing parameters recorded during the
first two trial runs provided information defining a processing envelope for
the extrusion of PP/Glass LFT.
The die is composed of four parts
and a flange that are bolted together and then connected to the
plasticator. There are 18 dual purpose
through-channels on the top and bottom halves of the die for heat cartridges or
cooling lines (Figure 2.1.1-1). The
temperature of each of the four heating zones is maintained by an independent
temperature controller. Thermocouples
imbedded in the die provide each controller with precise temperature
measurement. The temperature of the
cooling lines was maintained with a remote water or oil cooling unit. The connecting flange to the plasticator is
not supplied with a heat source, but is well insulated and maintains a constant
temperature by conduction from adjacent zones and by convection of material
through it. The heating/cooling channels
are at a constant distance of 10 mm from the cavity wall. The distance between channels is 38mm from
center to center of the holes. Table
2.1.1-1 illustrates the channels used for the first two trial runs and the particular
heating and cooling zones adopted.
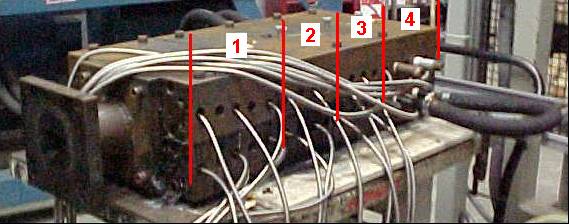
Figure 2.1.1-1 Extrusion Die with Heating Elements in Zones
1, 2, & 3 and Cooling Lines in Zone 4
Table 2.1.1-1 Extrusion Die Channels and Zones used
for the First Two Trial Runs
During the first trial run,
temperature of each zone was maintained at 232° C (Figure 2.1.1-1). The temperature maintained was higher than
the minimum melt temperature of the material.
This initial run demonstrated successful flow of PP/Glass LFT melt
through the die transition and into the rectangular die cavity shape (Figure
2.1.1-2). Material was permitted to flow
out of the die and into a cool water bath.
This initial trial run proved the feasibility process and provided process
temperature information to define the upper bound of the extrusion-processing
envelope.
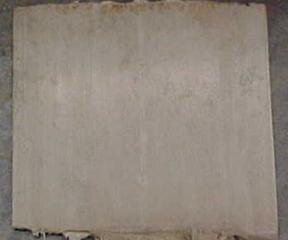
Figure 2.1.1-2 Extruded PP/glass LFT
During the second trial run, the
temperature of each zone was adjusted to create a gradient along the length of
the die (Figure 2.1.1-3). The
temperature in Zone 4 (the exit zone) of the die was maintained with
water-cooling lines at 83° C, well below the melt temperature of PP/glass
LFT. The material leaving the die was
solidified in the shape of the die opening.
The low temperature in Zone 4 resulted in a very rapid melt
solidification that created a higher than desired backpressure in the
plasticator. The high backpressure
precluded a continuous process with this process configuration. The second trial run provided temperature
information for each zone that defined a lower bound of the
extrusion-processing process temperature envelope.
Figure 2.1.1-3 Temperature
Gradient across the
Extrusion Die Heating/Cooling Zones
With information
obtained from the first two extrusion trial runs, an approximate processing
envelope was defined.
Extrusion trials were conducted
with several feedstock approaches. The
initial feedstock was neat polymer BP/Amoco 9965. A mix of 50% 9965 and 50% Ticona pellet (40%
glass fiber) was tried next, followed by 100% Ticona 25.4 mm pellet. All systems were polypropylene/E-glass
combinations.
The best performance was obtained
with the 40% fiber since the effective viscosity was much higher than the neat
resin. The primary difficulty was that
the rate of flow of material and simultaneous maintenance of extrusion pressure
is neither linear nor constant. This
condition makes it very difficult to extrude anything other than short
discontinuous pieces and these with poor quality. A puller was used to assist with the panel
extrusion; however, the extrusion rate control and the force available on the
puller precluded production of a significant quantity of random fiber panel. The continuous production of random fiber
composite panels by extrusion appears promising, but additional equipment and
effort is required to achieve commercially acceptable panels. Samples of the panel were placed in an
air-atmosphere oven at 575° C to burn out the polymer matrix leaving the
fibers. Figure 2.1.1-4 shows the burnout
results from the extrusion panel that shows that the 25mm original fibers are
still intact after processing.
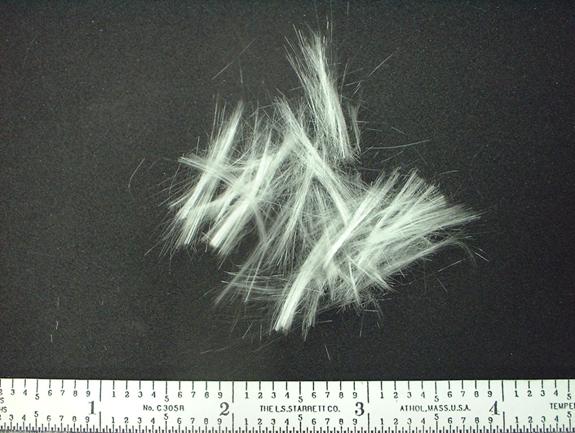
Figure 2.1.1-4
Fiber Condition after Flat Sheet Extrusion from Burn-out Sample
2.1.2 Thermoplastic Composite Pellet and Tape
Two additional polymers were used
to impregnate E-glass roving. These two
polymers were thermoplastic polyurethane, Pearlthane D11T75 (TPU) and modified
styrene SMA, Dylark 238. Tape products
were made from both materials and 25.4 mm pellets were made from the SMA
resin. Processing temperature for the
SMA was 250° C. Several hundred pounds
of the SMA pellets were produced for compression molding trials described in Section
2.2
Several different forms of
pellets and tape were produced to investigate potentially useful combinations
of E-glass and resins for transportation application. Table 2.1.2-1 lists several new forms and
possible application areas.
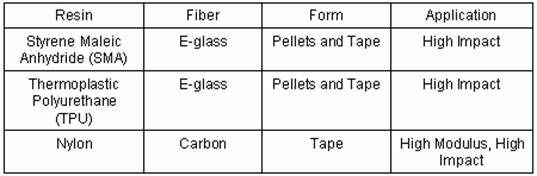
Table 2.1.2-1 Additional
Combinations of Resin and Fiber for Thermoplastic Composite Applications
Some of these materials have been
processed into panels and tested.
Testing results are in Section 2.2 of this report.
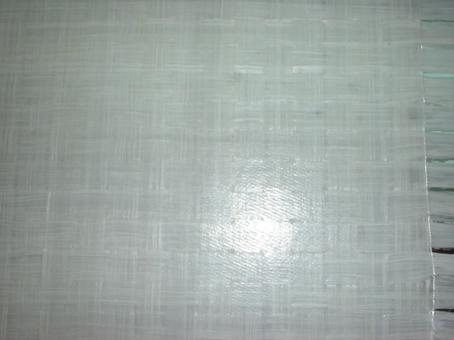
2.1.3 Woven Broadgoods
Polypropylene/E-glass tape was
produced in a 12.7mm width and then woven in to a fabric as shown in Figure
2.1.3-1. This material is about 1 meter
wide. A close-up view is shown in
Figure 2.1.3-2.
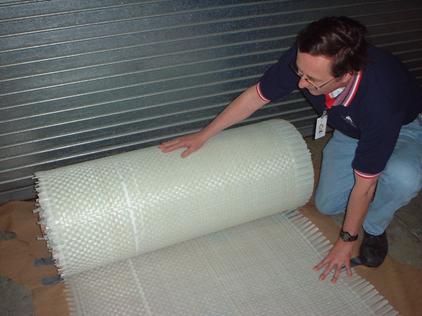
Figure
2.1.3-1 Roll of Woven
Polypropylene/E-glass Fabric
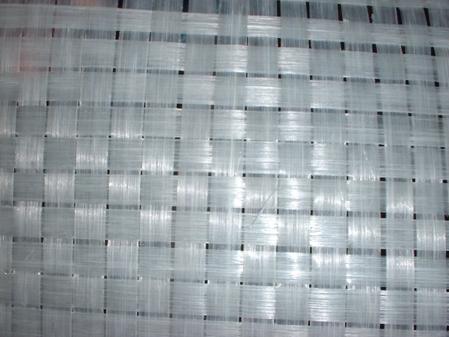
Figure
2.1.3-2 Close-up View of Woven
Polypropylene/E-glass Fabric
The woven fabric was processed in
a heated double belt press that consolidated the raw woven fabric into a dense
composite. A sheet of that material is
shown in Figure 2.1.3-3.
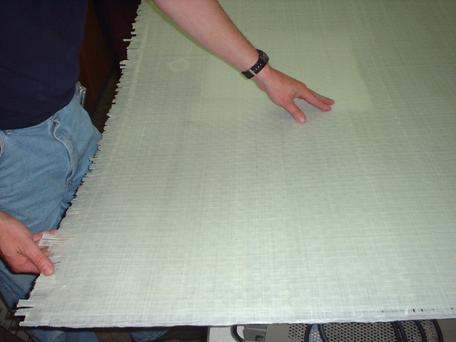
Figure
2.1.3-3 Consolidated Sheet of Woven
Polypropylene/E-glass
A close-up of the same material
is shown in Figure 2.1.3-4. The
consolidated forms can be used as-is as structural panels or can be
additionally formed in standard thermoforming operations.
Figure
2.1.3-4 Close-up of Consolidated Woven
Polypropylene/E-glass
The woven material can be vacuum
bagged, autoclaved or consolidated in a double belt press. The prototype bus floor subcomponent was
fabricated by vacuum bagging from this woven form of thermoplastic composite
material.
2.2 Processing Technology
A primary objective in the second
year of this effort for the Federal Transit Administration is the demonstration
of low-cost processing technologies for large-area transportation parts. Processes
discussed in the following sections included Vacuum Assisted Resin Transfer
Molding, thermoforming of woven broad goods,
and belt press consolidation of woven broad goods. Mechanical properties
of processed samples materials are presented.
2.2.1 Vacuum Assisted Resin
Transfer Molding
Recent developments in composites
processing methods have focused on cost-effectiveness and ability to produce
integrated structures using liquid molding techniques. Vacuum assisted resin transfer molding
(VARTM) has emerged as a leading cost-effective process that utilizes
innovative developments in one-sided tooling and vacuum-bag technology. VARTM is cost-effective because it eliminates
much of the tooling costs associated with high temperature and pressure cycle
operations incurred in an autoclave process environment. This process is a very attractive alternative
to spray-up or impregnation methods, and is far less expensive than
conventional manufacturing methods for production of a relatively small number
of parts, that is, less than 10,000/year. The VARTM process may be reduced to a
simple single-sided tooling that requires only consumables in place of
expensive molds. During the VARTM
process, resin is infused into dry fabric preform placed in single-sided
tooling that covered with an inexpensive vacuum bag film as illustrated in
Figure 2.2.1-1.

Figure 2.2.1-1 Low Cost VARTM
Processing
A distribution mesh aids in
distributing the resin evenly over the fiber preform. Large structural parts with inserts or
multiple layers can be produced rapidly.
In multi-layered constructions, the VARTM process can be effectively
utilized to produce parts by co-injecting resin to cause simultaneous part
wet-out. Other advantages of VARTM are
low process volatile emissions, higher fiber-to-resin ratios and good
repeatability. While most studies have
considered VARTM for thermoset type systems, similar processing of
thermoplastics has been limited to their inherently high viscosity. For VARTM to work successfully, the resin
must lie in the 100-500 cps viscosity range.
In the present work we are developing research thrust in VARTM
processing of thermoplastic composites.
To our knowledge, this will be a pioneering effort if proven successful
and will enable integrated processing of large flat shapes, as well as preform
with integrated joints. For
transportation applications, this can be used to rapidly manufacture floor
structures, large side panels and roof structures.
The objective of this work was to
enhance speed of processing to accommodate the narrow processing window for the
polymerization of thermoplastic resin systems.
Most thermoplastic resin precursors have a high viscosity (>1000
centipoise) and a very short working time. The normal VARTM process using a
distribution mesh cannot be used for thermoplastics because of the high
temperature requirement and poor surface finish.
The process has been developed by
the Army Research Laboratory for thermoset vinyl ester family of resins to
produce structures such as armored vehicle hulls. Some benefits are reduction
of scrap and 100% compatibility with current ground vehicle processing
methods.
A cross section of the process is
shown in Figure 2.2.1-2. The idea is to set a double vacuum bag. The top bag covers a channeled tool which is
placed over the bottom bag that holds the plies under vacuum. Applying a vacuum
between the two bagging materials causes the bag at the top surface of the
plies to be pulled towards the channeling of the tool. This causes channels
wide enough for the resin to race through. Once the resin reaches eighty
percent of the distance of infusion, the
channeled tool and the top bagging is removed. The vacuum now pulls the bagging
tight over the plies helping to wet out the plies. This process provides significant time
efficiency and ability to produce/process very large flat shapes. Figure
2.2.1-3 shows the setup for Nylon VARTM processing and Figure 2.2.1-4 shows
high temperature processing VARTM setup.
Figure 2.2.1-2 Illustration of
FASTRAC Process for Rapid Processing
Figure 2.2.1-3
High Temperature Set-up for Nylon VARTM Processing
Figure 2.2.1-4 The High Temperature Processing Set-up
The FASTRAC processing system has been successfully
implemented using higher viscosity thermoset resins, with very short gel times.
We optimized the spacing and dimensions of the channels for use in reactive
Nylon 6 resin.
The candidate thermoplastic
resins Nylon 6 and cyclic polybutylene terephthalate (c-PBT) polymerize at
temperatures of between 100 to 200° C.
Therefore, a controlled high temperature processing set-up for VARTM was
developed that addressed the issue of moisture sensitivity during the
polymerization. The actual trials were
conducted with the Nylon 6 system due to the very high cost of the c-PBT precursor
system.
A high temperature-processing
table for VARTM was developed using an industrial scale grill. The tool surface is heated using four
electric elements at 20kw. A 10mm aluminum plate, wired with thermocouples was
fixed to the top of the grill. This permitted uniform heating and accurate
temperature measurement of the tool surface. Tool surface temperatures of up to
230° C were achieved. An intelligent
control system was developed to achieve better temperature consistency. A display of the high temperature-processing
table and resin flow paths are shown in Figure 2.2.1-5. An example resin wet-out of Nylon 6 on
E-glass fabric was demonstrated and illustrated in Figure 2.2.1-6. This particular demonstration shows that large
structures can be fabricated with this technique.
Figure 2.2.1-5
Various Stages of Processing of FASTRAC Processing
(a) Bagged preform, showing
infusion channels, and
(b) Flow of resin through the channels
Figure 2.2.1-6 Wet Out Characteristics of
Nylon to E-Glass Fiber
The Nylon 6 system under
evaluation consists of caprolactam monomer using Brüggolen C10 catalyst and
Brüggolen C20 activator (Brüggemann Chemical U.S., Inc.
Newtown Square, PA). The manufacturer’s
guide specified using 1.2% to 3% catalyst and 1.0% to 2.5% activator in an
inert atmosphere. Success was achieved
with carbon fabric using the following process:
·
Teflon tubing was slit and used for resin
distribution over the width of the preform.
·
Layers of 210 x 210mm de-sized (acetone
extraction) woven carbon fabric was used in the lay-up.
·
The woven carbon preform was vacuum bagged on a
heated processing table. High temperature bagging materials and sealant tape
were used to seal the preform.
·
The caprolactam (200g) plus activator (3g) was
heated at 75° C in an oil bath until it reached a fully liquid state. The
solution was continuously agitated using a mechanical stirrer.
·
When the entire solution was in a liquid form,
the catalyst (6g) was added to the solution.
·
Dry nitrogen was used to continuously purge the
system to prevent any moisture from getting into the flask.
·
The carbon lay-up was heated to 120° C and
purged using dry nitrogen.
·
The resin was then infused into the preform.
·
After the resin filled the
perform, the temperature of the heated table was raised to 150° C to
complete the polymerization.
Figures 2.2.1-7 through 2.2.1-10
illustrate the VARTM process with carbon cloth reinforcement.
The primary needs in a stable
Nylon VARTM process are uniform process temperature and moisture-free
atmosphere in all stages of the process.
Deviations in either of these areas will result in poorly polymerized
product and difficulty with uniform resin infusion.
Figure 2.2.1-7 Carbon Fiber
Preform Bagged under Vacuum and
Prepared for Infusion with Caprolactam
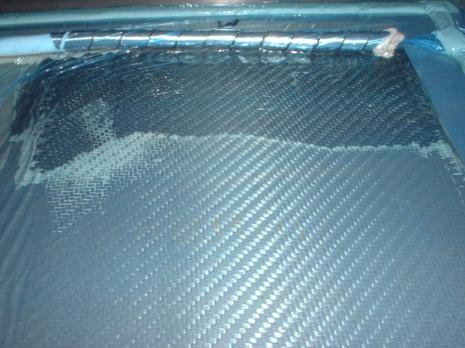
Figure 2.2.1-8 Resin Infusion of Caprolactam in Progress
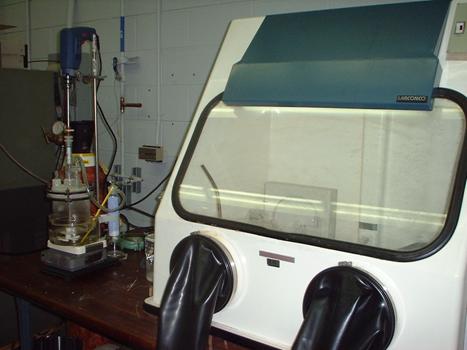
Figure 2.2.1-9 High Temperature VARTM Set-up
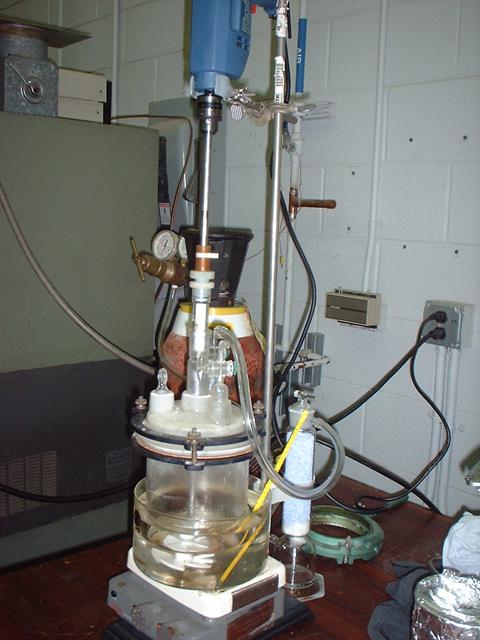
Figure 2.2.1-10 Details of Heating and Mixing Unit for
Caprolactam
Figures 2.2.1-11 through 2.2.1-13
show high magnification cross-sections perpendicular and parallel to the fibers
that illustrate that adequate wet-out throughout-the-thickness was obtained
during the VARTM process. Some
filament level voids were observed typical of the microstructure developed
during a VARTM process.
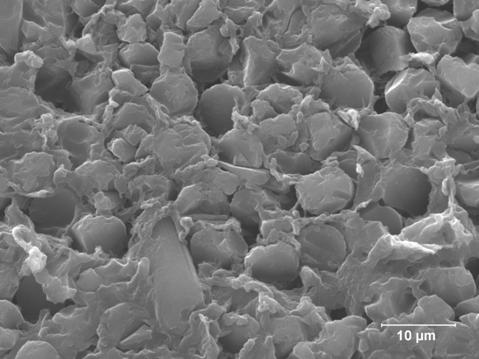
Figure 2.2.1-11 Scanning
Electron Micrograph Showing Cross-Section and Wet-out of Nylon/Carbon Composite
Plate Processed under VARTM (2500 X)
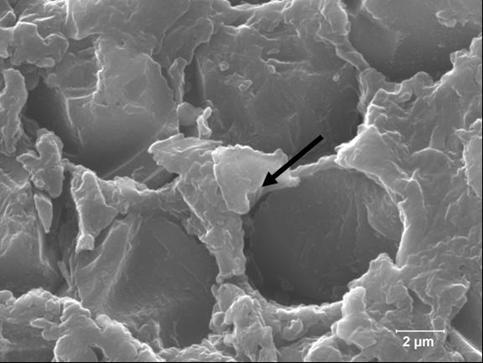
Figure 2.2.1-12 Scanning
Electron Micrograph Showing Cross-Section and Wet-Out of Nylon/Carbon Composite
Plate Processed Under VARTM (8000 X)
Arrow Shows Areas of Highly Crystallized Nylon
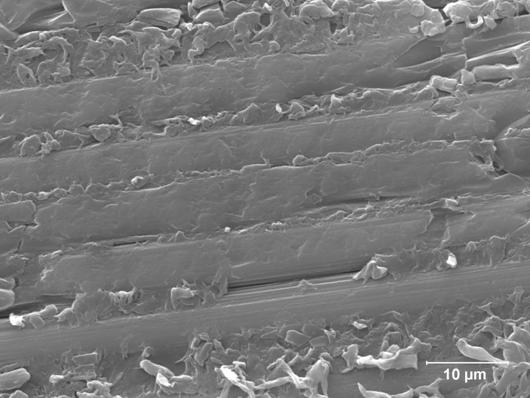
Figure 2.2.1-13 Scanning
Electron Micrograph Showing a Section Parallel to the Fibers and the Wet-Out of
Nylon to E-Glass Composite Plate Processed Under VARTM (2500 X)
Additionally, Figure 2.2.1-14
shows the contrast of the two differential scanning calorimetry (DSC) runs
comparing a commercial grade of Nylon and the Nylon produced by the VARTM
process. The narrower peak of the VARTM
process indicates narrower molecular weight distribution and higher
crystallinity.
Figure 2.2.1-14 Differential
Scanning Calorimetry Comparison of Commercial Nylon (upper Panel) and Nylon
Produced with VARTM Process
Mechanical testing data have been
generated on the Carbon/Nylon VARTM process.
The carbon fiber content of this test sample was 66 percent by weight
and 50 percent by volume. Table 2.2.1-1
summarizes the tensile and falling dart impart data.
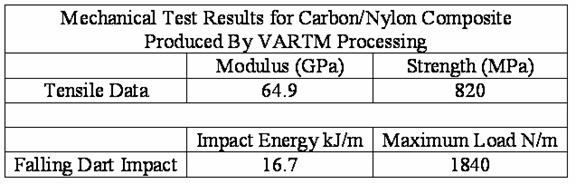
Table 2.2.1-1
Summary of Mechanical Tests on Carbon/Nylon Composite made by
VARTM Process
The mechanical properties of the
carbon/nylon composite are encouraging for practical use. The tensile modulus and strength were close
to theoretical for a two dimensional orthotropic carbon composite. The falling dart impact data was indicative
of excellent energy absorption for low velocity projectiles.
2.2.2 Processing Woven Thermoplastic Broadgoods
The use of woven thermoplastic
composite broadgoods is an efficient method for laying up a substantial area
and thickness of composite for processing in a thermoforming environment. An important requirement for the effective
thermoforming with vacuum bag or double belt press is that the prepreg tape
used to weave the fabric must be evenly and completely wet-out by the
resin. The degree wet-out of the fiber
by the resin is dependent on the compatibility of the resin and the fiber
sizing as well an even application of the resin to the fiber under appropriate
processing conditions to avoid dry fibers.
Prepreg tape can be woven into broadgoods with various weaving patterns
appropriate to the application. The
choice of fiber type, resin, and fiber content may be adjusted to fit the
mechanical and cost constraints of the final part desired. Generally, in the case of polypropylene/glass
tape the percentage of fiber by weight can be set from 30 percent to 60 percent
without great difficulty.
Polypropylene/E-glass tape was
produced in a 12.7 mm width and then woven in to a fabric as shown in Figure
2.2.1-1. This material is about 1 meter
wide. A close-up view is shown in Figure
2.2.2-2.

Figure
2.2.2-1 Roll of Woven
Polypropylene/E-Glass Fabric
Figure
2.2.2-2 Close-up View of Woven
Polypropylene/E-Glass Fabric
The woven fabric was consolidated
into a flat panel in a heated double belt press. This process formed the raw woven fabric into
a dense composite. A sheet of that
material is shown in Figure 2.2.2-3.
Figure
2.2.2-3 Consolidated Sheet of Woven
Polypropylene/E-glass
A close up of the same material
is shown in Figure 2.2.2-4. The
consolidated forms can be used as-is as structural panels, subsequently formed
in standard thermoforming operations, or joined to other components by fusion
or adhesive bonding.
Figure
2.2.2-4 Close-up of Consolidated Woven
Polypropylene/E-glass
The woven material can also be
consolidated by vacuum bagging and or bagged and autoclaved if additional
pressure is need to form the part. A
prototype bus floor subcomponent was fabricated from this woven form of
thermoplastic composite material using vacuum bagging methods with a one-sided
aluminum tool.
The particular materials incorporated
into the woven broadgoods were polypropylene (BP/Amoco 9965) and E-glass (Owens Corning 225-4588). The tapes were made using the Direct
Reinforcement Fabrication Technology (DRIFT) process and then woven into
broadgoods. Figures 2.2.2-5 and 2.2.2-6
show the weaving process that was performed by American Iwer, Greenville,
SC.
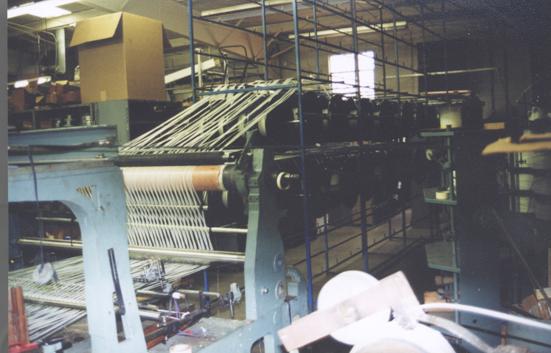
Figure 2.2.2-5 Loom Weaving
Thermoplastic Prepreg
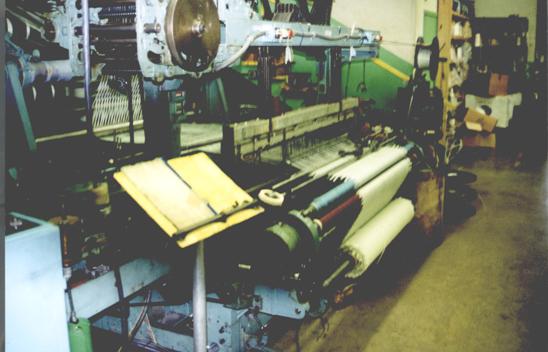
Figure 2.2.2-6 Take-up
Accumulator for Woven Prepreg Fabric
Each layer of fabric when
consolidated is about 0.6mm thick. Flat
parts can be made in various thicknesses and widths using a heated double belt
press. Multiple layers of woven prepreg
may be consolidated into a single flat sheet using a belt press concept like
that shown schematically in Figure 2.2.2-7.

Figure
2.2.2-7 Schematic of Double Belt Press
A processing method that has some
similarity to the VARTM process is the vacuum bag thermoforming process. The tooling for vacuum bagging is
single-sided which reduces cost. The
tooling can be made from a variety of materials depending on the volume of
parts and the rate of production needed.
In addition, all of the bagging components and tooling need to
gracefully handle the process temperatures encountered with the resin system
utilized. Aluminum tooling has the
advantage of machinability and high thermal conductivity which can reduce both
heating and cooling time. Steel is the
most durable tooling, but also the most expensive. Regardless of the choice of tooling material,
one must size the heating and cooling function so that the respective heat and
cool cycles are acceptably rapid. For
most applications, direct electrical heating is the most inexpensive approach
to getting the tooling and prepreg up to processing temperature. Cooling can be effected with water spray into
internal channels of the mold that will turn of steam and be vented away
safely. It is also feasible to use
circulating oil as a heating and cooling medium which eliminates of the wiring
associated with the cartridge heaters.
Sizing of the heating capacity of the tooling is dependent on the mass
of the tool, the heat capacity of the tooling material, and how rapidly the
tool is required to heat up. The same
constraints hold for cooling capacity.
Figure 2.2.2-8 shows an example of an aluminum mold with associated
cartridge heaters. This particular mold
weighed about 320kg and could be raised to a temperature of 50˚ C in about
6 minutes. This required about 42kw of
heating.
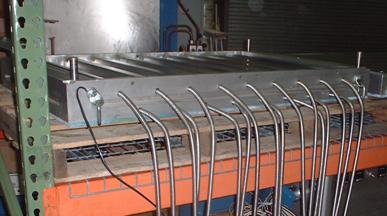
Figure 2.2.2-8 Aluminum Mold
Half Showing Inserted Cartridge Heaters
Figure 2.2.2-9 shows mold
prepared for vacuum bagging of a woven thermoplastic material for the flooring
subcomponent. This prototype mold has
material hold-down clamps to keep the multiple prepreg layers initially
conformed to the mold for proper vacuum bagging to occur. In a production situation automatic slides
would perform the hold-down function to achieve a shorter cycle time.
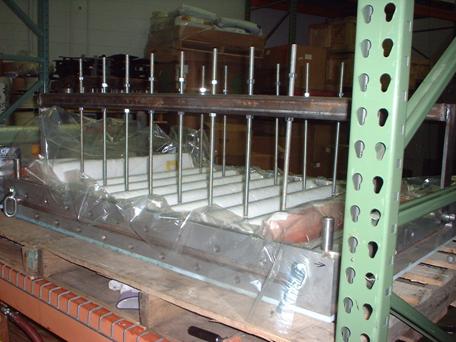
Figure 2.2.2-9 Mold Prepared for
Vacuum Bag Thermoforming
Once a part is consolidated it
can be used as is or assembled to another component. In production circumstances vibrational or
ultrasonic bonding would be typical assembly tools. On a more limited prototype production hot
melt adhesives can be used effectively as shown in Figure 2.2.2-10. On a large part the adhesive can be applied
in the proper place and quantity and permitted to cool before the secondary
operation of putting the parts together and heating to bond, Figure
2.2.2-11.
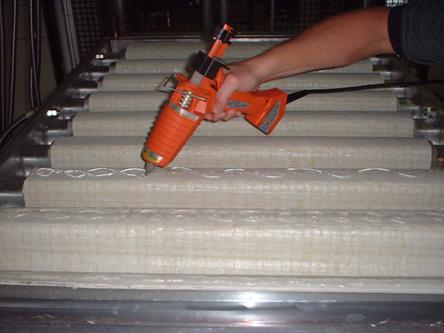
Figure 2.2.2-10 Preparation for
Part Bonding with Low Melt Adhesive
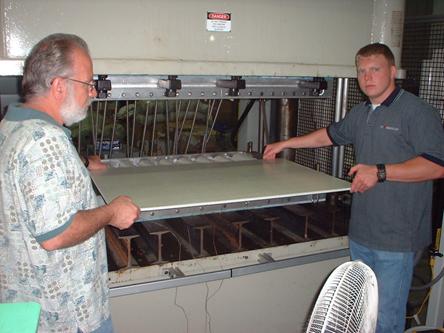
Figure 2.2.2-11 Placement of
Secondary Part of Flooring Subcomponent to
be Adhesively Bonded
The design and testing of the
processed flooring subcomponent is described in Section 2.5.
2.2.3 Mechanical Testing Results
Several material combinations
were tested to confirm the impact and tensile properties of potential bus
components. In addition a study was
performed to investigate the possible influence of specimen width on the
measured ultimate tensile strength and modulus.
2.2.3.1 Tensile Data on Compression-Molded Panels- Effects of Test Sample Width
Tensile properties for
polypropylene/glass (PP/Glass) composites were reported previously based on
1-inch wide rectangular, tabbed specimens.
There has been some concern that the width of the specimen might
influence the measured tensile properties in long fiber thermoplastic
composites due to the cutting of fibers during specimen preparation. Therefore an experiment was performed in
which standard PP/Glass panels were tested using 12.7mm, 19.0mm, 25.4mm ,38.5mm
and 50.8mm wide samples to detect any trends.
The results of the studies are
illustrated in Figures 2.2.3.1-1 and 2.2.3.1-2 below.
Figure
2.2.3.1-1 Ultimate Tensile Strength as
a Function of Specimen Width and Orientation
Figure
2.2.3.1-2 Modulus as a Function of
Specimen Width and Orientation
The most obvious aspect of this data
set is that the samples taken transversely to main flow of the material
consistently shows reduced ultimate tensile strength (UTS) and modulus. This is the expected trend with the magnitude
of the difference between the longitudinal and transverse data depending upon
the anisotropy induced during molding.
In this particular case the modulus and UTS of the transverse specimens
are nominally 70 percent of the longitudinal values. The transverse specimens also have a
consistent pattern of being insensitive to the specimen width effect on modulus
or UTS.
Figure 2.2.3.1-1 and Figure
2.2.3.1-2 illustrates that there is no discernable correlation of modulus and
ultimate tensile strength to the specimen width. This supports the hypothesis that specimen
width does not effect mechanical property measurements with 25.4mm fibers using
compression molding as the process for fabricating the samples. This observation is important in that our
previous tensile data is not subject to reinterpretation regarding sample
geometry.
2.2.3.2 Polypropylene/Glass Impact Investigations-Gas
Gun, Falling Dart, And Izod Tests
Many composite materials used as
structural members are susceptible to Low Velocity Impact (LVI, less than 10m/s)
and Intermediate Velocity Blunt Object Impacts (IVBOI, greater than 10m/s and
less than 100m/s) such flying debris, stones/rocks and tool drops is a matter
of great concern and is not well understood; both in test methodology and
failure mechanisms. No standard test
methods presently address impact threats from such common phenomena. Traditional impact data for thermoplastics
relies upon notched-Izod impact, which does not correlate well to the common
impact threats.
In the present work the impact damage
resistance of extrusion-compression molded LFT - PP is studied for its damage
and energy absorption characteristics using an intermediate velocity gas-gun
(IVBOI) and low velocity drop tower (LVI) impactors. The compression-molded
panels were manufactured from LFT pellets.
This section reports results on
LVI and IVBOI pertaining to LFT glass/PP panels in which the damage response,
energy absorption characteristics and damage modes of the LFT panels are
investigated. Charpy and Izod type
impact test configurations are limited in terms of specimen size, impact
duration, and boundary conditions. A
more representative test would be the LVI and IVBOI scenarios.
The composite material considered
was comprised of BP-Amoco 10-9961 (PP) resin using glass fiber (Johns Mansville
840-BC-225) with an average fiber length in prepreg chips of 12.5mm, 60 weight
% fiber fraction, 2.5% 3200 polybond additive and 1% Schulman 3200 heat
stabilizer. LFT pellets were plasticized
and a charge (shot) extruded. The charge
was placed on a tool and compression molded to produce plaques. LFT plaques of size 10.16mm x 10.16mm were
cut for LVI testing and 21mm x 21mm for Blunt Object Impact (BOI). The average weight and standard deviation for
the BOI samples was 206.32g (Standard Deviation (S.D.)=
1.358g), 219.8g (S.D.= 1.822g), 225.27g (S.D.= 1.056g). The average areal density corresponded to
0.439g/cm2, 0.467g/cm2, and 0.479g/cm2. For LVI tests samples with areal density
0.439g/cm2 only were used.
The LVI tests were conducted
using a Dynatup 8250 impact-testing machine equipped with a load cell of
capacity 1590kg. A hemispherical shaped
head tup of diameter 19.5mm and mass 0.12kg was used. The total dropped mass including the tup
mass, impactor and the holding bolts was 3.35kg for the hemispherical impactor. The samples were clamped using a pneumatic
assist mechanism, such that 76.2mm (3”) diameter of the sample face was exposed
to the impactor. The force-time,
energy-time and load-deflection response of the samples was measured using the
instrumented feature of the Dynatup instrument. The LVI tests were conducted on samples with
areal density 0.439g/cm-2. Damage initiation and progression was
monitored.
Figure 2.2.3.2-1 illustrates a typical
force-time-energy curve for the LFT glass/PP specimen. The energy absorbed and the peak force were
normalized with respect to the thickness (E/t and F/t respectively). The blue force-curve shows some noise on the
initial rise and is only one set of data.


Figure 2.2.3.2-1 Typical Force-Time-Energy Curve for
LVI of LFT Glass/PP Plate Red Curve is Energy and Blue Curve is Force
Table 2.2.3.2-1 provides the
details of eleven samples tested at an average impact velocity of 3 m/s, and
the resulting E/t and F/t values. The
average value of E/t was 3.54kJ/m and the F/t was 956kN/m. Impact failure was observed to be primarily
tensile fracture of the back surface. Figure 2.2.3-2a shows compression
indentation on the impact face, and Figure 2.2.3.2-2b shows the tensile side
fracture.
Table 2.2.3.2-1 Summary of
Falling Dart Impact Tests for Polypropylene/Glass
Figure 2.2.3.2-2
LVI to LFT Glass/PP Plate
(a)
Impact side and (b) Back (tensile) side
Note preferential cracking along
fiber orientation. The fiber orientation
is developed during the compression molding process accompanied by whitening of
the sample. The whitening, or crazing, was caused by straining of the
matrix. A combination of fiber pullout
and fiber breakage along preferential paths was observed, and shown in Figure
2.2.3.2-3a. The preferential orientation
of the fibers arises from the compression molding processing. Examples of fiber pullout bridging the cracks
are shown in Figure 2.2.3.2-3b. The long
fibers embedded in the matrix are seen to contribute to the energy absorption
though fiber pullout mechanisms.
Figure 2.2.3.2-3 LVI to LFT Glass/PP
Plate
(a) Fracture path
with bridging long fibers and (b) fiber pullout bridging crack
Intermediate Velocity Blunt
Object Impact test velocities ranging between 10m/s-100m/s were used to simulate
the effect of blunt objects such as rocks and debris traveling at highway
speeds. For this, a gas-gun was used to
propel a variety of projectiles over a velocity range of approximately 10m/s
to 100m/s. The gun consists of a
3m barrel, firing valve, and capture chamber, shown in Figure 2.2.3.2-4. Within the capture chamber, the specimen is
constrained, and the projectile velocity measurements are made. An aluminum sabot of 38.1mm diameter and a
mass of 100g was used as the blunt object projectile.
Figure 2.2.3.2-4 Gas Gun Test Apparatus
The capture chamber and velocity
data acquisition system is shown on the left and the gun assembly and pressure
transducer is shown on the right.
Two photoelectric chronographs
(Model–CED Millennium) were secured to the capture chamber with a transparent
optical window to record the incident and residual projectile velocity. The impact velocity is controlled by the
pressure of the working fluid, which in this case was nitrogen. A calibration curve was generated to
establish the relationship of the pressure to projectile velocity. The highest energy is absorbed at the
ballistic limit of the material, at which the projectile actually embeds in the
specimen.
Five samples were tested for each
test configuration in an attempt to accurately determine the critical (or
ballistic limit) velocity. Three test
configurations where considered, representing the effect of random and
preferential fiber orientations in addition to variations in areal density due
to processing. This is similar to the V50
ballistic limit, which is defined in terms of the projectile having a 50%
probability of completely penetrating the specimen at the critical
velocity. Two simply supported boundary
conditions on two and four sides with the supports 160mm apart were
considered.
The results for energy vs. areal
density are shown in Figure 2.2.3.2-5.
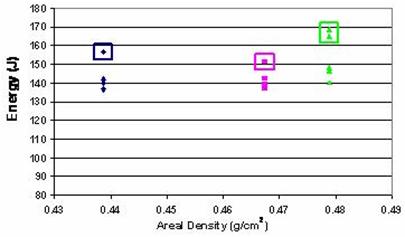
Figure 2.2.3.2-5 Energy
Absorption vs. Areal Density for Three Samples
Data in Boxes from
Samples with some Fiber Orientation
For samples with areal density of
0.439g/cm2 and 0.467g/cm2, the impact response in terms
of energy absorption was of similar magnitude (approximately 142 J), while for
the 0.479g/cm2 the energy absorbed increased by about 8%. An increase in energy absorption with
increasing areal density is expected, however, the specimen with the areal
density of 0.479g/cm2 is also where the charge is placed during
processing. This results in a less
significant degree of fiber orientation thus less planes of preferred fiber
orientation, which is believed to contribute to the increased energy
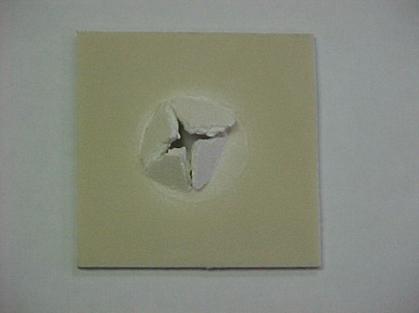
absorption. Representative damages are
shown in Figures 2.2.3.2-6, 2.2.3.2-7, and 2.2.3.2-8.
Figure 2.2.3.2-6 Sample 020919-1-38b Showing IVBOI without Penetration
Kinetic Energy = 132.10J,
100g Sabot
Figure 2.2.3.2-7 Sample
020919-1-33b Showing IVBOI without Penetration
Kinetic Energy =
148.4J, 100g Sabot

Figure 2.2.3.2-8 Sample
020919-1-01b Showing IVBOI with Penetration
Kinetic Energy =
144.7J, 100g Sabot
The impact of a 100g projectile
was recorded using a high-speed camera with 14,000 pictures per second
providing 40ms
exposures. About 25mm maximum
deformation was observed in flexure combined with torsional oscillations of the
panel during the course of the impact deduced from the high-speed photography
tests with the specimen simply supported on two sides for viewing
purposes. For panels with normal
incidence (i.e., full contact of the projectile face with the sample) of
impact, the limiting damage occurred by punch-through (shear plug) near the
impactor where areas of high transverse shear stress exist. Away from the impactor, simultaneous tearing
across planes of preferential fiber orientation was the dominant failure
mode. In most of the tests, the edge of
the projectile made contact due to slight tilting of the projectile prior to
contact that resulted in an initial notch arising from the localized high
contact stresses which then proceeded to punch-through and tearing
failure. The onset of damage and
perforation are illustrated in Figures 2.2.3.2-9 and 2.2.3.2-10, respectively.
Figure 2.2.3.2-9 Sample
020919-1-65b
High-Speed Image of the
onset of Damage, Kinetic Energy=142.3J
Figure 2.2.3.2-10 Sample
020919-1-65b
High-Speed Image
Showing the Perforation of the Sample, Kinetic Energy=142.3J
The velocity for penetration of
the test panels varied from approximately 53m/s to 59m/s for the
100g sabot, and the maximum energy absorbed was approximately 169 J. Summaries of the IVBOI results are shown in Table
2.2.3.2-2.
Table
2.2.3.2-2 Intermediate Velocity Impact Tests on
Polypropylene/Glass Panels
Representative fracture surfaces
of the impacted specimens were sectioned, mounted, and coated with
gold-palladium before viewing in a Scanning Electron Microscope (SEM). The images verified the initial assumption
that the fractures were occurring along planes of preferential fiber
orientation shown in Figures 2.2.3.2-11, 2.2.3.2-12, 2.2.3.2-13, and 2.2.3.2-14. In addition, a high degree of fiber pullout
can be seen along with matrix crazing.
The extent to which fiber fracture occurred prior to fiber pullout
cannot be determined because the fibers are discontinuous. Fiber fracture is believed to contribute a
large portion of the energy dissipation in ductile matrix composites undergoing
impact.
Figure 2.2.3.2-11 Sample 020919-1-34b Impacted with a 100g (38.1mm f)
Sabot at 53.1 m/s
The boxed region indicates the
fracture surface sample section. Energy
absorbed=142.0 J, specific fracture energy =142.9 kJ/m2.
Figure 2.2.3.2-12 SEM Normal to
the Fracture Surface of Sample 020919-1-34b Showing Fiber Pullout, Matrix Crazing
and Fiber Fracture
The preferential fiber
orientation is clearly visible.
Figure 2.2.3.2-13 SEM Normal to the Fracture Surface Showing Fiber Pullout,
Matrix Crazing and Fiber Fracture
The strong fiber/matrix adhesion
should be noted.
Figure 2.2.3.2-14 SEM Normal to the Fracture Surface of Sample
020919-1-39b after an IVBOI Test
The LFT glass/PP
panels exhibited localized damage by tensile-side fracture through a
combination of fiber pullout and breakage under LVI. In both the LVI and IVBOI testing, the
relatively flexible targets responded primarily by bending, which resulted in
high tensile stresses on the back face of the sample. The thickness-normalized value for absorbed
energy was determined to be 3.54kJ/m with peak load of 361kg. The long fibers bridged the crack faces, and
contributed effectively to energy absorption with LVI testing.
The LFT plaques simply supported on two sides
exhibited almost 25mm dynamic deflection and repeated torsional-flexural
vibrations of the panel during IVBOI, without visible damage up to areal
density and fiber orientation dependent threshold energy. For example, the threshold energy for the
samples with areal density of 0.439g/cm2 was 136 J. The failure mode was shear punch-through with
simultaneous tearing along planes of preferential fiber orientation with a much
larger fracture area than was seen in the LVI testing.
In both LVI and IVBOI, the matrix cracking
developed along preferential orientation of the fibers, which was developed
during the compression molding process.
Fiber pullout and breakage were dominant failure modes.
One set of low velocity impact
tests was performed on consolidated woven PP/glass, 60 percent fiber by
weight. The continuous fiber performed
well on impact tests as shown in Table 2.2.3.2-3. This is the same material used in fabrication
of the bus floor subcomponent described in later sections of this report. The impact characteristics are better than any
other PP/glass system that was tested during this effort. Only the polyurethane/glass combination (60
percent fiber by weight) provided a superior impact performance.
Table
2.2.3.2-3 Low Velocity Impact Tests on
Polypropylene/Glass Panels
2.2.3.3 SMA/Glass Mechanical Test Results
SMA/glass test specimens were
made from unidirectional and random fiber panels. The unidirectional and random fiber panels
were tested for tensile properties and impacts tests were performed only on the
random fiber panels. The results are
summarized in Tables 2.2.3.3-1, 2.2.3.3-2, 2.2.3.3-3, and 2.2.3.3-4. The unidirectional fiber samples showed
properties superior to the longitudinal samples that were likewise superior to
the transverse fiber samples. This
confirms that anticipated fiber orientation effects of the longitudinal and
transverse fiber samples taken from random fiber panels. The results of the impact tests of the SMA
panels were inferior to the polypropylene/glass panels listed in Table 2.2.3.2-1.
Table 2.2.3.3-1
Unidirectional SMA/glass Fiber Tensile Properties
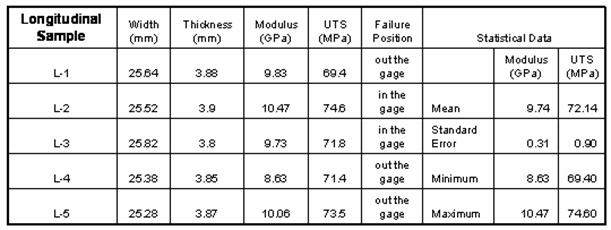
Table 2.2.3.3-2
Random Fiber SMA/glass Tensile Properties–Longitudinal
Orientation
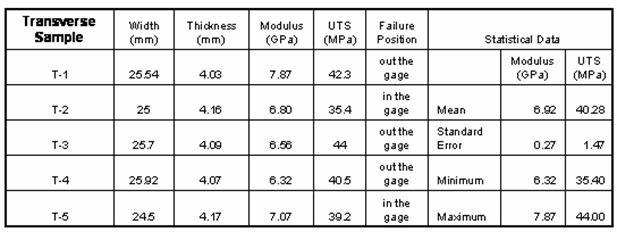
Table 2.2.3.3-3
Random Fiber SMA/glass Tensile Properties–Transverse Orientation
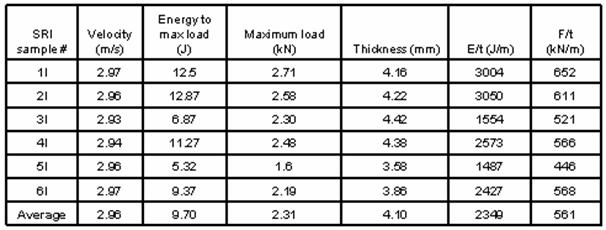
Table 2.2.3.3-4
Low Velocity Impact Data– SMA Random Panels
2.2.3.4 Polyurethane/Glass Panel Impact Results
Polyurethane/glass thermoplastic
composite was investigated for application on parts requiring impact resistance
and finish. The polyurethane is
paintable as well as impact resistant.
The tabulation of several polyurethane forms including film is shown in
Table 2.2.3.4-1. The energy absorption
per thickness (E/T) is superior to any of the other materials that have been
tested in this effort. It is anticipated
that these materials may be useful for body panels and other parts subject to
impact damage.
Table 2.2.3.4-1
Polyurethane/Glass Panel Impact Results
2.4 Fire Safety of Flooring
The fire safety requirements
for interior mass transit applications are ASTM
E-162 and ASTM E-662. High composite fiber content promotes inherent flame
retardant characteristics, but additives and coating may enhance those characteristics. The composite fiber content of the fabricated
flooring subcomponents is 60 percent by weight, considerably higher than the 40
weight percent material used in the bus seat trials in last year’s
efforts. Therefore the good results
obtained last year with the 40 percent fiber material would be even better with
the current material formulation.
Nevertheless, additional investigation into improving the flame retardancy characteristics has continued. An overview of the principles governing the
function of fire retardants and previous data follow.
The function of a flame
retardant may be classified based upon the critical part of the combustion path
that contributes to flame spread.
Figures 2.2.4-1 and 2.2.4-2 (Marcel. M. Sommer, Evaluating the Results
of Research: Halogen-free Flame Retardancy to LFTs, Institut Fur
Verbundwerkstoffe; LFTs 2003; Brussels, Belgium;
May, 2003) respectively outline the critical process points and list the types
of flame retardants and their modes of operation.

Figure
2.2.4-1 Critical Points of Flame
Retardancy Function

Figure
2.2.4-2 Several Flame Retardants and
Respective Modes of Operation
Two different concepts have been
investigated. The first approach
requires compounding a flame retardant into the polymer matrix of the composite
and the second approach applies the flame retardant as a top coat during or
after manufacture of the component.
Looking on this approach, a non-halogenated flame
retardant was selected to eliminate the impact on smoke and toxicity reported
by halogenated materials. There are a very limited number of flame-retardants
available, especially for polypropylene. We tested the fire retardant Exolit AP751, made by Clariant, in a 40%
glass-reinforced polypropylene. The addition of the flame retardant changes the
impact behavior of the component. Adding 5% of Exolit AP751 reduces the Dynatup
impact performance by approximately 10%.
However, more important is the change in
the type of failure. Figures 2.2.4-3 and 2.2.4-4 show a sample without and with,
respectively, flame retardant after Dynatup low velocity impact testing. The
sample with the flame retardant behaved as a brittle material.
Low velocity impact tests were used to evaluate damage
initiation, progression and fracture of the thermoplastic composite samples.
The equipment used to conduct the tests is an instrumented Instron 8250 drop
tower. The basic principle of operation is to drop a tup of known weight from a
set height onto the test sample. The maximum load and maximum energy absorbed
by the test sample and the damage to the sample is assessed.

Figure 2.2.4-3
Sample of 40 Weight Percent Glass Composite without Flame Retardant after Dynatup Impact
Testing
Figure
2.2.4-4 Sample of 40 Weight Percent Glass
Composite with Exolit AP751 after Dynatup Impact Testing
Two coating fire retardants were tested during our
previous work. Flame Seal FX-PL and
Thermaflex II-C from Avtec Industries are topcoat flame retardants rated as
UL-V0. These materials were applied by brush to polypropylene panels to gauge
the surface finish and flame retardancy.
These preliminary tests showed that both appeared to provide good flame
retardancy on 40 percent glass polypropylene composite. The Flame Seal product was selected on the
basis of surface finish after drying.
Panels were produced and coated with the Flame Seal FX-PL product. After curing at 60°C, the samples were
submitted to an independent testing lab for evaluations with respect to flame
spread and smoke density generation according to ASTM E 162-95 and E 662-95 respectively. The advantage of the coating method was that
mechanical impact performance would not be compromised by the fire retardant.
Results from an independent flammability-testing laboratory
were very favorable. The data in Table
2.2.4-1 summarize the flame spread and smoke generation data and juxtaposes
them against the standards for bus seat applications.
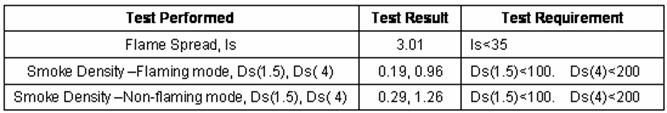
Table 2.2.4-1 Flame Spread and
Smoke Testing Results
As can be readily noted from the
results, the surface coating of the flame retardant was sufficient to pass both
flame spread and smoke density tests with the polypropylene/glass composite
formulation with the 40 weight percent fiber content. The bus flooring material will be even more
flame resistant with 60 weight percent glass fiber content since there is much
less potential combustible polymer matrix to burn. Ongoing discussions are continuing with the Flame Seal Corporation to adapt and improve
the application of their fire retardant coating to transit bus applications.
Several areas of future
advancements are feasible using off-the-shelf materials. One area of promise is the use of
nanoparticles as flame retardants.
Hybrid Plastics (Fountain Valley, CA)
market products based on nano-structured particles that may be pre-compounded with
a twin screw extruder and then added to the composite material production using
current production methods. A second
area of additional flame retardants that may also be useful in bus applications
is that of ceramic precursors that could also be compounded to provide flame
retardancy and perhaps some abrasion resistance. These retardants will be considered in future
efforts.
2.3 Joining Studies
One of the objectives relating to
the application of thermoplastic composites in major bus structures is the
effective joining of the composites with other composite structures and
conventional metallic elements. The
studies in the current year effort were focused on composite-to-composite joining
and included the joining of several material combinations. Testing of joining systems was performed with
lap shear tests and also impact tests.
The objectives were the
following:
·
Determine the best adhesive for bonding of
similar polymers, dissimilar polymers, and composites by means of single-lap
shear tests
·
Determine the single-lap shear strength of
bonded similar polymers, dissimilar polymers, and composites
·
Determine the effect of the surface treatment on
joining by measuring the surface roughness of the substrates before and after
surface treatment
·
Determine the effect of release agent on the
shear strength of polymers bonded by the best adhesive
2.3.1 Lap Shear Tests of Neat
Polymers
The best adhesives for bonding
nylon-nylon (PA-PA), polypropylene-polypropylene (PP-PP) and polybutylene
terephthalate-polybutylene terephthalate (PBT-PBT) were determined by
evaluating results of single-lap shear test.
The adhesive candidates for
PA-PA, PP-PP and PBT-PBT are listed in Table 2.3.1-1. Single-lap shear tests were performed as per
ASTM 1002-72, which recommends testing of at least five samples in each test
group.
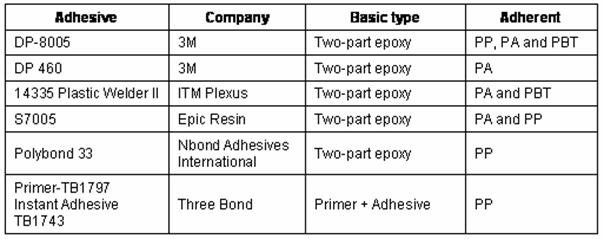
Table 2.3.1-1 Adhesive Candidates and Manufacturers
The following methods were used
for surface preparation:
–
Clean the surface with acetone or alcohol
–
Mechanically abrade with sand paper (180 grit)
–
Clean the surface with acetone or alcohol
–
Dry at the room temperature
- Method 2 (Flame treatment)
–
PP-PP joined by S7005 and Polybond 33, requires flame
treatment
–
Torch was
used to conduct flame treatment
·
Method 3 (Primer)
–
For PP-PP joined by instant adhesive TB1743,
brush on primer TB1797 to the substrate to be bonded
To stimulate the effect of
release agent, 700-NC (Dexter Adhesive & Coating System) was applied to the
surface that was to be adhesively bonded.
The following procedure was used:
(1) Clean the surface thoroughly
to remove dirt, grease, and other contaminants
(2) Hold aerosol can 20-30 cm
from the surface and apply two base coats. Apply a thin, mist spray, moving the
can in a horizontal or vertical direction
(3) Dry at room temperature
(4) Heat the specimen to 100°C and
hold for 5 minutes, then immediately press the two parts together by using
Carver Lab Press, holding for 5 seconds at 26 MPa
The results of mechanical tests
are presented in Tables 2.3.1-2, 2.3.1-3, and 2.3.1-4.
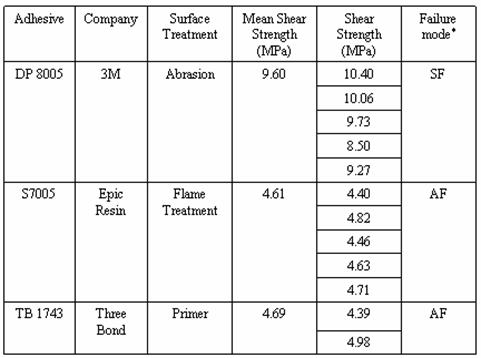
*The failure mode is characterized as: SF -
substrate failure, AF - adhesive failure
Table 2.3.1-2
Single-Lap Shear Strength of PP-PP
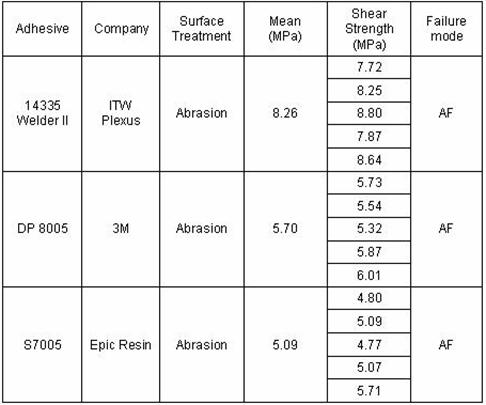
Table 2.3.1-3 Single-Lap Shear Strength of PA–PA
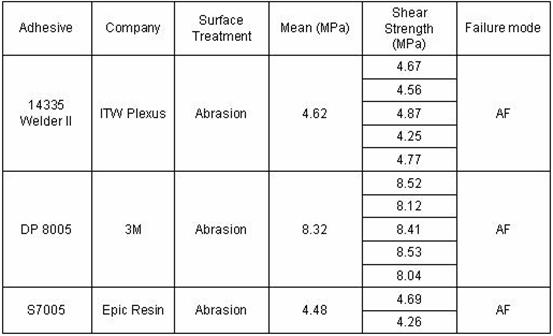
Table 2.3.1-4 Single-Lap Shear St rength of PBT–PBT
2.3.2 Surface Roughness Effects on Joining
Single-lap shear testing is a
good test method to determine the efficacy of the adhesives for bonding similar
polymers, dissimilar polymers, and composites. As noted in Section 2.3.1, the
adhesive DP8005 was the best adhesive for PP/PP, PBT/PBT, dissimilar polymers,
and glass fiber reinforced polypropylene composites (FRP). The best adhesive
for bonding PA/PA was 14335 Plastic Welder II.
The effect of the surface
treatment on joining was then evaluated by measuring the surface roughness of
the substrates before and after the particular surface treatment. The results
showed that abrasion with 180 grit silicon carbide (SiC) increased the surface
roughness of samples by approximately one order of magnitude, and the effect of
primer on surface roughness (after abrasion) was not very significant, except
for PP. For PP, the primer not only
increased the surface roughness but also improved the morphology (i.e.,
increased the mean peak spacing). The values of single-lap shear strength of
dissimilar polymers and FRP/FRP were determined by more than one ASTM standard
with two surface treatments (abrasion and abrasion followed by primer
treatment). The results showed that the single-lap shear strength increased
with the addition of spacers and with increasing length of the spacers. The
primer TB1797 did not have a significant effect on the single-lap shear
strength of bonded dissimilar polymers or FRP/FRP. The effect of the release
agent, 700-NC, on the shear strength of polymers bonded by the best adhesive
obtained above, showed that the release agent 700-NC had a strong effect in
conjunction with adhesive 14335 Welder II for PA/PA, while it did not have a
significant effect when used with adhesive DP8005 for PBT/PBT.
2.3.2.1 Materials and
Experimental Procedure
The materials used were as
follows:
·
Adherend: Glass fiber reinforced polypropylene (FRP),
nylon (PA), polypropylene (PP), and polybutylene terephthalate (PBT)
·
Primer:
TB1797 (ThreeBond Company). TB1797 is a primer
recommended for low surface energy plastic substrates, such as polyethylene,
polypropylene, and polyacetal
·
Release
agent: 700-NC (Dexter Adhesive & Coating System)
·
Adhesive:
The adhesive candidates are presented in Table 2.3.2.1-1
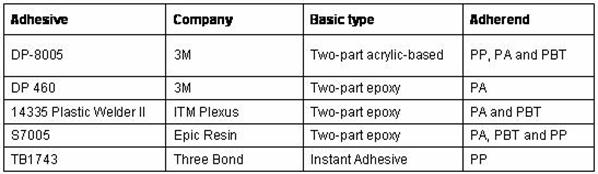
Table 2.3.2.1-1 Adhesive
Candidates
This approach was used to
determine the best adhesive for bonding similar polymers and then was used to consider
the best adhesives for bonding dissimilar polymers. The best adhesive for PP/PP
was used to bond FRP/FRP.
2.3.2.2 Experimental Procedure for Surface Roughness
An Alpha-Step 500 Surface
Profiler was used to determine surface roughness. It is a stylus-scan instrument with a maximum
scan length of 10mm. The technique was used to measure surface roughness at
five different locations and then take the average roughness. The processing
parameters were as follows: the scanning length was 5000µm, while the scanning
speed was 250µm/s. The average roughness (Ra) is the arithmetic
average of the absolute values of the height deviation from the centerline in
the profile (see Figure 2.3.2.2-1). The following formula defines Ra:

where: Ra = arithmetic
average deviation from the centerline
L = scanning length
y = ordinate height of the curve
of the profile, relative to the centerline.
Figure 2.3.2.2-1
Unscaled Example of Surface Roughness
Amplitude
Values of average surface
roughness of FRP, PP, PBT, and PA before and after
surface treatment are given in
Table 2.3.2.2-1. The data of surface roughness of these sample substrates are
shown in Figure 2.3.2.2-2.
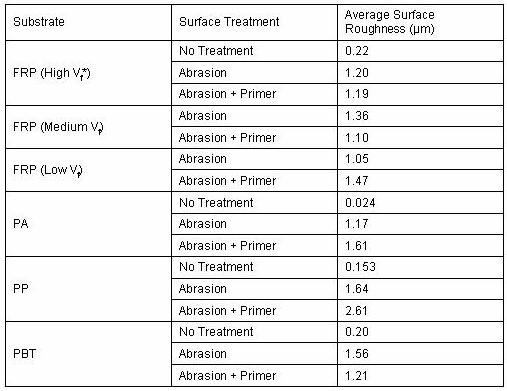
*Vf – Volume fraction of fiber
Note: The data of surface
roughness were obtained by averaging roughness at five different locations. The
surface roughness values are different at different locations.
Table 2.3.2.2-1 Surface Roughness
of Different Substrates before and after Surface Treatment
Figure 2.3.2.2-2 Surface
Roughness Profiles of FRP (with Medium Vf)
(a) before surface treatment, (b) after abrasion,
and
(c) after abrasion and primer treatment
Roughening with 180 grit abrasive
paper increased the surface roughness of prepared samples approximately by one
order of magnitude. The effect of primer on surface roughness (after abrasion)
was not very significant except for PP.
2.3.3 Single-Lap Shear Test
The single-lap shear strength of
PP/PP, PBT/PBT, and PA/PA bonded with their candidate adhesives are presented
in Table 2.3.3-1.
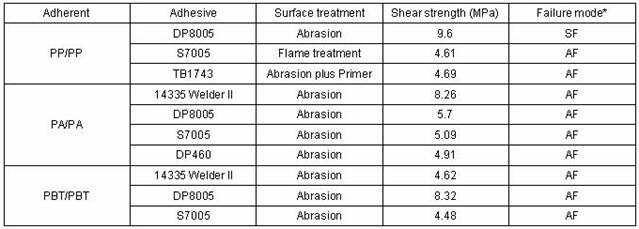
*The failure mode is characterized as: SF -
substrate failure, AF - adhesive failure
Table 2.3.3-1 Single-Lap Shear Strength
of PP/PP, PBT/PBT, and PA/PA
(ASTM D-1002)
Among the adhesive candidates
investigated, the best adhesive for PP and PBT was DP8005, whereas for PA, the
best adhesive is 14335 Welder II.
The best adhesive candidates for
bonding each of the similar polymer pairs were determined, as well as the
candidates for bonding of dissimilar polymers, (i.e., DP8005 and 14335 Welder
II were the candidates for bonding of dissimilar polymers). The values of
single-lap shear strength of dissimilar polymers bonded by these two adhesives
are presented in Table 2.3.3-2. Here, two ASTM standards and two kinds of
surface treatment were used.
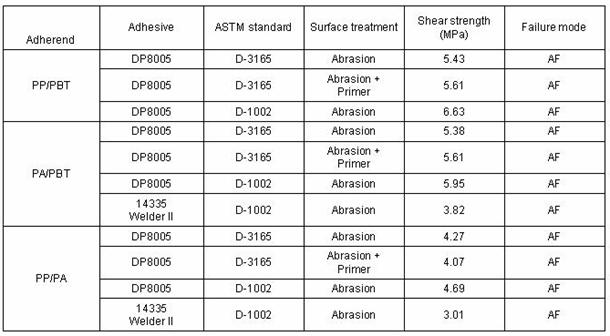
Table 2.3.3-2 Single-Lap Shear Strength of Bonding of
Dissimilar Polymers
From these results, the best
adhesive for bonding of three types of dissimilar polymers was DP8005. The
values of single-lap shear strength with ASTM D-1002 were higher than the
results with ASTM D-3165. The effect of primer TB1797 on the values of
single-lap shear strength was not significant.
DP8005 was selected as the
adhesive for bonding FRP/FRP. The values of single-lap shear strength of
FRP/FRP bonded by DP8005 are presented in Table 2.3.3-3. Three types of ASTM
standards and two types of surface treatment were used here.
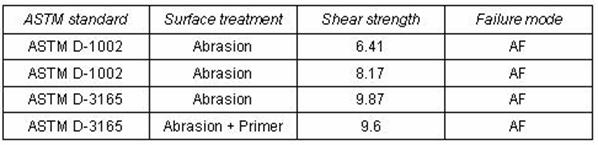
Table 2.3.3-3 Single-Lap Shear
Strength of FRP/FRP Bonded By DP8005
TB1797 primer does not appear to
have a significant effect on the single-lap shear strength of bond FRP-FRP.
2.3.4 The Effect Of Release Agent on Single-Lap Shear Strength
To simulate the influence of a
release agent, 700-NC (Dexter Adhesive & Coating System) on the adhesive
bonding, the following procedure was used:
·
Clean the surface thoroughly to remove dirt,
grease, and other contaminants.
·
Hold aerosol can 20-30cm from the surface and
apply two base coats, applying a thin, mist spray.
·
Dry at room temperature.
·
Heat the specimen to 100°C and hold for 5 minutes,
then immediately press the two parts together by using Carver Lab Press,
holding for 5 seconds with a pressure of 26 MPa.
The comparison of the single-lap
shear strength of PA-PA and PBT-PBT (ASTM D-1002) with release agent and
without release agent is shown in Table 2.3.4-1.
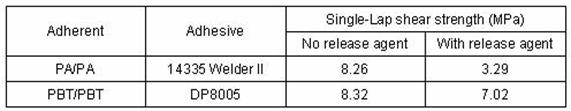
Table 2.3.4-1 Shear Strength Comparison with and without
Release Agent
From the above results, it was found
that the release agent 700-NC used had a strong effect in conjunction with
adhesive 14335 Welder II for PA/PA, whereas it did not have a significant
effect when used with adhesive DP8005 for PBT/PBT.
The observations regarding
adhesive bonding of thermoplastics investigated in this study are the
following:
·
The abrasion (180 grit)
increased the surface roughness of samples approximately by one order of magnitude.
·
The effect of primer on surface roughness (after
abrasion) was not very significant except for PP. For PP, the primer not only increased the
surface roughness but also improved the morphology, i.e., increased the mean
peak spacing.
·
Among the adhesive candidates for similar
polymers, the best adhesive for PP and PBT was DP 8005, while for PA the best
adhesive was 14335 Welder II.
·
The release agent 700-NC had a strong effect in
conjunction with adhesive 14335 Welder II for PA/PA, while it did not have a
significant effect when used with adhesive DP8005 for PBT/PBT.
·
The primer TB1797 did not show a significant
effect on the single-lap shear strength of bonded dissimilar polymers or
FRP/FRP.
2.3.5 Lap Shear Testing of
Ultrasonically Bonded Samples
For
ultrasonic welding, a welder manufactured by Branson Ultrasonic was employed. A
schematic of the ultrasonic welding apparatus is showed in Figure 2.3.5-1. High
frequency electrical energy is supplied to the converter that transforms it to
mechanical motion at ultrasonic frequencies. The mechanical motion is then
transmitted through an amplitude-modifying booster to the horn. The horn
transfers this vibratory energy to the parts being assembled, causing the
surface of the parts to melt and the two parts to be joined together. To make
sure that the parts contact firmly, the size of the horn is generally required
to be at least as large as the parts.
Figure 2.3.5-1 Schematic of Ultrasonic Welding Instrument
The
average value of single-lap shear strengths of three ultrasonically welded
FRP/FRP samples was 16.3 MPa. Compared with shear strength values of FRP/FRP,
bonded by adhesive DP 8005, as illustrated in Figure 2.3.5-2, the ultrasonic
welding was superior to adhesive DP 8005 in bonding FRP to FRP.
The
welding settings, shear strength, and failure mode of the three samples are
listed in Table 2.3.5-1. The samples showed different failure modes. For the
first two, the failure mode was “cohesive” failure (here “cohesive” failure means
failure through the welded region) and substrate failure, which are desirable
in bonding. There was no comparison of the performance of the two welded
samples solely by failure mode, because there was thickness variation in the
FRP substrates. For the third sample, the failure mode was mixed mode, i.e.,
“cohesive” failure and substrate failure.

Figure 2.3.5-2 Comparison of Single-Lap Shear Strength of
FRP/FRP Bonded by Adhesive DP 8005 and Ultrasonic Welding
Table 2.3.5-1 Effect of Welding Setting on Shear
Strength
and Failure Mode of FRP/FRP
2.3.6 Thermoplastic Joint Impact Tests
Impact tests were performed to
evaluate the mechanical strength of adhesively and ultrasonically bonded joints.
The impact tests conducted included low velocity impact (LVI) tests and an
intermediate velocity gas gun impact on ultrasonically bonded samples.
The
PP/PP, PP/PA, PP/PBT, FRP/FRP, FRP/PA, and FRP/PBT bonded with their best
adhesive were subjected to a gas gun impact test. The dimensions of the samples
were 200mm (overall length) ´
150mm (width) with a 25mm overlap. An
aluminum sabot (100g), which has a cylindrical shape, was used in the test as
the impactor. Samples were placed in the machine so that the PP or FRP face was
toward the sabot. Each test group included five samples. The impact resistance
of the joint was characterized by absorbed impact energy per unit area.
Results
of the gas gun impact test are listed in Table 2.3.6-1. The failure modes of
the joint were characterized as the same as that in single-lap shear test.
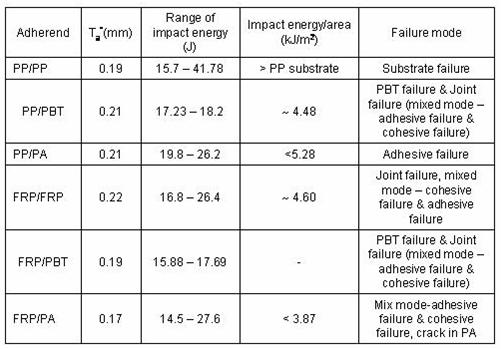
* Ta is the average
thickness of adhesive
Table 2.3.6-1 Gas Gun Impact Test Results of Adhesively
Bonded Samples
The gas
gun instrument imposed limitations in estimating impact strength of adhesively
bonded samples, since the minimum velocity is 15m/s, is not low enough. The
critical impact energy just sufficient to damage the joint could not be
achieved in most cases. Hence, the impact energy leading to the failure of the
joint or substrate was unknown; a range of impact velocities was applied for
each kind of samples. Also, the critical impact energy for each joint was
estimated by averaging the two following values: the first value, below which
the sample did not fail and the other, above which sample failed. Therefore the values of critical impact
energy are bounded approximations. When adherend substrate combinations
included PBT, PBT was seen to fail preferentially to the adhesive or to the
mated substrate. PP/PP showed substrate failure under impact, which indicates
impact resistance of the adhesively bonded joint was higher than that of the PP
substrate.
In the
gas gun impact test, PP/PP joints showed superior impact resistance to the PP
substrate. The impact energy of FRP/FRP
and PP/PBT were approximately 4.6kJ/m2 and 4.48kJ/m2,
respectively, while the impact strength of other adherent couples bonded with
DP8005 could not be obtained exactly because of the limitation of the gas gun
instrument.
 .
.
Figure 2.3.6-1 The Schematic of the Samples for LVI Test
The
dimensions of the samples for LVI test are shown in Figure 2.3.6-1. The samples were 203.2mm long and 50.8mm wide,
with a 25.4mm overlap. The sample was
fixed by two rollers on each end of the sample, leaving an opening of 152.4mm ´ 50.8mm. For the combined joining method, the location of
the screws is also shown. For testing of
unlike couples, the PP or FRP faces were positioned toward the impactor.
The
instrument used for the LVI test was a Dynatup 8250 drop weight impact test
machine, with an Instron Dynatup 930-I data acquisition system. The drop weight
was set as 31.8 N and the impact velocity was controlled by height, i.e.  . The total impact energy is given by
  . The results obtained in this test give impact velocity,
total impact energy, energy to failure, load and deflection at various times.
The impact resistance is noted as energy per unit bond area. Figure 2.3.6-2 shows the comparison of impact
resistance of welded and adhesively bonded samples. The impact resistances of
PP/PP and FRP/FRP bonded by the DP 8005 adhesive were 4.9kJ/m2 and
4.2kJ/m2, respectively, which were superior to other adherent
couples tested. The failure mode of PP/PP and FRP/FRP was cohesive failure or
mixed mode (cohesive failure and adhesive failure). For the other couples
tested, the failure mode was adhesive failure in all cases. As concluded in a
previous report, the shear strengths of PP/PP and FRP/FRP were higher than
shear strength of other adhesively bonded couples. The impact resistance of
welded FRP/FRP was 3.9kJ/m2, as mentioned above. The width of horn
was smaller than that of the joint; therefore, the entire joint area of the
couple was not completely welded.
. The results obtained in this test give impact velocity,
total impact energy, energy to failure, load and deflection at various times.
The impact resistance is noted as energy per unit bond area. Figure 2.3.6-2 shows the comparison of impact
resistance of welded and adhesively bonded samples. The impact resistances of
PP/PP and FRP/FRP bonded by the DP 8005 adhesive were 4.9kJ/m2 and
4.2kJ/m2, respectively, which were superior to other adherent
couples tested. The failure mode of PP/PP and FRP/FRP was cohesive failure or
mixed mode (cohesive failure and adhesive failure). For the other couples
tested, the failure mode was adhesive failure in all cases. As concluded in a
previous report, the shear strengths of PP/PP and FRP/FRP were higher than
shear strength of other adhesively bonded couples. The impact resistance of
welded FRP/FRP was 3.9kJ/m2, as mentioned above. The width of horn
was smaller than that of the joint; therefore, the entire joint area of the
couple was not completely welded.
Figure
2.3.6-2 Fig. VI. Comparison of Impact Resistance of Bonded Samples
2.3.7 Joining
Conclusions
The
following conclusions can be made from the joining studies:
1. The
single-lap shear strength of ultrasonic welded FRP/FRP was superior to that of
FRP/FRP joined by adhesive bonding. The ultrasonic welding process could be
optimized to yield better performance.
2. In
the LVI testing, PP/PP and FRP/FRP bonded by DP 8005 adhesive showed values of
impact resistance of 4.9kJ/m2 and 4.2kJ/m2, respectively,
and were superior to other adherend couples bonded by DP 8005. The impact
resistance of welded FRP/FRP was measured at 3.9kJ/m2.
3. The
impact resistance of samples joined via combined mechanical fastening and
adhesive bonding was evaluated by LVI testing. The results showed that joints
were always stronger than those of the FRP or PP substrates. However, addition
of fasteners decreased the impact resistance of the substrates. The extent of
failure energy decreased was approximately 30% with the addition of fasteners.
2.4 Tooling Development
Extrusion is one method to create
thermoplastic composite parts. The main
application chosen is a bus floor structure; however, the technology could also
be applied to any structural reinforced part that has a constant cross-section.
A die was constructed to conduct
trial runs for extruded thermoplastic sheet.
The die design took into consideration the heating requirements of the
thermoplastic materials and the geometric requirements of smooth transitions
for the long fibers that will be needed to form the extruded profile.
The die design is composed of 4
parts and a flange that connects it to the plasticator.
There are 17 through-channels for
heat cartridges/water lines. The
function (either heating or cooling) of the channels is interchangeable to
permit flexibility in the temperature profile for the die. The channels are tapped and at a constant
distance of 10 mm from the cavity. The
distance from channel to channel is an approximately 38mm from center to center
of hole.
There are wells for 18
thermocouples: 9 on each side along the plate, top and bottom die. These will be used to verify the heat
distribution to the flow. In addition
there are 4 pressure transducers ports located along the top plate only, but in
contact with the melt.
The die is constructed from hot
rolled steel and will permit the extrusion of flat sheet
6mm thick x 250mm
wide as a continuous process. See
Figures 2.4-1 to 2.4-4.
Figure 2.4-1 Assembly Drawing of
the Die with the Four Heating Zones Noted
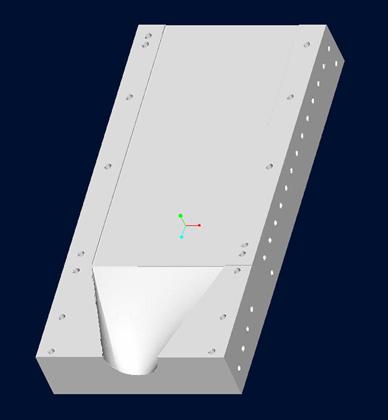
Figure 2.4-2 Bottom Die Assembly
(Cavity Visible)
Sections A and B characteristics are the following:
·
The flange connects to the front part of A and B
assembly with four bolts
·
Transition from circle to plate done smoothly
·
200mm x 350mm x 100mm overall dimensions
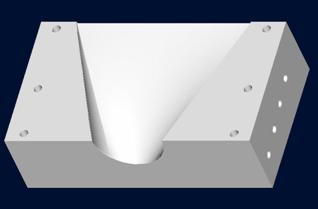
Figure 2.4-3 Solid Model of
Identical Parts A and B
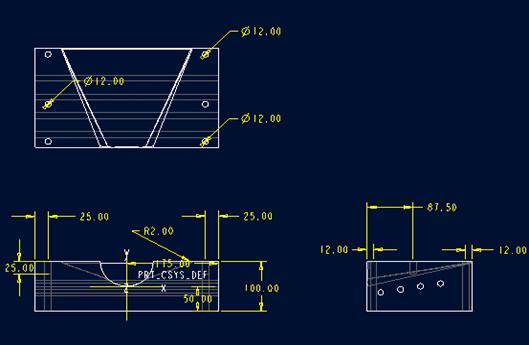
Figure 2.4-4 Dimensions of
Identical Parts A and B
Sections C and D have overall
dimensions of 525mm x 350mm x 100mm with a corner radius of 2mm and are shown
in Figures 2.4-5 to 2.4-8.
Figure 2.4-5 Solid Model of
Parts C and D
Figure 2.4-6 Dimension of Parts
C And D
Figure 2.4-7 Cross-section View Showing Thermocouple Wells and Heater
Holes
Figure 2.4-8 Placement of
Heating/Cooling Channels in Parts C and D
The die design was completed in
the first quarter of this year’s effort.
The die was fabricated as shown in Figure 2.4-9 at
the University of Alabama
at Birmingham (UAB) Physics Department machine shop.
Figure 2.4-9 Picture of Part A of
Extrusion Die during Fabrication
The second tooling design and
fabrication was associated with the bus floor subcomponent–a sine wave ribbed
structure with a single flat sheet on the top surface.
A multi-purpose tool was designed
to fabricate a flooring subcomponent.
Figure 2.4-10 illustrates the
part to be fabricated in several views with some dimensional information.
Figure
2.4-10 Drawing of the Bus Floor
Subcomponent Design
Figures 2.4-11, 2.4-12, and 2.4-13
show the design concept of the tool to be built to fabricate the prototype bus
component. The tool was designed to be
used in several ways. The primary mode
of operation will be as a two-piece thermoforming mold for woven thermoplastic
prepreg. An additional use for the
tooling is as an open or closed VARTM process mold. In either application, substantial heating
capability was incorporated by putting 17- 2500 watt cartridge heaters in each
half of the mold. The heating capacity
of 85 kilowatts is sufficient to raise the temperature rapidly enough for
either thermoforming woven prepreg or polymerizing the precursors to
Nylon. A four zone controller has been
designed and will be used to control the tool.
The tooling did not include any channels for cooling the mold since this
is prototype tooling rather than production tooling.
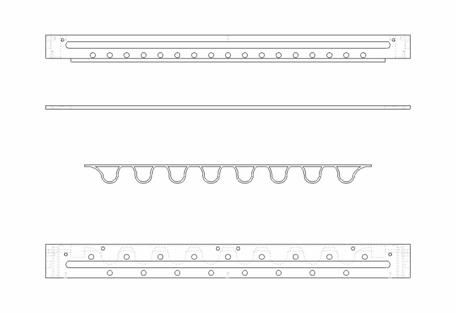
Figure
2.4-11 Line Drawing of Part and Tool for
Bus Flooring Subcomponent
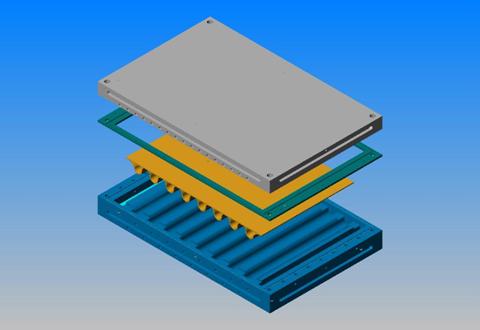
Figure
2.4-12 Exploded View of Tooling Design
Including Steel Shim and Part
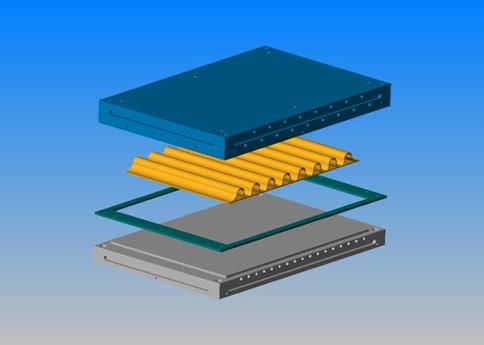
Figure 2.4-13 Inverted Exploded View of Tooling and Part
The use of a separate steel shim
between the two mold halves permitted the adjustment of thickness of the flat
sheet component of the flooring subcomponent without major machining changes to
the two mold halves.
This tool was used to fabricate
the flattened sine wave ribbed structure for the floor subcomponent.
2.5 Design, Analysis and Testing of Bus Flooring
Module
The design of the bus floor subcomponent was
based on industry guidelines, analysis of the existing floor, modeling of
several concept floors, and finally selection of a geometry suitable for
fabrication. The designed part was
fabricated by thermoforming methods then assembled and tested. The following sections describe these steps.
2.5.1
American Public Transportation
Association Floor Part Guidelines
The following is
an excerpt from the guidelines for standard transit bus components from the
American Public Transportation Association.
This document was used to assist in the design, specification, and
analysis of a bus floor subcomponent.
Body materials shall be selected and the body fabricated to reduce
maintenance, extend durability, and provide consistency of appearance
throughout the service life of the bus.
The bus flooring, and understructure components shall resist corrosion
or deterioration from atmospheric conditions and road salts for a period of 12
years or 500,000 miles which ever comes first.
Mode frequencies, including vertical, lateral, and torsional modes,
shall be sufficiently removed from all primary excitation frequencies to
minimize audible, visible, or sensible resonant vibrations during normal
service.
The floor shall be essentially a continuous flat plane.
The floor must support 2.5 gross
load weight without permanent detrimental deformation. The gross load weight is defined as one
hundred fifty pounds for every designed passenger seating position, for the
operator, and for each 1.5 square feet of free floor space.
The floor must withstand no more than 0.6
inches of elastic deflection from the normal plane at Gross Vehicle Weight
Rated (GVWR). GVWR is defined as the
maximum total weight, as determined by the vehicle manufacturer, at which the
vehicle can be safely and reliably operated for its intended purpose.
The floor shall be divided into sections that
are replaceable by a 3M mechanic in less than 30 minutes for a section up to 5
feet long (excludes the removal/installation of seats and floor covering).
Floor and step treads, with coverings applied,
shall withstand a static load of at least 150 pounds applied through the flat
end of a ½-inch diameter rod, with 1/32 inch radius, without permanent visible
deformation.
APTA Floor Plywood Guidelines
The plywood floor shall be of a thickness adequate to support the
design loads. The plywood shall be
installed with the highest-grade veneer up.
It shall be pressure-treated with a preservative chemical that prevents
decay and damage by insects.
Pressure-preservative treated plywood shall have a moisture content at
or below fifteen percent. A barrier
shall be installed to prevent contact by road salt with the plywood panels.
The measurements on the mass transit bus floor structure were
made at NABI in November 02, 2002. The floor was observed to mainly
comprise steel underbody frame and plywood flooring. A NABI drawing of a conventional bus floor is
shown in Figure 2.5.1-1. The major
section of the floor (without considering the back end and the driver side end), was approximately
5760mm (227”) x 2590mm (102”) as shown in Figure 2.5.1-1. Each substructure was considered as a unit
cell in the present study. A closer view
of the substructure is provided in Figure 2.5.1-2. The underbody steel frame was in the form of
a welded structure, as shown in Figure 2.5.1-3.
A nominal unit cell surface dimension was taken to be 1079mm (42.5”) x
736mm (29”), as shown in Figure 2.5.1-4. The demonstration composite floor
component dimension matched the value of a conventional unit cell.
Figure 2.5.1-2
Close-Up of Conventional Bus Floor
Figure 2.5.1-3 Steel and Plywood Floor used on Conventional
Bus Floor
Figure 2.5.1-4
Unit Cell of Conventional Bus Floor
The design philosophy adopted was
(a) the ability to use the material forms (produced through the DRIFT process)
along with cost-effective processing/manufacturing to produce structural
components usable for mass transit applications, (b) ability to incorporate
multi-functionality,
damage tolerance, vulnerability reduction, modularization, ease of
repair/replacement, durability and long-term use concepts, and (c)
cost and
weight saving potential.
From the APTA guidelines:
The floor must support 2.5 gross
load weight without permanent detrimental deformation. The gross load weight is defined as one
hundred fifty pounds for every designed passenger seating position, for the
operator, and for each 1.5 square feet of free floor space.
·
·
The floor must withstand no more than 0.6 inches
of elastic deflection from the normal plane at GVWR.
·
To meet the APTA standard the maximum deflection
should not exceed 1.524cm (0.6”).
The floor structure is subjected
to static / pressure loads, out of plane bending loads and in-plane compression
loads. The occurrence of dominant front
shear and vertical bending modes during
dynamic
loading of a bus structure have been reported, as shown with exaggeration in Figure 2.5.1-5. We estimated that the applied load varies
from a upper limit of 17,200 Pa (2.5 psi) to a lower limit of 4860 Pa (.705
psi). The upper limit of this range
accounts for the GVWR of the vehicle, the weight at which the bus can be safely
and reliably operated is about 13,636 kgs (30,000
lbs), while 17,200 Pa accounts for loads including dynamic effects (such as
vibration, out-of-plane bending and shear).
The lower limit (i.e. 4860 MPa (0.705 psi)), takes into account the 2.5
gross load weight to which the unit cell will be subjected.
Figure 2.5.1-5
Dynamic Modes of Typical Bus Structure
(a) front shear mode, and (b) vertical bending mode
2.5.2 Design Concepts
Several design concepts for a bus
floor structure were considered as potential candidates for fabrication. These include a balsa core with face sheets, sine
core with face sheets, an isogrid configuration, and a flattened sine with
a single face sheet. The respective
design analyses are found in the following sections.
2.5.2.1 Balsa Core and Face Sheets
The design consists of a balsa
core and three layers of either carbon or glass as face sheets on each side of
the balsa to create a sandwich that is close to the current commercial design
of the NABI Compobus. The face sheets
could be VARTM processed (high temperature for Nylon) or thermoformed and then
joined to the balsa. Degradation of
Balsa wood with high temperature used in the VARTM could be a process obstacle
for practical manufacture of a bus floor.
Joining of face-sheet to the balsa wood might need to be achieved with a
low temperature thermoset adhesive to avoid core degradation. Figures 2.5.2.1-1 and 2.5.2.1-2 illustrate
the two approaches using a balsa core with carbon/Nylon or glass/ Nylon
respectively.

Figure 2.5.2.1-1 Carbon/Nylon (VARTM) Sandwich Composite with Balsa Core

Figure 2.5.2.1-2
Glass/polypropylene (thermoformed, extruded) Sandwich Composite with Balsa Core
The stress modeling of the sandwich structure shown in Figure 2.5.2.1-3
assumes that the material properties are linear and orthotropic with a
25.4mm balsa core and a 0.635mm glass/Nylon face sheet.
Figure
2.5.2.1-3 Stress Development Balsa/Glass
Sandwich Composite
The required loading of the panel
demonstrates that the stresses are low in this design.
2.5.2.2 Sine Core Design
The sine core design consists of
a flat panel top layer with sine wave stiffeners that could be foam filled if
desired. There are several processing
methods that could be selected to fabricate this unit cell. The shape could be “co-VARTMed” to have the
shape integrated in one step. Another
method would fabricate the plate and sine stiffeners separately. The
plate could be extruded, thermoformed or formed by VARTM and the sine waves
thermoformed or formed by VARTM after which both components could be joined.
The pure sine wave design only
provides for a line contact in between plate and stiffener as shown in Figure
2.5.2.2-1.
Figure 2.5.2.2-1 General
Concept of Sine Wave and Deck Plate Bus Floor Design
The unit cell panel has an
overall dimension of 86.36cm x 152.4cm with the general shape and dimensions
listed in Table 2.5.2.2-1 and defined in Figure 2.5.2.2-2.

Figure 2.5.2.2-2 Definition of
Dimensions for Sine Wave Panel
|
Models
|
Height (cm)
|
Distance (cm)
|
|
4
|
6
|
10
|
12
|
|
0.635 cm (thickness)
|
3.81
|
(sine 1)
|
(sine 2)
|
(sine 3)
|
(sine 4)
|
|
5.08
|
(sine 5)
|
(sine 6)
|
(sine 7)
|
(sine 8)
|
|
6.35
|
(sine 9)
|
(sine 10)
|
(sine 11)
|
(sine 12)
|
Table 2.5.2.2-1 Parameter Combinations for Various Sine Models
Modeling of the sine wave unit cell was performed under the assumptions
that the material was linear and orthotropic with the glass/Nylon
composite layed up as alternating 0˚ and 90˚ layers as shown in
Figure 2.5.2.2-3 to model a balanced woven fabric reinforcement. It was also assumed that the same 60
percent glass fiber by weight was put into both the stiffeners and the plate
and that both were 0.635cm thick.
Figure 2.5.2.2-3 Illustration
of Composite Layup
There were three boundary
conditions considered for the sine model.
They were defined with the unit cell clamped along one of the directions
with all degrees of freedom fixed (varying along the length and width of the
sample) and a fully fixed condition.
The idea of having all degrees of freedom fixed was to simulate the
modularization of the bus floor structure.


 (a) (b) (c)
There was little difference
between boundary condition (b)
and (c); however, boundary condition (a) proved to be an infeasible condition
for the loading conditions. The boundary
condition (c) was selected for
analysis with several wavelength options and the deflection results of the
modeling are shown in Figure 2.5.2.2-4.
Figure 2.5.2.2-4 Deflection vs.
Wavelength for the Sine Model
The mechanical and stress
analysis indicates that the sine model with 6.4cm sine rib height can give a
reasonable performance in this application.
The sine construction; however, does present a fabrication difficulty
relating the bonding of the flat sheet with the sine reinforcement
structure. A flattened sine structure is
proposed and analyzed in Section 2.5.2.4.
2.5.2.3
Isogrid Design Analysis
The design consists of a flat
panel top layer with square stiffeners aligned in an isogrid fashion at 60
degrees from each other. The stiffeners
could be stitched as a preform of glass or carbon and then VARTM or thermoformed
with a Nylon matrix.
The primary considerations of this design are dependent on (1) the stitching
of the isogrid construction to obtain a preform and (2) the nature of the overlapping
areas where ribs intersect. It is
possible to reinforce the ribs with a stronger material in a 3-dimensional
fashion by applying aramid stitching through the thickness of the ribs. The general elements of design are
illustrated in Figures 2.5.2.3-1 and 2.5.2.3-2.
Figure 2.5.2.3-1 Isogrid Panel
Design Elements

Figure 2.5.2.3-2 Isogrid Panel
Design Parameters
Optimization
Parameters
Geometry: Unit Cell 86.36 cm x 152.4cm
|
Models
|
Height (cm)
|
Distance (cm)
|
|
8
|
10
|
12
|
6
|
|
0.635
cm (thickness)
|
3.81
|
(iso 1)
|
(iso 2)
|
(iso 3)
|
(iso 4)
|
|
5.08
|
(iso 5)
|
(iso 6)
|
(iso 7)
|
(iso 8)
|
|
6.35
|
(iso 9)
|
(iso 10)
|
(iso 11)
|
(iso 12)
|
Table 2.5.2.3-1 Parameter
Combinations for Several Isogrid Models
Modeling assumptions were that the materials were linear and orthotropic
with a volume fraction of fiber of 60%.
The material used in isogrid stiffeners and plate were modeled as oriented
layers of 0º/90º Nylon/E-glass composite 0.635cm in thickness.
There are two boundary conditions
considered for the isogrid model “iso 1”.
Both of them involve the unit cell clamped along one of the directions
with all degrees of freedom fixed. This
is considering the worse case scenarios for the modeling with boundary
conditions (a) and (b).
The model with isogrid stiffeners exhibited inferior
performance in comparison to all other designs considered. Therefore detailed analyses were not
performed.
2.5.2.4 Flattened Sine (Hat)
The hat model is a variation of the
sine design concept. The flooring could
be produced by a VARTM or extrusion process and the ribs thermoformed or made
with a VARTM process. Another option would
be to VARTM everything at once. If the
ribs are separately thermoformed, then joining of the flat sheet and the
flattened sine components is necessary.
Therefore, the sine stiffener needed to be flattened out where it meets
the flooring for more effective joining. The joining area between the stiffener
and plate is increased which provides a larger surface area that will allow for
different joining mechanisms whether adhesive, mechanical or a combination of
both. Figures 2.5.2.4-1 and 2.5.2.4.-2
illustrate the concept of the flattened sine structure and design parameters.
Figure 2.5.2.4-1 General Schematic
of Flattened Sine Structure

Figure 2.5.2.4-2 Illustration of
Design Parameters that can be Optimized
Modeling of the flattened sine wave unit cell was performed under the
assumptions that the material was linear and orthotropic with the glass/Nylon
composite layed up as alternating 0˚ and 90˚ layers as shown in
Figure 2.5.2.4-3 to model a balanced woven fabric reinforcement. It was also assumed that the same 60
percent glass fiber by weight was put into both the stiffeners and the plate and
that both were 0.635cm thick.
Figure 2.5.2.4-3 Schematic
Model of Flattened Sine Layup Sequence
Several configurations of the
flattened sine structure were analyzed as shown in Table 2.5.2.4-1 with varying
rib height and wavelength of the ribs.
Table 2.5.2.4-1
List of Flattened Sine Ribbing Variations
The flattened sine was expected
to behave similar to the sine model, and therefore to obtain the trend of
deformation the fully fixed boundary condition was used. This is the closest one to the modular bus
floor application.
After the different geometries
were analyzed the results of the maximum deflection encountered and the maximum
stress encountered are presented in Figures 2.5.2.4-4 and 2.5.2.4-5
respectively. Based on the combination
of least deflection and lowest stresses the best model for the mold would be Hat6
with Hat10 as an alternative (refer to table for geometry parameters). The trend shows that the deeper the rib the
greater the stiffening it provides, with the limiting value being in the
processing. Therefore, the difference between
these two models is the depth of the sine wave.
Figure 2.5.2.4-4 Comparison of
Maximum Deflection for Sine-Hat Models as a Function of Height, Wavelength and
Contact Distance
Figure 2.5.2.4-5 Comparison of
Maximum Stress for Several Sine-Hat Models as Function of Height, Wavelength
and Contact Distance
Principal stress distributions
are illustrated in Figures 2.5.2.4-6 and 2.5.2.4-7 for the Hat6 and Hat10
combinations.
Figure 2.5.2.4-6 Principal
Stresses Distribution for Sine-Hat 6
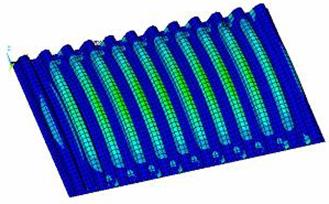
Figure 2.5.2.4-7 Principal
Stresses Distribution for Sine-Hat 10
The drawings of the two candidate
flattened sine structures are illustrated in Figures 2.5.2.4-8 and
2.5.2.4-9. These structural drawings
were used to design a two-part mold that will permit the fabrication of a bus
floor subcomponent by thermoforming or VARTM processes.
Figure 2.5.2.4-8 Dimensions for
Model Sine-Hat6
Figure 2.5.2.4-9 Dimensions for
Model Sine-Hat 10
2.5.2.5 Processing
Consideration and Shape Efficiency
Thermoforming, reactive
thermoplastic processing, extrusion and joining were identified as viable
processes for fabricating the floor component.
Under the constraints of the thermoforming and reactive processing
techniques, practical issues, such as tooling and flexibility, for prototype
studies were considered.
Studies by Evans and co-workers
(1999) have demonstrated the load efficiency of sandwich and integrated
structures at reduced weight. Budiansky
(1999) reported the shape efficiency of hat-stiffened and foam filled hat
stiffened structures over sandwich constructions for in-plane compression loads
(Figure 2.5.2.5-1). The structural
efficiency of composite rib structures including corrugated, hat-stiffened and
blade-stiffened structures was investigated by Swanson and co-workers
(1990). The effectiveness of
hat-stiffened structures for combined out-of-plane and in-plane loads was
established in their study.
Figure 2.5.2.5-1 Shape Efficiency of Hat Stiffened Structures
(Budiansky et al, 1990)
A modified hat-stiffened shape was chosen for the study and component
demonstration on an unit cell, as shown in Figure 2.5.2.5-2. Unlike conventional hat stiffening, sharp
edges were avoided, due to the limited flexibility of glass/PP woven tape form. The rationale for the modified hat-stiffened
design was as follows:
(a) For the face sheet, the choices available
to produce the top face sheet included use of woven consolidated tape, thermoformed face
sheet, VARTM face sheet, and possibly extruded face sheet
(b) For the ribbed portion, the choices available
to produce are the thermoformed profile, VARTM shaping, and/or extruded solid
(and or hollow) shape
(c) For the interface between the face sheet
and the ribbed portion, the possibilities include adhesive,
mechanical+adhesive, ultrasonic, and/or welded thermoplastic joints
Figure 2.5.2.5-2
Concept Modified Sine-Hat Stiffened Floor Part
The solid model of the floor
component was constructed in Pro/Engineer 2000i™. A detailed finite element analysis was
conducted in ANSYS 7.0™ to analyze the modified hat-stiffened (or hat-sine)
design. The hat-sine shape for the unit cell was optimized for three parameters:
·
Height of the sine
·
Contact length
·
The wavelength
Figure 2.5.2.5-1 summarizes the
parameters that can be varied. The
maximum deflection resulting from the parametric studies is shown in Figure
2.5.2.5-3. The trend shows that the
deeper the rib, the greater the stiffening it provides, considering processing
limitations. Based on the combination of least deflection and lowest stresses, the optimal
combination was determined to be HAT6 with HAT10 as an alternative (Table
2.5.2.5-1). The final component had dimensions of 63.5mm (2.5”) height, 127mm
(5”) wavelength, and 38.1mm (1.5”) contact.

Figure 2.5.2.5-3
Parameters of the Sine Rib Structure Studied in ANSYS
Table 2.5.2.5-1 Parameters of the
Sine-Hat Studied for ANSYS Analysis
The material was modeled as
Linear, Orthotropic, based on static tests conducted on tensile coupons of the
glass/PP consolidated tape form. The Shell 99, a standard ANSYS element, was
used for layered applications of a structural shell model. It usually has a
smaller element formulation time.
The element has six
degrees of freedom at each node and eight nodes as shown in Figure 2.5.2.5-4. It
has translations in the nodal x, y, and z directions and rotations about the
nodal x, y, and z-axes.
Figure 2.5.2.5-4 Details of
Shell 99 Element used in ANSYS
The woven glass/PP tape was modeled as a laminate of sequence of 0-90º plies. Figure 2.5.2.5-5 shows the lay-up used in the analysis. Figure 2.5.2.5-6 shows a meshed modified sine-hat stiffened
floor unit cell. The volume
fraction of the glass fiber was assumed at 40% and 60% respectively.
Figure
2.5.2.5-5 Laminate Sequence for Face and Rib Plies -
Woven Fabric Idealized as Cross-Ply
Figure 2.5.2.5-6
Meshed Modified Sine-Hat Stiffened Floor Unit Cell
The glass/PP material was also
used both in the face sheet and in the sine-hat stiffeners. The thickness of the laminated in each was
considered 6.35mm (0.25”) thickness. A variety of boundary conditions were
investigated. Two boundary conditions were
used: two ends simply supported and all ends fully fixed as shown in Figure
2.5.2.5-7. The loading conditions were
applied to check the component against the APTA guidelines. Loads in the form
of distributed pressure load across the unit cell, concentrated load at the
center, and a line load across the width of the unit cell were applied as shown
in Figure 2.5.2.5-8. The material
properties used in the modeling are shown in Table 2.5.2.5-2 and additional
details for the property calculations are provided in the Appendix.
Figure 2.5.2.5-7
Boundary Conditions Used in Analysis – Simply Supported on Two
Edges and Fully Fixed
Figure 2.5.2.5-8
Loading Conditions on Floor Unit Cell
(a) pressure loads, (b) concentrated load, and (c) line load

Table 2.5.2.5-2 Material Properties for Glass/Polypropylene used
in Analysis
(see
the Appendix for details)
Figures 2.5.2.5-9 through
2.5.2.5-13 provide the results of the stresses and
deflection for various loading and boundary conditions. Table 2.5.2.5-3 summarizes the same.
Figure 2.5.2.5-9
Stress and Deflection Profile for 6 mm Face
6mm Rib Thickness Fully Clamped Part subjected to 17kPa (2.5 Psi)
Pressure. The Maximum Stress was 147 MPa,
and Maximum Deflection was 5.6mm.
Figure 2.5.2.5-10
Stress and Deflection Profile for 6 mm Face
6mm Rib Thickness Simply Supported Part Subjected to 4500 N
(1000 Lbs) Concentrated Load. The Maximum Stress was 11.35 Mpa, and Maximum
Deflection was 10.41mm.
Figure 2.5.2.5-11
Stress and Deflection Profile for 9 mm Face
6mm Rib Thickness Simply Supported Part subjected To 4500 N
(1000 Lbs) Concentrated Load. The
Maximum Stress was 12.62 MPa, and Maximum Deflection was 0.963mm.
Figure 2.5.2.5-12
Stress and Deflection Profile for 9 mm Face
6mm Rib Thickness Fully Clamped Part subjected to 4500 N
(1000 Lbs) Concentrated Load. The
Maximum Stress was 19.31 MPa, and Maximum Deflection was 0.92mm.
Figure 2.5.2.5-13
Stress and Deflection Profile for 9 mm Face
6mm Rib Thickness Simply Supported Part subjected to 9000 N
(2000 Lbs) Line Load. The Maximum Stress
was 1210 MPa, and Maximum Deflection was 0.81mm.
Table 2.5.2.5-3 Loading, Boundary Conditions, Maximum
Deflection and Maximum Stress
2.5.3 Comp
onent Testing and Analysis
The unit cell floor component was
tested on a 50,000 lbs (222,954 N) load capacity frame. The detailed Pro/Engineer™ drawing and the
corresponding part are shown in Figure 2.5.3-1. A steel frame was designed and
constructed to accommodate the unit cell component for different boundary
conditions such as simply supported on all sides, or two sides. Figure 2.5.3-2 provides details of the test
setup. A linear variable differential
transformer sensor (LVDT) was adopted for monitoring the deflection under the
face sheet as shown in Figure 2.5.3-3.
Typical load-deflection curves for the tested components are shown in
Figure 2.5.3-4.
Figure 2.5.3-1
Detailed Drawing and Finished Part
Figure 2.5.3-2 Component Testing
Load Frame and Part
Close-up Showing Support Frame
Figure 2.5.3-3 Additional Component Test Details
LVDT and Load Frame


Figure 2.5.3-4 Load-Deflection
Curves Tested Samples
(a) concentrated loads, and (b)line load
In discussion with NABI it was
pointed out that the GVWR is defined as the maximum total weight, as determined
by the vehicle manufacturer, at which the vehicle can be safely and reliably
operated for its intended purpose was approximately 13,636kgs (30,000
lbs). This results in approximately 3500
Pa (0.5 psi ) on the entire floor, which is less than the design load of 4860 Pa (0.7 psi) for the sine wave floor
subcomponent.
Table 2.5.3-1 provides details of
the weight calculation on conventional floor.
Figure 2.5.3-5 provides details of the weight of a conventional floor
unit cell, including details of the cross-section used to make up various
portions of the floor. The conventional
floor unit cell weighed 27.34kgs. Figure
2.5.3-6 shows the composite floor component, which meets the design requirement
of APTA. The weight of the composite unit
cell floor was 21.31kgs (see Table 2.5.3-2), a 22% weight savings in comparison
to the conventional floor.
Table 2.5.3-1 Conventional Floor
Unit Cell Weight Calculations
Figure 2.5.3-5
Conventional Floor
Details of Unit Cell and Cross-Section of the Three Major
Elements (see Table 2.5.3-1 for corresponding Elements)
Figure 2.5.3-6 Flattened Sine Composite Floor Design
Figure 2.5.3-7 provides the
general layout of all steel frame
members used on a major portion
of the conventional floor along with the 0.75” (38.1mm) plywood
floor. The total estimated weight of
this major portion including the plywood (189kg) and steel frame (367.55kg) is
556.6kg (Table 2.5.3-3); the corresponding composite floor is 323.1kg (Table 2.5.3-4),
an overall 41% weight reduction for the
major floor. Figure 2.5.3-8provides
the details of the sine hat stiffened floor made of thermoplastic composite
material.
Figure 2.5.3-7
Details of Plywood and Welded Frame Structure
(Major Section of Conventional
Floor)

Table 2.5.3-2 Composite Floor
Weight Calculation

Table 2.5.3-3 Weight
Calculations for Major Section of Conventional Floor
Table 2.5.3-4 Weight Calculation for Major Section of Floor made from
Sine-Hat Stiffened Composite
Figure 2.5.3-8
Details of Sine-Hat Stiffened Floor
(Major Section of
Composite Floor)
Considering that the width of the
bus is 2590mm (102”), approximately
three and half unit cells (the dimension of 736mm (29”) running across the
width) would make up a section. Based
upon the experience gained in manufacturing the unit cell using glass/PP tape
by thermoforming process, it would easy to scale up to make a complete 736 mm
(29”) x 2590mm (102”) component, that
would be readily assembled and disassembled.
An analysis was conducted to estimate the maximum deflection for the
component dimension of 736mm (29”) x 2590mm (102”), if this were to be the case. Figure 2.5.3-9 shows the results from the
analysis. A maximum deflection of 48.6mm
(1.915”) was obtained, which exceeds the allowable deflection by APTA
standards. For such cases, additional
profiled fiber frame would be added to contain the deflection.
Figure 2.5.3-9 Deflection Analysis assuming Unit Cell is Extended across
Entire Width of the Floor (736 Mm (29”) X 2590 Mm (102”))
Additional Concepts for
Modularization
Several concepts are proposed to
extend the modularity and ease of replacement /repair and (Figure 2.5.3-10 and
Figure 2.5.3-11), multi-functionality such as wire-and rods routing (Figure
2.5.3-12), sound and vibration absorption potential (Figure 2.5.3-13) by foam
insertion into the hollow spaces of the sine ribs, integrated upper body and
lower body along with floor panels (Figure 2.5.3-14). In addition containment of bottom deflection
can be readily done by longitudinal unidirectional carbon/PP fibers running
through the bottom, which are co-molded with the glass/PP fibers. Studies by Budiansky (1990) have shown that
thin sandwich plates in conjunction with hat stiffening provides further weight
reduction potential, for similar load indices.
Figure 2.5.3-10
Modularization Concept of Composite Unit Cells making up Floor
Structure
Figure 2.5.3-11
Modularization Concept of Composite Unit Cells making up Floor
Structure, and Extending across Entire Width
Figure 2.5.3-12
Modularization Concept in Longitudinal Direction, Incorporating
Wires and Rod Routing (Integrated Multifunctional Features)
Figure 2.5.3-13
Modularization Concept in Longitudinal Direction, Incorporating
Foam Filling for Sound and Vibration Damping (Integrated Multifunctional
Features)
Figure 2.5.3-14 Modularization Concept in Integrating
Upper Frame Skeleton to Continue through Bottom of Floor. The Skeleton is made of Carbon Fiber Profiled
Shapes.
3. Future Work
The successful 40 percent
reduction in cost and weight of the composite floor design made during this
year’s effort lays the groundwork for a future integrated bus floor, frame and
side subcomponent. The structural interdependence
of these three components requires that the replacement composite design be
carefully designed as an integrated concept before technology transfer can be
reasonably considered. It is
anticipated that further thermoplastic composite material and processing
development will continue along with the design, fabrication and testing of the
next level of lightweight bus structures.
Reference
G.D.Swanson, Z.Gurdal, J.H.Starnes, Jr., Structural Efficiency of
Graphite/Epoxy Aircraft Rib Structures., Journal of Aircraft, Vol. 27, No. 12,
Dec 1990, pp. 1011-1020.
B.Budiansky., On the Minimum Weight of Compression Structures, Int. J of Solid Structures, 36, 3677-3708,
1999.
A.G.Evans, J.W.Hutchinson, N.A.Fleck, M.F.Ashby, H.Wadley., The
Topological Design of Multifunctional Cellular Materials., Progress in
Materials Science, Vol. 43, 1999.
Appendix
Details of material properties used in calculations
To determine the properties of
the composite, the theory for uniaxially aligned fibers in a composite was used
to determine the properties of the composite in the different
orientations.
|
For uniaxially aligned fibers
|
|
Properties of Matrix (Polypropylene)
|
|
Properties of Fiber (E-Glass)
|
|
Calculating the material properties for a lamina
|
|
Volume fraction of fiber and matrix
|
|
Determining the Bulk Elastic Constants of Lamina
|
Glossary and Abbreviations
APTA American Public Transportation Association
AF Adhesive
Failure
ASTM American
Society of Testing and Materials
BOI Blunt
Object Impact
c-PBT Cyclic
polybutylene terephthalate polymer
Copolymer Combination
of two or more polymers into one molecular chain
DRIFT Trade name for a
directly reinforced thermoplastic composite
material
DSC Differential
Scanning Calorimetry
Dynatup Trade
name for an instrumented falling dart impact test
E glass Common
grade of fiberglass used in commodity composites
Falling dart test Impact
test defined in ASTM standard D-3029
FRP Fiber
reinforced polymer
GMT
Glass mat thermoplastic composite
GVWR
Gross vehicle weight rated
High melt flow Polymer
with melt flow index greater than 50 g/10 minutes
Homopolymer Polymer
consisting of similar subunits in the molecular structure
IVBOI Intermediate
velocity blunt object impact
Izod test Impact
test defined in ASTM standard D-256
Longitudinal Sample
orientation in the direction of predominant fiber orientation
LVDT
Linear differential variable transformer
LVI Low
velocity impact
NABI North American Bus, Inc.
Glossary and
Abbreviations (continued)
PA Nylon, polyamide
PBT Polybutylene
terephthalate
PP Polypropylene
Random Material
with fiber orientation equal in all directions
SEM Scanning
electron microscope
SF Substrate
failure
SiC Silicon
carbide
SMA Styrene
maleic anhydride modified
SRI Southern
Research Institute
Size Coating applied to
fiber bundles to assist with respect to handling and surface compatibility
TPU Thermoplastic
polyurethane
Transverse Sample
orientation orthogonal to predominant fiber orientation
UAB University
of Alabama at Birmingham
UTS Ultimate
tensile strength
VARTM Vacuum assisted resin
transfer molding