
Monroe County New York ITS Camera Deployment & Systems Integration
PDF Version 1.3MB
Final
August 2006
P.I.N.4ITV.09.121 - Evaluation

Photo credits: Bergmann Associates Photo credits: Bergmann Associates
Prepared By:
Bergmann Associates
200 First Federal Plaza
28 East Main Street
Rochester, NY 14614
www.bergmannpc.com
Prepared For:
Monroe County Department of Transportation
6th Floor, City Place
50
West Main Street
Rochester, NY 14614
www.monroecounty.gov
Table of Contents
1.0 INTRODUCTION AND BACKGROUND
2.0 EVALUATION PLAN AND RESULTS
Evaluation Objective #1: Quantify changes in incident response time
Evaluation Objective #2: Quantify traffic flow impacts of changes in incident response
Evaluation Objective #3: Describe intangible benefits of increased surveillance ability
3.0 CONCLUSION AND LESSONS LEARNED
List of Exhibits
Exhibit 2: Phase 1 CCTV Camera Locations
Exhibit 4: Evaluation Goals and Objectives
Exhibit 5: Evaluation Objectives and Measures of Effectiveness
Exhibit 6: NYSDOT CCTV Camera Locations
Exhibit 7: MCDOT Traffic Monitoring Process with CCTV Cameras
Exhibit 8: Incident Log Summary
Exhibit 9: Sample System Sensor Data Plot
Exhibit 10: Synchro Model of Mount Hope Avenue
Exhibit 11: SimTraffic Model for Mount Hope Avenue
Exhibit 12: Increase in Total Network Travel Time vs. Delay in Initial Response
Exhibit 13: Increase in Total Network Delay vs. Delay in Initial Response
Exhibit 14: Increase in Total Network Fuel Consumption vs. Delay in Initial Response
Exhibit 15: Assumed Incident Response and Validation Timeline
Exhibit 16: SimTraffic Results for Incident Case Study
Exhibit 17: Estimated Cost Savings due to CCTV Use
Exhibit 18: Estimated Cost Saved by Facilities Sharing and Integration
Exhibit 19: Assumed Routing for CCTV Cameras without Facilities Sharing
Exhibit 20: Summary of Findings
List of Appendices
Appendix A: Sample Incident Log and Instructions
Appendix B: Incident Log Summary Spreadsheet
Appendix C: Case 9 Volume and System Sensor Plots
Appendix D: Equipment Location Map
Appendix E: Microsimulation Modeling Backup
Executive Summary
|
Phase 1 MCDOT CCTV Camera Locattions
|
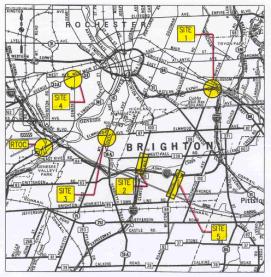
The Monroe County Department of Transportation (MCDOT) has built upon the success of its first computerized traffic signal system. The system has been operational since 1985. In the late 1990s the Department initiated a project to integrate Intelligent Transportation Systems (ITS) technologies into the traffic management infrastructure in an effort to improve operations throughout the City of Rochester and along the countys arterial roadways. The Regional Traffic Operations Center (RTOC) was opened in 2002 as a direct result of that effort.
Until recently the MCDOT lacked real-time visual traffic surveillance capability at that facility. This need is being addressed under the ITS Camera Deployment & Systems Integration Project. During the projects first phase, 5 CCTV camera deployments were made. Installation began in September 2004 with construction and acceptance testing completed in February 2005. A 120 day observation and test period followed. The initial deployment locations are given below:
- East Avenue/Winton, University/Winton, and Winton/Norris Drive/I-490 Interchange
- Westfall Road and South Clinton Avenue
- Elmwood Avenue and Mt. Hope Avenue
- West Main Street and Brown Street / Genesee Street / Chili Avenue
- Winton Road/Erie Canal Bridge
These 5 locations cover 7 of 32 High Priority intersections around the county. They provide balanced coverage on the west, south, and east sides of the City of Rochester and the Town of Brighton. They also compliment the existing ORorke Bridge cameras along with the New York State Department of Transportations (NYSDOT) CCTV system and its planned extensions.
The primary objectives of the initial MCDOT CCTV deployments were to:
- Facilitate incident management
- Facilitate traffic signal management
- Enhance intersection monitoring
- Advance integration with other agencies
The secondary objectives were to:
- Blend in well aesthetically with existing streetscapes
- Effectively use the existing communications infrastructure within the County
- Verify weather conditions (visually) and possibly communicate with motorists
The project involved the integration of new field devices with existing legacy systems in use by various agencies. This was a requirement to obtain Federal funding and supported integration goals set forth by the NYSDOT Advanced Traffic Management System (ATMS). Monroe Countys new field devices utilize an existing network of fiber optic lines owned by the NYSDOT and Monroe County Pure Waters (MCPW) for communication to the RTOC. Because the MCDOT and NYSDOT operate side by side in the RTOC, the NYSDOT can easily access camera images from the county and vice versa.
ITS evaluations assist those responsible for funding, development, design, and deployment in understanding the impact and effect of ITS on transportation users by quantifying the benefits, helping guide future investment decisions, and generating future improvement strategies. The information gathered serves not only to justify expenditures, but help those involved understand why and under what conditions benefits are realized. The MCDOT ITS Camera Deployment & Systems Integration Evaluation employed a combination of qualitative and quantitative measures to assess the effectiveness and benefits derived from Monroe Countys 5 initial CCTV deployments.
An evaluation team was assembled to carry out and review the study. An evaluation plan was developed to identify the impact, if any, the monitoring capability established by the installation of CCTV cameras has had on the management of intersection traffic and to identify the benefits and/or costs, monetary and functional, experienced as a result of the system integration plan. Performance measures were developed and a data collection plan was set in motion to gather the necessary information.
Operators at the RTOC maintained a log book, keeping track of incident milestones and describing their actions from October 2005 through February 1, 2006. The log entries suggest incident management was facilitated by the CCTV cameras. Operators were able to validate incidents more quickly than they could have at locations with system sensors alone and without on-site observer. In general, validation of incidents took place within4 minutes. Operators were also able to reverse any changes they made to signal timings within5 minutes of an incidents conclusion. This is in contrast with the 10 minutes needed, on average, to validate incidents at locations with only system sensors present and the 15 or more minutes needed when an observer must be dispatched to the scene. Incident validation times were reduced by 50% to 80% saving between 5 and 12 minutes per incident.
Using one specific incident as a case study, system sensor data were plotted and a microsimulation model was used to quantify the benefit of a quick response. During the incident modeled, signal timings had been modified in response impending gridlock on an arterial street. The simulation test results indicate that for every minute of delay in reacting to the incident (i.e. changing the timings), the total travel time, total delay, and total fuel consumption within the affected area would have increased by 3% to 5%. Assuming the initial 5 CCTV installations have allowed operators to react at least 5 minutes quicker than they could with system sensor information alone, that this is a representative incident, and that the MCDOT system is well instrumented with system sensors, the extrapolated annual savings to the traveling public would pay for the entire $280 thousand dollar project in approximately 5 years. In the future, the county could recover costs more quickly for similarly priced CCTV installations in incident prone areas without system sensor coverage.
Operators were interviewed to solicit their personal experiences after the incident data collection period. It was clear from the interviews that the operators believe CCTV cameras have made their jobs easier, allowing them to improve the speed and quality of the service delivered to the public. They feel their responses are better informed with visual information and they have increased confidence in the appropriateness of their actions. Use of the CCTV cameras outside the realm of incident response was also discussed. Since installation, the cameras have been used for coordination of non-interconnected traffic signals, verification of trouble calls, and routine observation of field signal timings. Suggestions for improvement include an ability to monitor more than one opposed intersection approach at a time, improved night time vision, and enhanced navigation tools.
Interagency coordination and system integration involved compromises contributing to the overall success of the project. The NYSDOT has shared an existing video switch with the MCDOT in return for use of a future switch to be installed in the RTOC by the county. Monroe County Pure Waters (MCPW) has dedicated spare fibers in its local trunk lines to the MCDOT cameras, although they required initially that all splices be made by their own forces in order to protect the existing facility. All occupants of the RTOC are involved in developing a Concept of Operations Plan, defining the roles and responsibilities of each agency within its shared environment. Overall, a high level of interagency commitment spanning all levels of the involved agencies has come to provide the traveling public with a coordinated expressway and arterial traffic management system.
The MCDOT ITS Camera Deployment & Systems Integration project involved the sharing of facilities among the MCDOT, NYSDOT, and Monroe County Department of Environmental Services (MCDES) to save unnecessary costs. Shared facilities were identified and used to estimate the increase in contract cost had integration not occurred. The results suggest that phase ones $280 thousand dollar construction cost might have risen to nearly $2 million had it been necessary to install entirely new conduit, pullboxes, fiber optic cable, separately purchase modems, and furnish a stand alone video switching device.
Summary of Findings
|
Objective |
Findings |
|
Quantify changes in incident response time. |
|
|
Quantify traffic flow impacts of changes to incident response. |
|
| |
|
Describe intangible benefits of increased surveillance ability. |
|
| |
| |
| |
|
Identify the benefits and/or drawbacks of interagency coordination and system integration. |
|
| |
| |
| |
|
Quantify the savings and/or costs realized due to the sharing of facilities. |
|
Finally, among the lessons learned during the evaluation process are the following:
- It is advisable to remain flexible when performing an ITS evaluation. An evaluation team may find that the data collected does not meet every expectation made prior to study, however that data can be just as useful in different ways given a modified approach.
- The traveling public can benefit from enhanced service at reduced cost when agencies cooperate and willingly share their facilities for the good of all involved.
- The experiences and comments of transportation management center staff that use traffic monitoring cameras each day to serve the traveling public are the greatest indicators of the value of the visual information provided by the CCTV camera installations.
1.0 Introduction and Background
Since 1985, the Monroe County Department of Transportation (MCDOT) has built upon the success of its first computerized traffic signal system. In the late 1990s the Department initiated a project to integrate Intelligent Transportation Systems (ITS) technologies into the traffic management infrastructure in an effort to improve operations throughout the City of Rochester and along the countys arterial roadways. A direct result of that effort, the Regional Traffic Operations Center (RTOC), was opened in 2002. The RTOC is a joint transportation facility financed by the Monroe County Department of Aviation (MCDA), MCDOT, and the Federal Highway Administration (FHWA). Today RTOC tenants include the MCDA, MCDOT, New York State Department of Transportation (NYSDOT), and New York State Police (NYSP).
|
|

The NYSDOT, MCDOT, and NYSP share a common area for dispatch and system monitoring functions. A large video display wall serves as its centerpiece. This display visually integrates each agencys respective systems. One specialty of the RTOC is highway incident and emergency response. The NYSP are the primary response unit for expressway related incidents while the NYSDOT and MCDOT each have deployable resources and remote control of traffic signals and highway message signs. Together, the team provides on-site investigation, maintains traffic flow both at the scene and on adjacent routes, and disseminates information as needed to ensure a high level of public safety.
While the NYSDOT had earlier deployed closed circuit television (CCTV) cameras covering major expressways throughout the region, until recently the MCDOT lacked similar real-time visual capability. To address this need, the MCDOT undertook the ITS Camera Deployment & Systems Integration Project. This effort studied the feasibility of installing various ITS devices to improve its traffic management service to the community, including closed circuit television (CCTV) cameras, dynamic message signs (DMS), and highway advisory radio beacons (HARB). The first portion of the project, dubbed Phase 1, involved the following tasks:
- Identifying priority locations to install the various ITS technology
- Performing a communications needs assessment for implementing the technology
- Developing an integrated and functional control system for operating the devices
- Designing the first ITS device deployments and integration with other agencies.
- Planning the ITS device deployments to be done in subsequent project phases.
The MCDOT selected Bergmann Associates, in association with Gardner Engineering of NY/Siemens ITS, and Fisher Associates for the analysis and design tasks. The design team recommended initial installation of 5 CCTV deployments in Monroe County. The locations of those initial deployments were as follows:
- East Avenue/Winton, University/Winton, and Winton/Norris Drive/I-490 Interchange
- Westfall Road and South Clinton Avenue
- Elmwood Avenue and Mt. Hope Avenue
- West Main Street and Brown Street / Genesee Street / Chili Avenue
- Winton Road/Erie Canal Bridge
|
Exhibit 2: Phase 1 CCTV Camera Locations
|

These 5 camera locations cover 7 of 32 High Priority intersections identified by the greater project. They provide balanced coverage on the west, south, and east sides of the City of Rochester and the Town of Brighton. They also compliment the existing ORorke Bridge cameras along with the NYSDOT CCTV system and its planned extensions.
Plans, specifications, and an estimate were completed for Phase 1 of the project and made available for contractor bidding in June 2004. The project was awarded to Crane Hogan Structural Systems Inc. ($279,338.10) for construction. Installation began in September 2004, followed by acceptance testing in January and February of 2005. The project was complete and accepted by the MCDOT in February 2005 with operation beginning shortly thereafter. A 120 day observation test period followed and concluded in August 2005.
A key element of the project involved the integration of new field devices with existing legacy systems in use by the various agencies. This was a requirement to obtain Federal funding. The project supported integration goals set forth by the NYSDOT Advanced Traffic Management System (ATMS). Monroe Countys new field devices utilize an existing network of fiber optic lines owned by the NYSDOT and Monroe County Pure Waters (MCPW) for communication to the RTOC. Because the MCDOT and NYSDOT operate side by side in the RTOC, the NYSDOT can easily access camera images from the county and vice versa.
The primary objectives of the initial MCDOT CCTV deployments were to:
- Facilitate incident management
- Facilitate traffic signal management
- Enhance intersection monitoring
- Advance integration with other agencies
The secondary objectives were to:
- Blend in well aesthetically with existing streetscapes
- Effectively use the existing communications infrastructure within the County
- Verify weather conditions (visually) and possibly communicate with motorists
As stated in ITS Benefits: Review of Evaluation Methods and Reported Benefits from the Texas Transportation Institute, evaluation of ITS deployments plays a key role in gathering information for ITS deployment, planning, and implementation. An ITS evaluation assists those responsible for funding, development, design, and deployment in understanding the impact and effect of ITS on transportation users, quantifying the benefits, helping guide future investment decisions, and in generating future improvement strategies. As noted in the United States Department of Transportations (USDOT) ITS Evaluation Guidelines ITS Evaluation Resource Guide, comprehensive evaluations often employ both quantitative and qualitative measures. Any information gathered should serve not only to justify expenditures, but help those involved understand why and under what conditions benefits are realized.
This report documents an evaluation of the effectiveness of Monroe Countys 5 initial CCTV deployments and the results of that investigation. It is organized into 3 sections. The evaluation plan and findings are described in Section 2. The report concludes in Section 3 with a summary the evaluation findings, conclusions, and lessons learned during the project.
2.0 Evaluation Plan and Results
The United States Department of Transportation (USDOT) ITS Evaluation Resource Guide recommends the following step by step process for an ITS evaluation.
- Form an evaluation team
- Develop the evaluation strategy
- Develop an evaluation plan
- Develop one or more test plans
- Collect and analyze data and information
- Prepare a final report
Section 2 discusses the development of items 1 through 4 for the MCDOT ITS Camera Deployment & Systems Integration Evaluation.
2.1 Evaluation Team
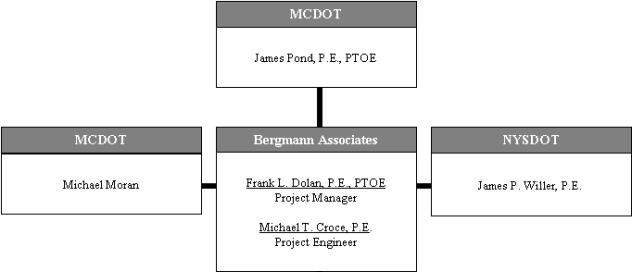
An evaluation team (see Exhibit 2.1) was assembled to carry out the study. Each member is experienced and knowledgeable in the areas of traffic management and analysis.
Jim Pond of the MCDOT functioned as Project Manager, coordinating the efforts of the consultant team and advisors. Frank Dolan of Bergmann Associates led the consultant team. He was responsible for overall project management and the oversight of all project specific work tasks. Michael Croce of Bergmann Associates, the project engineer, was directly involved in the collection, analysis, and summary of data.
The consultant team was assisted by Michael Moran of the MCDOT. Michael is a Senior Traffic Control Operator for Monroe County and is stationed at the Regional Traffic Operations Center (RTOC). He assisted with data collection and review. Luba Ellison and Joe Ellison, also MCDOT RTOC staff, assisted with the data collection effort.
Jim Willer, the NYSDOT Region 4 ITS Coordinator, functioned as a technical advisor, providing critical review of all project deliverables and helping to ensure a credible and objective evaluation was performed.
2.2 Evaluation Goals and Objectives
To be effective, the CCTV deployment evaluation concentrated on a few key measures of effectiveness with detailed and focused study. This approach was preferred to summarizing a wide range of topics while not addressing any in substantial detail. The evaluation focused on providing adequate information regarding the parameters used and scenarios examined. The intent was to demonstrate a clear cause and effect relationship between the investments made and the results observed, if any.
To satisfy these guiding principles, two evaluation goals were developed:
- Identify the impact, if any, the monitoring capability established by the installation of CCTV cameras has had on the management of intersection traffic operations before, during, and after periods of incident management.
- Identify and summarize the benefits and/or costs, both monetary and functional, experienced as a result of the projects formal integration plan.
For each of these broad evaluation goals, several detailed objectives were identified. The objectives comprise the framework of the evaluation. The relationship of each detailed objective to its specific goal is summarized in Exhibit 4.
Exhibit 4: Evaluation Goals and Objectives
|
Evaluation Goal |
Evaluation Objective |
|
Identify the impact, if any, the monitoring capability |
l Quantify changes in incident response time. |
|
established by the installation of CCTV cameras has |
l Quantify traffic flow impacts of changes to incident |
|
had on the management of intersection traffic |
response. |
|
operations before, during, and after periods of |
l Describe intangible benefits of increased |
|
incident management. |
surveillance ability. |
|
Identify and summarize the benefits and/or costs, |
l Identify the benefits and/or drawbacks of |
|
both monetary and functional, experienced as a |
interagency coordination and system integration. |
|
result of the projects formal integration plan. |
l Quantify the savings and/or costs realized due to |
|
the sharing of facilities. |
2.3 Performance Measures
Exhibit 5 summarizes the specific measures of effectiveness (MOE) used to conduct the study. The measures of effectiveness were designed to satisfy the evaluation goals stated in Section 2.2. As shown, one or more measures of effectiveness were chosen to assess each objective. Quantitative measures were employed when possible, but there are instances when a qualitative analysis was more appropriate. Data related to the measures of effectiveness were collected between fall 2005 and spring 2006. This allowed the CCTV camera system to undergo a suitable break-in period prior to the start of the study.
Exhibit 5: Evaluation Objectives and Measures of Effectiveness
|
Evaluation Objective |
Measures of Effectiveness |
|
1. Quantify changes in incident response time. |
|
| |
| |
|
2. Quantify traffic flow impacts of changes in |
l Change in system sensor occupancy |
|
incident response. |
l Change in system sensor volume |
|
3. Describe intangible benefits of increased |
l Perceived change in ability of RTOC staff to |
|
surveillance ability. |
monitor and adapt to changing traffic conditions |
|
and incidents | |
|
4. Identify the benefits and/or drawbacks of |
l Issues introduced by interagency cooperation |
|
interagency coordination and system integration. |
l Compromises made by stakeholder agencies |
|
l Results perceived to hamper desired operations | |
|
l Results perceived contributing to project successes | |
|
5. Quantify the savings and/or additional costs |
l Difference between cost as installed and estimated |
|
realized due to the sharing of facilities. |
cost without system integration |
2.4 Test Plan for Data Collection
Incident data was collected using all five of the initial MCDOT CCTV camera installations. It was the original intention of the study to restrict CCTV data collection to these locations. However, prior to the start of data collection, the pool was expanded to include all local NYSDOT camera locations (Exhibit 6) in an effort to improve the incident capture rate and the quantity of data collected.
|
Exhibit 6: NYSDOT CCTV Camera Locations
|

In addition, data was collected for null locations where system sensors were available but CCTV cameras were not present. Data was collected for all incidents recorded by those participating in the data collection effort occurring during the evaluation period regardless of location. This was also to improve the rate of incident capture rate.
| Evaluation Objective #1: Quantify changes in incident response time |
At locations without CCTV cameras, RTOC system operators generally rely on output from system sensors (inductance loops) installed upstream on intersection approaches. Sensor occupancy, in terms of a percentage, is monitored to indicate signs of trouble. High occupancy is indicated graphically on the operators screen via colored arrows. When a high occupancy appears, a process is set in motion to determine the source of the reading. This involves making phone calls, checking 911 logs, and listening to the scanner to verify that indeed an incident has occurred. System sensor occupancy is monitored continuously for affected locations and others nearby. In the absence of corroborating accounts from the field and with continued high system sensor occupancy, operators will attempt to make appropriate traffic signal timing adjustments from the RTOC. This process takes approximately 10 minutes from event registration to validation/action. From that point, monitoring and traffic signal timing changes continue until readings return to normal.
When no authorities or crews are on scene to observe a situation or system sensors are not present, understanding the incident cause and conditions requires an observer to be dispatched to the scene. According to MCDOT staff, it commonly takes 15 minutes for a vehicle dispatched from the RTOC to reach a scene depending on the incident location and traffic conditions. In extreme cases, it may take 25 to 30 minutes for an observer to reach the scene and return valuable information on conditions in the field. Corrective action can be taken as necessary once the nature of the incident has been determined. This may come, for example, in the form of a change in traffic signal timing or phasing made in the field. The change may also be made from the RTOC. Revisions would remain in effect until the incident has concluded
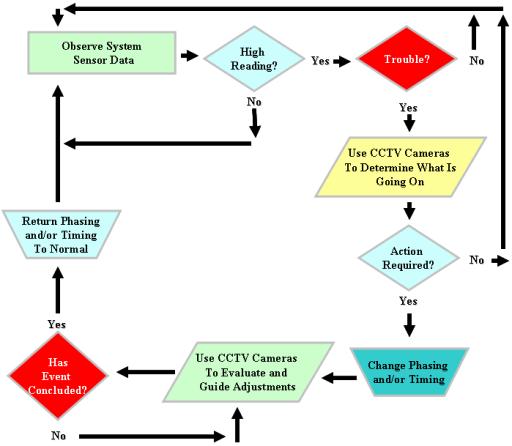
The process by which the MCDOT manages traffic signal system responses to incidents with its CCTV cameras is summarized in Exhibit 7. At an intersection with CCTV camera coverage, the operator uses the video equipment to observe the conditions and cause. They may then modify traffic signal timing and/or phasing appropriately. They will continue to evaluate and adjust those changes to optimize the response using the camera. Finally, the camera is used to determine when the incident has concluded, allowing the operator to return the signal system to normal operation.
The hypothesis for evaluation objective number one is that the presence of CCTV cameras at an intersection experiencing an incident or diversion allows an RTOC operator to respond, assess, mitigate, and return operations to normal more quickly.
The following measures of effectiveness were proposed to measure changes in response time.
Measures of Effectiveness
Change in time between identification
and validation
Change in time to recognize validity of an incident (e.g., is
a signal stuck in red?)
Change in time to return to normal operations
after event conclusion
To test the hypothesis, participating MCDOT operators were asked to maintain a log book, keeping track of these response milestones when an incident or diversion took place. A sample log sheet and the instructions given to the operators are contained in Appendix A.
Exhibit 7: MCDOT Traffic Monitoring Process with CCTV Cameras
Sample Size:
- Response times were logged by participating observers for all incidents or diversion events affecting streets or arterial roadways between October 19, 2005 and February 1, 2006 at both the CCTV and null sites.
Assumptions:
- It was assumed that at least one incident or diversion would take place within the designated data collection period. A total of 26 incidents were recorded during the data collection period.
Data Collection Methods and Tools:
- Data was collected by each MCDOT operator using a log book.
- The data were entered into a spreadsheet for analysis, comparison, and summary. A brief summary of the incidents is contained in Exhibit 8. A more detailed summary spreadsheet is presented in Appendix B.
Data were recorded for a total of 26 incidents affecting streets or arterial roadways during the collection period. Overall the time to validate an incident using a CCTV camera, regardless of the method by which it was initially reported, was less than 4 minutes. On average it took 1 minute to verify that an incident was true with a CCTV camera, regardless of the method by which it was reported.
Of the 26 recorded incidents, 3 occurred at locations without a CCTV camera. Of those, two (cases 2 and 3) included complete response time data. In case 2, the operator relied only upon reports from a NYSDOT crew for notification and verification. In case 3 the initial notification came from a NYSDOT crew but the incident was verified with a system sensor reading. The logs indicate both of these incidents were considered validated immediately upon notification. In each case, the operator had the benefit of a crew on location for eyewitness account, speeding the response.
Of the 26 recorded incidents, 24 were classified by the operator as true or false. Of the 24 events, 22 were classified as true. Neither of the 2 false alarms occurred at locations without CCTV camera coverage.
The first false call (case 13) involved the 911 website reporting a crash at the intersection of Winton Road and University Avenue. The operator used the East/Winton/University/Norris/I-490 camera to verify that there was indeed no accident at or near the intersection within 3 minutes.
A complaint of unsynchronized traffic signals along Winton Road generated the second false call (case 15). The operator used the Winton/Erie Canal camera to observe the progression and coordination. Observed conditions were compared at the RTOC against the proper timings for that period. Within 3 minutes the operator verified that the traffic signals were operating correctly. In this case, the camera saved the need for a field visit. Travel time from the RTOC to the Winton Road exit of I-590 would take approximately 6 to 8 minutes each way during the evening peak (perhaps longer from other, more remote starting points). In addition, the involvement of a second agency to gain confirmation was avoided in this case as the Winton Road and I-590 interchange traffic signals are operated by the NYSDOT.
The time between incident validation and the first response is dependent upon the nature and severity of the incident. For example, in case 18 a crash involving 2 vehicles was identified at the intersection of Mount Hope Avenue and Elmwood Avenue at 7:13 AM on December 29, 2005. Action, in the form of traffic signal timing changes, was not necessary until 7:48 AM as traffic began to back up to Crittenden Boulevard under the load of morning peak hour volumes. The 35 minute gap does not reflect a failure to act quickly, but rather an appropriate timing of the response based on the needs of traffic as observed with a CCTV camera. In 4 of the 9 recorded incidents, (Cases 9, 10, 12, and 16), the operator observed traffic already backed up at a surface street intersection using a CCTV camera and the action taken was to modify traffic signal timings from the RTOC. The times between verification and action were 0, 2, 13, and 1 minute, respectively.
Considering only incidents where a signal timing change was made and the conclusion was confirmed via CCTV camera, seven cases (4, 9-12, 16, and 18) contained useful data on the time of confirmed conclusion and a return to standard operation. The time between these two points varied from less than 1 minute to a maximum of 5 with an average of approximately 2 ½ minutes. In case 18, the operator was able to see the 2 vehicles involved in the crash removed from the intersection at 7:55 AM, observe traffic flow returning to normal around 8:03 AM, and end the modified timing scheme at 8:04 AM.
Therefore, in cases where no observers were immediately on scene, CCTV cameras allowed RTOC operators to validate incidents quickly. Incident validations within the study period took 4 minutes or less. CCTV cameras allowed operators to identify false alarms within 3 minutes. When an incident conclusion was verified with a CCTV camera and the corrective action had been a change in traffic signal timings, operators were able to return the system to normal operation within 5 minutes of the incidents conclusion. These timeframes are shorter than the reported 10 minutes to corroborate system sensor data and 15 or more minutes expected to dispatch someone to the scene. Thus, incident validation times were reduced by 50% to 80% saving between 5 and 12 minutes per incident.
| Evaluation Objective #2: Quantify traffic flow impacts of changes in incident response |
The hypothesis for evaluation objective number two states that the use of CCTV cameras to monitor traffic during incidents and diversions and guide adjustments improves traffic operations.
The following measures of effectiveness were initially proposed to measure the traffic flow impacts of incident response:
Measures of Effectiveness
Change in system sensor occupancy
Change in system sensor volume
To test the hypothesis, system sensor data was obtained at the RTOC. Data from the system sensors was collected for periods during, and immediately after an incident or diversion. In the absence of an incident or diversion, data was again collected from the same system sensors on an average day, at the same time, under normal conditions providing a baseline for comparison.
Sample Size:
- System sensor data was collected at regular intervals of 5 minutes over the duration of an event and for ½ hour after its conclusion.
Assumptions:
- At least one incident or diversion with adequate data would take place within the designated data collection period. If none had occurred, an extension of the data collection activities would have been necessary.
Data Collection Methods and Tools:
- The DET_ID, LOG_TIME, SMOOTHED_VOL, and SMOOTHED_OCC data fields were queried for each system sensor.
- The data were entered into a spreadsheet for analysis, comparison, and summary.
- Microsimulation was used to forecast changes in travel time and delay that would have resulted from a delay in response time.
One incident (case 9) was selected as a case study for this evaluation objective based upon the following:
- Completeness of the information available on the incident log
- Availability of valid system sensor data just before, during, and after the incident
- Availability of valid system sensor data in the absence of an incident
- A documented impact on the surface street system
- Excellent system sensor coverage of individual travel lanes
- A CCTV installation allowing for a good view of all approaches
During this incident, a crash was reported by the 911 system on Mount Hope Avenue just south of Crittenden Boulevard. The operator first became aware of the event at 7:45 AM on November 22, 2005. System sensor occupancy and the CCTV camera were immediately used to validate the incident. The camera revealed that Mount Hope Avenue was severely congested and affecting the Elmwood Avenue Intersection. Action was taken at the RTOC in the form of signal timing modifications at that time. A 140 second cycle length was introduced at both intersections and splits were adjusted appropriately based upon the visual information provided by the camera. Traffic dissipated by 8:25 AM and the timings were returned to normal by 8:30 AM.
Volume and occupancy data were obtained from the Mount Hope and Elmwood Avenue intersection system sensors, summarized, and plotted. Data were also collected on May 9, 2006 in the absence of an incident and plotted as a baseline for comparison. A sample plot showing system sensor occupancy is shown in Exhibit 9. All remaining plots, including volume plots, are available in Appendix C. The volume data from May 9 match the pattern of November 22, remaining nearly constant throughout the duration of the incident. The occupancy data clearly show a spike correlating with the timing of the description written on the incident log. All approaches to the Mount Hope and Elmwood Avenue intersection, except the northbound, were affected by the congestion.
A simulation-based approach was utilized to quantify the benefit of having used a CCTV camera to quickly validate and manage the incident. A SimTraffic microscopic simulation model was constructed for the Mount Hope Avenue corridor (Highland Avenue to Westfall Road) and used to forecast the effect of a delayed response on area traffic operations.
The process started with a Synchro v.6.0 model for Mount Hope Avenue during the morning peak hour. Traffic volume and base signal timing information were obtained from the MCDOT area wide model and represent typical weekday conditions in the absence of an incident. The incident was simulated by reducing southbound Mount Hope Avenue to one lane south of the Crittenden Boulevard intersection. Traffic volumes were held constant. Incident response signal timings for both the Crittenden Road and Elmwood Avenue intersections were obtained from the MCDOT.
The Synchro model was exported to SimTraffic for microsimulation. The base incident run consisted of three intervals, including a 20 minute seeding interval, a 20 minute build-up interval (7:25 to 7:45) simulating congestion and delay prior to the timing change, and a 40 minute interval (7:45 to 8:25) showing the impact of the timing adjustment. A base incident animation was observed to verify that it accurately replicated the pattern of increasing and decreasing congestion with respect to time as reported by the system sensors at the Mount Hope and Elmwood Avenue intersection.
A series of 5 additional runs were then completed, each extending the congestion build-up interval by 2 minutes, to a maximum of 10 minutes. To account for the stochastic variation of traffic within the model, data resulting from a series of 5 multiple simulations were averaged for each run.
|
Exhibit 10: Synchro Model for Mount Hope Avenue  |
Exhibit 11: SimTraffic Model for Mount Hope Avenue  |
Total network travel time, total network delay, and total network fuel consumption were selected as appropriate global measures of effectiveness. The data were recorded by the simulation during the build-up and response intervals and are compared relative to the total travel time and total delay present during typical conditions without an incident. The results were expressed in terms of percent change.
Exhibits 12, 13, and 14 illustrate the inherent benefit of short incident detection and validation times. The point at time zero, representing the documented time of incident response in case 9, suggests a 40% elevated network travel time and a 90% elevated network delay given immediate action. Those levels would have doubled over a 10 minute period had the camera not been available. The travel time and delay would have further increased had it been necessary to wait for an observer to be dispatched, reach the scene, and report back. Fuel consumption also increases with delay in response time.
The following analysis is extrapolated based upon the Mount Hope Avenue incident data. The timeline shown in Exhibit 15 reflects the conclusions drawn for Evaluation Objective 1. It is assumed that a CCTV camera allows an operator to validate and react to an identified incident in 5 minutes or less. It takes approximately 5 minutes more to validate an incident at a location where system sensors are present but no camera coverage is available. A minimum of 10 additional minutes is needed to validate an incident when an observer must be dispatched to the scene.
Exhibit 15: Assumed Incident Response and Validation Timeline
Exhibit 16 summarizes the network delay and fuel consumption figures resulting from the SimTraffic model given the Mount Hope Avenue and Crittenden Boulevard incident conditions. The expected delay and fuel consumption figures for an average day according to the model (no incident) have been removed. The CCTV column functions as the baseline. The system sensor column illustrates the results of action 5 minutes later and the on-site column a minimum of 10 minutes later.
Exhibit 16: SimTraffic Results for Incident Case Study
|
Measure of Effectiveness |
Validation Method | ||
|
CCTV |
System Sensors |
On-Site | |
|
Total Delay (veh-hr) |
136 |
191 |
271 |
|
Total Fuel Consumption (gal) |
72 |
131 |
200 |
|
Highway User Time Cost |
$1,960 |
$2,750 |
$3,900 |
|
Highway User Fuel Cost |
$220 |
$390 |
$600 |
|
Combined Time and Fuel Cost |
$2,180 |
$3,140 |
$4,500 |
The cost calculations assume peak hour vehicle occupancies of 1.2 persons per vehicle based upon data from the Bureau of Transportation Statistics and the United States Department of Transportations 2001 National Household Travel Survey. The cost of highway user time is estimated at $12 per hour based upon the United States Department of Transportations Revised Departmental Guidelines for the Valuation of Travel Time in Economic Analysis (February 2003). A fuel price of $3.00 per gallon was also assumed based on average 2005-2006 conditions.
Exhibit 17 illustrates the estimated benefit of CCTV use. The data collection period for this evaluation lasted 3.5 months. During that time, 16 of the 24 recorded incidents required action on the part of the RTOC operators. Therefore, one may expect to experience 55 incidents requiring similar action over the course of an entire calendar year. As a result, the annual cost savings to the traveling public due to the use of CCTV cameras is estimated at over $50,000 thousand dollars per year when compared to the use of system sensors alone and over $125,000 per year for locations without any means of gathering information short of an on-site visit.
Exhibit 17: Estimated Cost Savings due to CCTV Use
|
Validation Method |
Estimated Cost Savings | |
|
Per Incident |
Annually | |
|
Use of CCTV versus System Sensors |
$960 |
$52,800 |
|
Use of CCTV versus On-Site Validation |
$2,320 |
$127,600 |
The total contract cost of Phase 1 which installed 5 CCTV cameras was $279,338.10. This yields an average cost of approximately $55,860 per camera. The Phase 1 camera locations also generally have system sensor coverage. Therefore, the savings experienced by the traveling public resulting from use of the CCTV cameras would fully pay for the Phase 1 project in approximately 5 years.
| Evaluation Objective #3: Describe intangible benefits of increased surveillance ability |
The hypothesis for evaluation objective number three is that the availability of visual information provided by CCTV cameras improve the ability of RTOC operators to perform their job in the event of an incident or diversion.
The following qualitative measures of effectiveness were selected:
Measure of Effectiveness
Perceived change in ability of RTOC staff
to monitor and adapt to changing traffic conditions and incidents
Individual RTOC operators were interviewed at the end of the data collection period to solicit their personal experiences after having used the CCTV camera system. Both positive and negative feedback was solicited.
Sample Size:
- Three MCDOT staff members who participated in the incident data collection process were interviewed. In addition, one NYSDOT staff member was interviewed.
Assumptions:
- Each operator interviewed utilizes the CCTV camera system during their daily routine.
Data Collection Methods and Tools:
- The results of the interviews are summarized below.
AREA VERSUS INTERSECTION COVERAGE
Proper placement of the CCTV cameras was noted as critical to their use and functionality. Though each of the 5 phase 1 camera installations provides the operators with useful visual information, the East/Winton/University/Norris/I-490 and Mount Hope/Elmwood cameras are used most often by the MCDOT operators because they provide the widest scope of visual information. From these locations the operators can see both the subject intersection and the approaching roadway network.
In discussing the subject of area versus intersection coverage, the operators expressed appreciation for the ability to zoom out and observe network operations over the span of 3 or 4 intersections. They recognize that mid-block camera locations may require tall poles, high camera mounting elevations, and additional cabinets.
CAMERAS IMPROVING OPERATOR PERFORMANCE
The operators discussed how the visual information provided by the CCTV cameras helps them do their jobs better when compared to the limited array of data provided by system sensors. They explained that the CCTV cameras offer information on weather conditions affecting traffic flow including snow and rain storms. MCDOT staff used the CCTV camera system to observe a flooding event along I-490 east of downtown Rochester, identify the resulting traffic backups in the immediate area, and to assist in the planning of signal timing changes in neighboring areas before the backups arrived.
The CCTV cameras allow operators to immediately examine real time conditions, improving their understanding of why an incident or diversion is occurring. This information is used to quickly plan and implement targeted mitigation. One operator cited an experience when system sensors were registered 100% occupancy at the intersection of Portland Avenue and Norton Street to explain how the lack of a CCTV camera can affect the response. In this case, the operator observed the situation for about ½ hour waiting for a change in the readings and contacting others in an effort to understand what might be causing them rather than immediately being able to determine the cause and react immediately.
Moderate to high system sensor occupancies appear on the operators screen as a purple or red arrow. The operators suggested this sometimes leads to uncertainty in determining if and how they should take action. The CCTV cameras provide the visual information necessary to personally assess the situation and execute a tailored response with increased confidence.
Overall, the operators agree that they are able to provide a higher and more responsive quality of service to the traveling public at locations with CCTV cameras. This is primarily due to the availability of real-time visual information. At this time they believe it is not possible to provide that same level of service at locations without camera coverage.
BENEFITS EXTENDING BEYOND INCIDENT MANAGEMENT
A particular use of the CCTV camera system outside the realm of typical incident management was discussed during the interviews. Winton Road crosses I-590 southeast of downtown Rochester. The traffic signals at the I-590 interchange are currently maintained and operated by the NYSDOT. Neighboring signals on the arterial are operated by the MCDOT. At this time there is no direct interconnection between the interchange signals and their neighbors. Coordination is time-based. Since its installation, the MCDOT has used the Winton Road/Erie Canal camera location to observe the quality of traffic signal coordination along Winton Road. After observing the offsets and modeling what was seen using Synchro, the staff has improved offsets, created, and maintained cross coordination on Winton Road between I-590, Brighton-Henrietta Town Line Road, and Jefferson Road. The MCDOT envisions using this process to verify and adjust new signal timings installed during future construction projects when camera coverage is available.
The RTOC occasionally receives trouble calls concerning the operation of a specific traffic signal. Common notifications include a broken bulb, a power outage, a light stuck in red or an inoperative loop detector. Operators can use the CCTV cameras to compliment information provided by the computerized traffic control system. They will train the camera eye on the approach for which a trouble call was received. If they observe a vehicle sitting on an approach but no call is registered by the computer, they know something is wrong with that loop. They can also use the camera and the computer together to prove a light is not stuck in red. In this way they will have avoided spending the manpower, equipment, and fuel costs necessary to send an observer out to the scene for visual verification.
MCDOT staff review and adjust peak hour timings around their system on a regular basis. Observing an intersection and its operation via camera from the RTOC is a safer alternative to standing alongside moving traffic at an intersection, especially where there are no parking lanes or sidewalks from which similar observations can be made.
SUGGESTIONS FOR IMPROVEMENT
Several operators suggested a fisheye zoom function would expand a cameras coverage from one leg to all approaches of an intersection, thus improving its overall usefulness. With this function installed, an operator could observe traffic flow on more than one approach at a time, allowing them to monitor the effect of timing adjustments in one direction while ensuring that crossing flow is not severely affected.
Night time camera performance (black and white mode) was cited as generally poor. Glare from approaching headlights is a problem for the operators. They suggested the use of color mode at all times as a potential remedy.
An auto tour mode is available on the cameras. Under this function, the traffic camera pans much like a security camera would in a building. The operators find the resulting picture movement distracting as it tends to catch their eyes. This setting also causes more constant wear on the machinery.
Ease of camera navigation was also discussed. The operators generally prefer joystick and keyboard control to the systems built in software control. The software does offer them a quick way to arrive at a given camera location. One operator suggested implementing a clickable map that can take them to a chosen camera and view on demand as a part of future upgrades.
The entire regional CCTV camera system is routinely used by both MCDOT and NYSDOT staff. Each entity respects the priority use rights of the other owner; however there are times when more than one person may have a reason to use a camera at one time. There is currently no way to know which individual has control of a specific camera other than asking those within the RTOC control room. In isolated instances, some operators cited using a camera for observation only to have it moved out of position. At the time they were unable to ascertain if the movement was a glitch or if someone else had assumed control. Placing a message on the screen indicating which operator is in control of a camera at any given time was one suggestion discussed to help avoid future confusion.
MISCELLANEOUS
NYSDOT operators generally use the CCTV camera system to observe expressway operations and to assist in the dispatching of the Highway Emergency Local Patrol (HELP) vehicles to non-recurring incidents. Upon validating an incident the NYSDOT operators may initiate a crash call to the NYSP, place information on the regions Variable Message Signs (VMS), or install a message on the Highway Advisory Radio (HAR) system. In locations without CCTV camera coverage, the NYSDOT operators rely on a site visit by a HELP truck, the NYSP, or verbal information on a scanner to determine when and how to take action.
|
Evaluation Objective #4: Identify the benefits and/or drawbacks of interagency coordination and system integration |
One of the goals stated in the Final Design Report for the I.T.S. Camera Deployment and Systems Integration Project was to Integrate the County ITS system with NYSDOT and other agencies consistent with the Regional ITS Architecture. To advance this goal, a large amount of interagency cooperation was required during planning, design, construction, and the initial operation phases. The intent of this evaluation objective was to document the experiences, both positive and negative, related to interagency coordination and system integration.
The following qualitative measures of effectiveness have been selected to meet objective #4:
Measures of Effectiveness
Issues introduced by interagency
cooperation
Compromises made by stakeholder agencies
Results perceived
to hamper desired operations
Results perceived contributing to project
successes
A narrative was written, based on the experiences of stakeholders including the MCDOT, NYSDOT, the Consultant planning/ design team, etc. All perspectives were identified and summarized. Issues and compromises discussed cover a range of topics from the general to the specific.
Sample Size:
- Experiences were drawn from each of the participating stakeholder agencies.
Assumptions:
- Not applicable.
Data Collection Methods and Tools:
- Comments will be summarized in written format.
Looking back upon the design effort, it is evident that interagency cooperation and decision making are essential to success. Camera location is a prime example of how interagency cooperation can shape the outcome and functionality of the final system. The MCDOT and NYSDOT worked closely together to identify placements that would achieve both arterial and expressway surveillance. As such, both agencies agreed that their RTOC operators should share control of all cameras, including existing equipment. Ultimately, the use of an existing American Dynamics video switch at the RTOC, owned by the NYSDOT, was agreed upon as the most cost effective way to achieve integration. This move would max out the existing video switch. The NYSDOT accepted this outcome given that they would be able to share in the functions of a new MCDOT video switch to be installed under phase 2.
Connecting the new CCTV cameras to the RTOC also involved interagency cooperation and system integration. Both the NYSDOT and Monroe County Pure Waters (MCPW) had existing networks of fiber optic cable (144 fibers) located throughout the project area (refer to Appendix D). Rather than install entirely new networks of conduit, pullboxes, and cable for each camera the NYSDOT and MCPW agreed to share their existing trunk lines with the MCDOT to provide camera home runs. Although they agreed to share their facilities, the MCPW required initially that all splices to their fiber optic trunk line be completed by MCPW forces to avoid damage by the Contractor or other external organizations. Furthermore, step by step testing of cameras and fiber drops were required of the Contractor prior to MCPW connection to the trunk line to avoid confrontations that might occur if a CCTV camera didnt function properly once connected to the RTOC.
Security, flexibility, and responsibility are among common concerns resulting from the integration of multiple systems maintained by multiple agencies. This is especially relevant when multiple operators have the ability to control and utilize each others equipment. To address this issue, agencies at the RTOC are developing a tool to overcome these issues and affect compromise in the form of a Concept of Operations Plan. Development of a plan for the RTOC began during phase 1 and is currently moving through the review and approval stages. The following statements published in the phase 1 design approval document pertain to the required interactions and agreements between the MCDOT and NYSDOT.
The RTOC is a very good example of harmonious, coordinated multi-agency-run operations center. To date, the center has run efficiently within the functionality of its current framework. The additional functionality of implementing the above mentioned system integration will require a closer working understanding of responsibilities of both Monroe County and NYSDOT.
The concept of operations is therefore critical to the successful deployment and maintenance of the County ITS devices. With this in mind, the NYSDOT and MCDOT are in the process of finalizing an Operations Plan for the shared use of the RTOC. In addition, a Memorandum of Understanding (MOU) between the NYSDOT, MCDOT, New York State Police, and Greater Rochester International Airport is being developed that will further define the operations and maintenance activities at the RTOC.
The document will set hours of operation, management, and staffing responsibilities, define the responsibilities of staff, outline equipment ownership and maintenance responsibilities, describe how the video display wall and CCTV camera equipment are shared, set security procedures, procedures to recover from computer failures such as a system crash, and more. An official operations manual will also be issued for the RTOC as guidance to all involved in operating and maintaining the facility.
Throughout the design and integration and implementation phases of this project, exceptional effort was made to bring all involved agencies around the table to minimize any adverse impact to existing and future operations. To date there have been no perceived or recorded events that could be stated to hamper operations.
Interagency commitment stretching from top level management through RTOC staff and operators to offer a coordinated freeway and arterial traffic management system has been a key ingredient to the success of the RTOC system. Their cooperation has been put to the test during the short period that the Monroe County CCTV cameras have been in operation. Major freeway incidents have necessitated the rerouting of traffic onto the arterial system and the retiming of traffic signals. Through the use of cameras, the MCDOT has been able to respond to these incidents, change traffic signal timing patterns, and monitor the results during the incidents. NYSDOT staff has overseen the function of Highway Emergency Local Patrol vehicles and worked hand in hand with the MCDOT and NYSP to keep area motorists in motion. Their experiences speak to the success of the design, construction, implementation, and integration plan where the effect of the whole is greater than the sum of its parts.
| Evaluation Objective #5: Quantify the savings and/or additional costs realized due to the sharing of facilities |
Several facilities and communication systems were shared in an effort to reduce overall project costs. The following measure of effectiveness was selected for this evaluation objective:
Measure of Effectiveness
Difference between cost as installed and estimated cost without system integration
Actual construction cost data for the project were collected from MCDOT records. Construction cost estimates will also be compiled to approximate what level of funding might have been spent had facilities not been shared. The difference between these two figures will be calculated to show net benefit or cost of facilities sharing. The future integration benefits of early installation of CCTV NTCIP control will be evaluated relative to future construction and installation costs.
Sample Size:
- Not Applicable.
Assumptions:
- Construction cost data for the project will be made available by the MCDOT.
Data Collection Methods and Tools:
- Actual contractor bid prices for items in the contract were used to estimate costs without facilities sharing. Where actual contractor bid prices are not available Weighted Average Bid Prices were substituted.
The facilities and services shared to implement the MCDOT phase 1 CCTV camera installations are listed below. These items represented a savings to the phase 1 construction contract. A plan sheet illustrating each phase 1 CCTV location and the communications facilities shared to bring their information back to the RTOC is available in Appendix D.
- Portions of the existing Monroe County Department of Environmental Services (MCDES) fiber optic cable network were used to provide camera home runs to the RTOC.
- Portions of the existing NYSDOT fiber optic trunk cable were used to provide camera home runs to the RTOC.
- Modems were purchased, tested, and set up by MCDOT staff. The modems were installed by Crane Hogan Structural Systems.
- Information from all new MCDOT cameras was routed through an existing NYSDOT video switch, located at the RTOC.
Had facilities integration not been possible, the following items would have been required to complete the project, adding approximately $1.7 Million dollars to the total contract cost of $279,338.10, increasing it by 6 times. Items in the following table are expressed in metric units in keeping with the phase 1 CCTV contract.
Exhibit 18: Estimated Cost Saved by Facilities Sharing and Integration
|
Item |
Unit |
Quantity |
Unit Cost |
Total Cost |
|
Traffic signal conduit excavation and restoration in composite pavement |
M |
3,050 |
$150 |
$457,500 |
|
Traffic signal conduit excavation and restoration in grass and unpaved areas |
M |
13,750 |
$35 |
$481250 |
|
Pullbox circular, 750 mm diameter, reinforced concrete |
EA |
275 |
$1000 |
$275,000 |
|
Cable, fiber optic, single mode (6 fibers) |
M |
16,800 |
$10 |
$168,000 |
|
Modem, Fiber optic, video (furnish and test) |
EA |
10 |
$1,600 |
$16,000 |
|
Video Switcher |
EA |
1 |
$10,000 |
$10,000 |
|
ADDITIONAL CONSTRUCTION COST |
|
|
|
$1,407,750 |
|
survey and stakeout |
LS |
1 |
$30,000 |
$51,500 |
|
Maintenance and protection of traffic |
LS |
1 |
$42,000 |
$68,500 |
|
MOBILIZATION |
LS |
1 |
$45,000 |
$75,000 |
|
CONSTRUCTION INSPECTION |
LS |
1 |
$120,000 |
$110,000 |
|
ESTIMATED ADDITIONAL CONTRACT COST |
|
|
|
$1,644,750 |
Unit Conversion: 1 M = 3.2808 FT
This cost estimate is based on the following assumptions:
- CCTV camera home runs would share conduit and fiber optic cable as shown in Exhibit 14.
- CCTV home runs would be routed to the RTOC over the most direct path, as shown in Exhibit 14.
- Fiber optic cable would be used for all CCTV home runs rather than coaxial cable or spread spectrum radio.
- 80% of the home run conduit would be installed in unpaved areas with the remaining 20% under pavement.
- Average 60 m (200 ft) spacing between pullboxes.
- Two modems required per camera, one at the RTOC and one in the field.
- The cost of installing all modems was included in the original contract price.
- The conduit costs include the excavation, conduit, and surface restoration.
Use of NTCIP Standards
The National Transportation Communications for ITS Protocol (NTCIP) standards are being developed to help operating agencies achieve interchangeability and interoperability. This is extremely important in a project such as the MCDOT ITS Camera Deployment & Systems Integration, where construction is completed in phases over a number of years. Key cost avoidance can be achieved with the use of NTCIP Standards in such items as custom software, interfaces, and with expanded opportunity to get bids from multiple suppliers.
As the NYSDOT and MCDOT share space within the RTOC and given the benefit of shared control of CCTV cameras among both agencies, NTCIP standards were specified for the new Monroe County Cameras and interface equipment. As Monroe County installs additional cameras in subsequent phases and NYSDOT migrates from the existing legacy system to NTCIP, interoperability by both agencies will be ensured thus avoiding the need for costly hardware and software interfaces.
Exhibit 19: Assumed Routing for CCTV Cameras without Facilities Sharing

3.0 Conclusion and Lessons Learned
The primary objectives of the initial MCDOT CCTV deployments were to:
- Facilitate incident management
- Facilitate traffic signal management
- Enhance intersection monitoring
- Advance integration with other agencies
This report documents an evaluation of the effectiveness of Monroe Countys 5 initial CCTV deployments and the results of that investigation. The evaluation employed both quantitative and qualitative measures. The purpose of the evaluation was to allow those responsible for funding, development, design, and deployment of the MCDOT CCTV systems to understand the impact and effect of ITS on transportation users, quantify the benefits, help guide future investment decisions, and generate future improvement strategies.
Operators at the RTOC maintained a log book, keeping track of incident milestones and describing their actions from October 2005 through February 1, 2006. The log entries suggest incident management was facilitated by the CCTV cameras. Operators were able to validate incidents more quickly than they could have at locations with system sensors alone and no on-site observer. In general, validation of incidents took place within 4 minutes. Operators were also able to reverse any changes they made to signal timings within 5 minutes of an incidents conclusion.
Using one specific incident as a case study, system sensor data were plotted and a microsimulation model was used to quantify the benefit of a quick response. During the incident, signal timings had been modified in response impending gridlock on an arterial street. The simulation test results indicate that for every minute of delay in reacting to the incident (i.e. changing the timings), the total travel time, total delay, and total fuel consumption within the affected area would have increased by 3% to 5%. Assuming the initial 5 CCTV installations have allowed operators to react at least 5 minutes quicker than they could with system sensor information alone, that this is a representative incident, and that the MCDOT system is well instrumented with system sensors, the extrapolated annual savings to the traveling public would pay for the entire $280 thousand dollar project in approximately 5 years. In the future, the county could recover costs more quickly for similarly priced CCTV installations in incident prone areas without system sensor coverage.
Operators were interviewed to solicit their personal experiences after the incident data collection period. It was clear from the interviews that the operators believe CCTV cameras have made their jobs easier, allowing them to improve the speed and quality of the service delivered to the public. They feel their responses are better informed with visual information and they have increased confidence in the appropriateness of their actions. Use of the CCTV cameras outside the realm of incident response was also discussed. Since installation, the cameras have been used for coordination of non-interconnected traffic signals, verification of trouble calls, and routine observation of field signal timings. Suggestions for improvement include an ability to monitor more than one opposed intersection approach at a time, improved night time vision, and enhanced navigation tools.
Interagency coordination and system integration were discussed relative to compromise and the overall success of the project. The NYSDOT has shared an existing video switch with the MCDOT in phase 1 in return for the use of a future switch to be installed under phase 2. MCPW dedicated spare fibers within its local trunk lines to the MCDOT cameras. MCPW also initially required that all splices were completed by their own forces to protect the existing facility. All occupants of the RTOC are involved in developing a Concept of Operations Plan, defining the roles and responsibilities of each agency within its shared environment. Overall, a high level of interagency commitment, spanning all levels of the involved agencies, has come to provide the traveling public with a coordinated expressway and arterial traffic management system.
The MCDOT ITS Camera Deployment & Systems Integration project involved the sharing of facilities among the MCDOT, NYSDOT, and MCDES to save unnecessary costs. Shared facilities were identified and used to quantify the estimated increase in contract cost had integration not occurred. The results suggest that phase ones $280 thousand dollar construction cost might have risen to nearly $2 million had it been necessary to install entirely new conduit, pullboxes, fiber optic cable, separately purchase modems, and furnish a stand alone video switching device.
Exhibit 20: Summary of Findings
|
Objective |
Findings |
|
Quantify changes in incident response time. |
|
|
Quantify traffic flow impacts of changes to incident response. |
|
| |
|
Describe intangible benefits of increased surveillance ability. |
|
| |
| |
| |
|
Identify the benefits and/or drawbacks of interagency coordination and system integration. |
|
| |
| |
| |
|
Quantify the savings and/or costs realized due to the sharing of facilities. |
|
Finally, among the lessons learned during the evaluation process are the following:
- It is advisable to remain flexible when performing an ITS evaluation. An evaluation team may find that the data collected does not meet every expectation made prior to study, however that data can be just as useful in different ways given a modified approach.
- The traveling public can benefit from enhanced service at reduced cost when agencies cooperate and willingly share their facilities for the good of all involved.
- The experiences and comments of transportation management center staff that use the cameras each day to serve the traveling public are the greatest indicators of the value of visual information provided by CCTV camera installations.
Appendix A: Sample Incident Log and Instructions
Introduction
An ITS evaluation allows those responsible for funding, development, design, and deployment to understand the impact and effect of ITS on transportation users, quantify the benefits, help guide future investment decisions, and generate future improvement strategies. Comprehensive evaluations often require both quantitative and qualitative measures. This log is part of the data collection effort necessary to assess the effectiveness of Monroe Countys 5 initial CCTV deployments.
Data will be collected for the following four CCTV locations:
- East Avenue/Winton, University/Winton, and Winton/Norris Drive/I-490 (I-490 Interchange)
- Westfall Road and South Clinton Avenue
- Elmwood Avenue and Mt. Hope Avenue
- West Main Street and Brown Street / Genesee Street / Chili Avenue
These intersection/CCTV camera locations were chosen because system sensors are already available for the collection of data at the RTOC. The Winton Road and I-490 Westbound On-Ramp location also provides the opportunity to study a place where diversions from accidents on the expressway may occur.
In addition, data will be collected from two null locations where system sensors are available for the collection of intersection data but CCTV cameras are not present. The selected null intersections are:
1. Mount Read Boulevard and Lyell Avenue
2. Ridge Road, Stone Road, and Corona Road
The purpose of this log is to collect data necessary to meet the following evaluation objective:
Evaluation Objective #1: Quantify changes in incident response time
The hypothesis for evaluation objective #1 is that the presence of CCTV cameras at an intersection experiencing an incident or diversion will allow an RTOC operator to respond, assess, mitigate, and return operations to normal more quickly.
To test the hypothesis, operators are asked to maintain this log book, keeping track of response milestones when an incident or diversion takes place. The response times from CCTV camera locations will be compared to the same data collected at the null locations.
The following measures of effectiveness will be used to measure changes in response time due to the presence of CCTV cameras.
Measures of Effectiveness
Change in time between identification and validation
Change in time to
recognize validity of an incident (e.g., is a signal stuck in red?)
Change
in time to return to normal operations after event conclusion
Data shall be logged for all incidents or diversion events that occur within the observation data collection period at both the CCTV and null sites.
Log Instructions
PLEASE FILL OUT ONE LOG PAGE FOR EACH INDIVIDUAL INCIDENT
DATE:
Fill in the year, month, and day of the incident or diversion recorded.
LOCATION:
Check the box showing the location for which the data is recorded.
SYSTEM SENSOR DATA:
System sensor data is to be recorded at regular intervals of 5 minutes over the duration of the incident and for at least ½ hour after its confirmed conclusion. Check start recording when system sensor data recording begins and stop recording when it ends to verify this has been done. Please fill in the start and stop times for recording and check the appropriate box for AM or PM.
TIME REGISTERED:
Enter the time (hour and minute) at which the operator was first made aware of an incident. Check the proper box for AM or PM. Also check the proper box for the method by which the operator was informed. If the operator first became aware of the incident in an unlisted manner, please check other and specify the actual method.
TIME VALIDATED:
Enter the time (hour and minute) when it was determined that this was in fact an actual incident or a false alarm. For example, a false alarm might be an unsubstantiated claim that a side street signal was stuck in red. Check the proper box for AM or PM. Also check the proper box for method of verification. If the operator verified the incident in an unlisted manner, please check other and specify the actual method.
TIME ACTION TAKEN AT RTOC:
Enter the time (hour and minute) when the first responsive action was taken by the operator at the RTOC. Check the proper box for AM or PM. For example, give the time when an adjustment to the signal timing was made in response to the incident. Another example would involve the time an operator called for a crew to repair the problem or remove a disabled vehicle. If no corrective action was taken, please check the proper box.
TIME OF CONFIRMED CONCLUSION:
Enter the time (hour and minute) when the operator confirmed that the incident had ended. For example, when traffic has ceased to divert through an intersection and traffic delays have returned to normal levels, the incident would be over. Check the proper box for AM or PM. Also check the proper box for the verification method. If the operator verified the incident in an unlisted manner, please check other and specify the actual method.
RETURN TO STANDARD OPERATION:
Enter the time (hour and minute) when the operator has returned all systems to standard operation. For example, this would be the time when traffic signal timings were returned to their default settings. Check the proper box for AM or PM.
DOCUMENTED BY:
Please enter the name of the operator completing the log. Also enter the organization with which they are affiliated. If the organization is not listed, please check other and specify the correct organization.
NOTES SECTIONS:
Please give a brief descriptive narrative for each section. During the event, an operator may choose to write in a few key words that would later be used to fill in that section. Please complete the notes sections as soon after the event conclusion as possible to retain as many details of the incident or event as possible.
Appendix B: Incident Log Summary Spreadsheet
Appendix C: Case 9 Volume and System Sensor Plots
Appendix D: Equipment Location Map
Appendix E: Microsimulation Modeling Backup


