
Chapter 3: ITS Research Initiatives
This chapter describes the current ITS research initiatives, the results that have been achieved to date, and their status as of September 2008. The ITS initiatives are designed to test technologies, systems, models, and strategies for ITS applications and in support of Departmental safety, congestion, and environmental goals.
As noted in the 2006 Five-Year Plan, the ITS research initiatives and deployment support programs form the core of the ITS Program. The major initiatives, selected in 2004, were chosen because they met the following criteria:
- Problem-driven and results-oriented.
- In direct support of the Department's goals for safety, reduced congestion, and global connectivity.
- In direct support of congressional goals, intended purposes, and research priorities for the ITS Program.
- Generally multimodal in nature and requiring a high degree of integration.
- Clearly defined with respect to the Federal and private-sector roles.
- Focused on significant research and development and incorporating testing and evaluation.
Figure 3.1 illustrates how the research initiatives and deployment support programs support the Department's goals.
Figure 3.1: Relationship of the ITS Research Initiatives to the Department's Goals
Safety
- Vehicle Infrastructure Integration
- Integrated Vehicle-Based Safety Systems
- Cooperative Intersection Collision Avoidance Systems
- Next Generation 9-1-1
- Rural Safety Initiative
Mobility
- Integrated Corridor Management Systems
- Mobility Services for All Americans
- National Surface Transportation Weather Observing and Forecasting System (Clarus)
- Next Generation 9-1-1
- Congestion Initiative
Productivity
- Electronic Freight Management
This chapter contains descriptions of each Initiative, including the following information:
The Initiative Highlights—Each section begins with a two-page summary divided as follows:
- The Program-At-A-Glance describes:
- The Transportation Problem being addressed by the Initiative.
- The ITS Opportunity to address the problem.
- The Initiative Approach to addressing the transportation problem and conducting ITS research.
- Program Results builds on the Initiative Approach and describes how the objectives of the Initiative are being met through:
- Accomplishments To Date—provides an update on the progress made over the last two years.
- Technical Results To Date—describes the results and knowledge gained from conducting experiments, pilot testing, and field demonstrations under real-world conditions. This section also reports on the technical insights learned with regard to the feasibility of solving the transportation problem or about delivering new capabilities.
Following the two-page summary, each Initiative is described in further detail by the following sections:
The Transportation Problem and the ITS Opportunity—This section provides further detail on the state of the transportation problem as it exists today, the research issue to be addressed by ITS and the institutional challenges to be overcome for implementation.
The Initiative Approach—This section frames the Initiative goals, structure, and research approach to develop the products and deliverables that will address the problem. Within the Initiative Approach, the concept or system being furthered by the Initiative is described in greater detail through graphics, textboxes, and images of the products and deliverables that are ultimately expected from the research.
The initiatives differ in what they are producing—deliverables may take the form of technologies and system prototypes, enhanced transportation models, or new operational strategies. Frequently, the products are accompanied by:
- System concepts of operation, architectures, and standards. These documents, collectively, offer functional and technical descriptions of the Initiative products and how they are to perform and connect (or interface) with other systems and technologies. These documents are important deliverables that accompany the Initiative products (or are the Initiative products). They form the basis of technology transfer to users, and are a critical component in easing the path to agency implementation or vendor commercialization. In particular, standards ensure the ability to integrate with other technologies and systems and to provide opportunities for multimodal and multi-jurisdictional interoperability—a key focus of the ITS Program.
- Generic functional and test specifications that are vendor-neutral and that form the basis for successful performance. For instance, a set of specifications might define a minimum level of accuracy or a type of data exchange that is needed to ensure a specific safety result. These specifications are then transferred to the commercial manufacturers and vendors which build from the specifications and tailor their products to best meet their customers' needs.
These deliverables are described in more specific detail as they relate to each Initiative.
The Initiative Findings and Research Results—This section summarizes important results to date from proof-of-concept testing and demonstrations—structured activities that provide the US DOT with a chance to understand the real-world application and impacts of the ITS technologies, models, and operational strategies. The results provide a greater understanding of the safety and mobility benefits that Americans can expect from these new products, and frequently form the basis for the decision on whether to require new regulations. The test results also allow manufacturers and vendors to understand performance levels of the initial prototypes and how they operate, as well as allow State and local ITS decision-makers to identify the benefits they might receive from investment and deployment.
The Initiative Research Roadmap—This section provides an up-to-date Initiative roadmap and describes project changes since the 2006 Five-Year Plan, if any. In the event of significant changes, a new roadmap is included.
The Next Steps and Final Activities—This last section highlights the expected completion of the initiative, the remaining program activities, and a description of the initiative plans for transferring successful end products to the market for commercialization and consumer adoption.
Structure of this Chapter:
- Section 3.1 presents Research Initiatives Nearing Completion.
- Section 3.2 presents Research Initiatives Moving into Real-World Testing and Demonstration.
- Section 3.3 presents New Research Initiatives, describing the Department's new initiatives since 2006, and the role of the ITS Program within those initiatives.
- Section 3.4 presents Ongoing ITS Research Programs which includes ongoing research activities required under SAFETEA-LU that are focused on advancing ITS in field settings and are conducted in close partnership with modal agencies.
3.1 Research Initiatives Nearing Completion
Two of the ITS initiatives are nearing completion—work on the critical research is complete and has been demonstrated in real-world settings. Demonstrations and early adopters have produced an initial set of results that showcase the type of benefits that can accrue to the Nation if the research is actively implemented. The research initiatives are:
3.1.1 Electronic Freight Management (EFM)—transforming market opportunities for businesses of all sizes, but particularly small businesses, by providing them with the means to track cargo shipments in near real-time, connect with new shipping partners, and expedite the paperwork process.
3.1.2 Emergency Transportation Operations (ETO)—improving the safety, speed and effectiveness of response, and management of major incidents.
While the research and demonstration stages of these initiatives have concluded, final activities are underway to promote deployment and use.
Note on changes since the 2006 ITS Program Plan:
- The ETO Initiative was titled Evacuation Management and Operations, or EMO, in the 2006 Five-Year Plan. The change in the initiative's title occurred in the past two years with the recognition that the tools and processes under development applied more broadly and addressed many more aspects of effective management for safe and efficient operation of the transportation system during large-scale emergencies, in addition to evacuations. The focus and content of the initiative research did not change.
3.1.1 Electronic Freight Management Initiative
The Transportation Problem
In 2007, the United States moved over $15 trillion in goods into and out of the country. Moving freight across the world is complex, involving processes for the exchange of information among multiple partners and agencies as well as the transfer of goods among modes of transportation. Given existing and predicted capacity constraints in the U.S., finding ways to improve the efficiency and timing of freight movement into and out of our Nation's ports is critical to economic vitality.
Accurate, efficient, non-proprietary, and inexpensive freight tracking methods—essential for both port security and business success—are limited.
Many supply chain partners cannot communicate electronically, resulting in delay, lost goods, and reduced efficiency. Typically, their electronic systems are incompatible and unable to share data. This is an obstacle to both the efficient identification of new shipping partners and the real-time tracking of cargo through the shipping process, particularly as freight moves across borders and from mode to mode. Further, lack of accurate and effective information exchange leads to inefficiencies along the supply chain. The existing solution is to engage in the expense of a proprietary shipping service. This solution is not an option that most small- and medium-sized businesses can easily exercise.
The ITS Opportunity
ITS presents the opportunity to combine recent advances in communications technologies with the efficiencies of the internet to improve the visibility and efficiency of worldwide transportation logistics. An integrated system can transform market opportunities for businesses of all sizes, particularly small businesses, by providing them with the means to track cargo shipments in near real time, connect with new shipping partners, and expedite the paperwork process.
The EFM Initiative Approach
In cooperation with Limited Brands, Inc. and its supply chain partners, the EFM Initiative will develop, field test, and evaluate a system that integrates logistics technologies with the Internet and ITS data. The system will incorporate the characteristics of web-based, non-proprietary, easily accessible systems. It will replicate the paperwork and information processes associated with moving goods through the air-truck supply chain. The resulting application will:
- Facilitate the exchange of standardized electronic information, using systems businesses may already have in place such as Electronic Data Interchange (EDI) systems, among others.
- Provide near-real-time information on shipment status.
- Allow freight information to be made available for security screening earlier in the shipping process.
- Streamline paperwork and information processes associated with freight management.
- Improve data accuracy throughout the process.
- Minimize costs for shippers and supply chain partners.
- Provide an open architecture that shippers across all modes can access needed information on each other to efficiently form working partnerships.
With the eventual adoption and commercialization, the EFM system will be expanded to accommodate rail and marine shipping supply chains.
Accomplishments to Date
- Developed a working prototype of the first EFM system;
- In 2007, launched a test in partnership with Limited Brands and its supply-chain partners extending from Columbus, Ohio to Hong Kong;
- Operated the EFM system for six months ending in December 2007. During this period, over 850 consignments were completed and tracked using the EFM technologies;
- Conducted an independent evaluation to understand system usefulness, cargo visibility, supply-chain and logistics performance, and deployment and scalability;
- Analyzed test results and modified the first EFM system in preparation for real-world implementation; and
- Developed a transition strategy to incentivize businesses to adopt the EFM system.
EFM Initiative Results to Date
The field test found that the system is capable of delivering significant gains to businesses.
For example:
- Reduced travel times. The system reduced travel time from Hong Kong to Columbus, Ohio from 96 to 80 hours (12 percent) in the first four months test because all status information was available in the EFM system.
- Savings in labor hours. The prototype system saved the freight forwarder four hours per day in reduced labor from entering paperwork (more than 75 percent per shipment) and $259 per day in labor costs.
- Improved accuracy. The EFM prototype improved data accuracy by at least 12 percent by reducing the number of office trips to verify data; reduced data-entry errors by at least 15 percent by eliminating manual data entry by multiple partners; and reduced efforts in processing customs clearances by more than 10 percent.
The EFM system test illustrated how the system will impact the process of tracking and moving goods and highlighted four key improvements:
- Timeliness of the freight release process:
- Shippers could prepare paperwork at their convenience and during downtime.
- Customs clearances were processed earlier in the movement of goods.
- Status information:
- The system provided near-real-time automated status reports containing all supply-chain events that either were not available before or required significant manual effort to prepare.
- Timeliness of supply-chain data
- The system provided downstream partners with earlier access to purchase, booking, and tendering data.
- Users were able to access status data currently available only from manually prepared daily pre-alerts and status reports on demand.
- The Advance Shipment Notice (ASN) was available at least 6 hours to one day earlier than current versions. Similarly, shipment status information was available to the broker four to six hours earlier.
- Data quality on the supply chain:
- The system proved to be more accurate than existing systems, requiring less error correction.
The EFM System has delivered a non-proprietary, open-platform, web-based tool for freight tracking.
- Because of the open-platform nature of the EFM system, the tool is accessible to and inexpensive for any businesses and shippers in the United States or abroad to configure and connect with supply-chain partners. The EFM system provides small and medium-sized businesses with the same accurate, origin-todestination tracking capability characteristic of the customized, proprietary systems used by Federal Express, UPS, and others.
The EFM open architecture and EFM standards offer cost-effective implementation for businesses.
- In demonstration, the EFM system provided the supply chain partners with an efficient, secure, and reliable tracking system without requiring changes in existing business processes or purchase of new technologies or systems.
- Because EFM uses an open architecture, businesses can quickly and inexpensively find new trading and shipping partners. Integration can be accomplished using web services between different types of platforms.
The Problem
In 2007, the United States moved over $15 trillion in goods into and out of the country. Freight transport is expected to grow rapidly in years to come as markets continue to open globally. However, accurate, efficient, and inexpensive tracking methods—essential for both port security and business success—are limited. Moving freight across the world is complex, involving processes for the exchange of information between multiple partners and agencies as well as the transfer of goods between modes of transportation. As the amount of freight is set to continue to increase significantly over the next decade, it is more important than ever that shipping be cheap, efficient, accurate, and secure, and that the supply chain be technologically and operationally integrated to the maximum extent.
Efficiencies Arise from Continuous Tracking of Freight
Most American businesses that seek information on their freight as it is being shipped have two choices:
- Contract with private, end-to-end shippers that track freight using proprietary tracking systems, or
- Ship through a patchwork of mostly unconnected companies and modes, foreign and American, that pass responsibility and paperwork along with the freight.
INTERNATIONAL TRADE GROWTH FACTS AND FIGURES
- U.S. foreign trade rose from $1.2 to $2.6 trillion between 1990 and 2003.
- Over the past two decades, U.S. foreign trade in goods by value has quadrupled.
- The volume of trade moved on the U.S. transportation system is projected to increase 65 to 70 percent by 2020 from 1998 levels.
Private shipping companies, such as Federal Express and UPS, use their own customized, proprietary systems to easily track information about the status and location of their shipments as they cross the globe, resulting in accurate information from origin to destination. Shipping companies like these use electronic technologies to both identify and track the movement of goods and to provide required information to government agencies as cargo crosses borders. Efficiencies and cost savings are gained from continuous tracking—carrying capacity can be maximized, information is entered only once, and arrival and pickup times are accurately forecast. No effort, fuel, or space is wasted.
There is no similar, non-proprietary system available to industry, in particular for small- and medium-sized companies that seek the same level of service, accuracy, and efficiency in shipping. Most of our Nation's freight is shipped using a patchwork of companies—referred to as a supply chain (see Figure 3.3)—that include shippers, cargo handlers, and foreign and U.S. government agencies. Most of these partners cannot or do not communicate electronically.
Today's existing logistics and management systems are a broad and varied mix of technology infrastructures and application platforms. Typically, these systems are incompatible and unable to share data with other businesses or partners. This incompatibility is an obstacle to both the efficient identification of new shipping partners and the real-time tracking of cargo through the shipping process, resulting in delay, lost goods, and reduced efficiency along the way. The problem is compounded when freight moves across borders or from mode to mode. The existing solution, when accuracy and timing are critical for market opportunities, is to engage in the expense of a proprietary shipping service.
Electronic Freight Management
The ITS Opportunity
ITS presents the opportunity to combine recent advances in communications technologies with the efficiencies of the Internet to improve the visibility and efficiency of worldwide transportation logistics. An integrated system can transform market opportunities for businesses of all sizes, particularly small businesses, by providing them with the means to track cargo shipments in near-real-time, connect with new shipping partners, and expedite paperwork.
In cooperation with Limited Brands, Inc. and its supply chain partners, the EFM Initiative will develop, field test, and evaluate a system that integrates logistics technologies with the Internet and ITS data. The system will incorporate the characteristics of web-based, non-proprietary, easily accessible systems. It will replicate the paperwork and information processes associated with moving goods through the air-truck supply chain. The resulting application will:
- Facilitate the exchange of standardized electronic information, using systems businesses may already have in place such as Electronic Data Interchange (EDI) systems, among others.
- Provide near-real-time information on shipment status.
- Allow freight information to be made available for security screening earlier in the shipping process.
- Streamline paperwork and information processes associated with freight management.
- Improve data accuracy throughout the process.
- Minimize costs for shippers and supply chain partners.
- Provide an open architecture that shippers across all modes can access needed information on each other to efficiently form working partnerships.
With the eventual adoption and commercialization, the EFM system will be expanded to accommodate rail and marine shipping supply chains.
The EFM Approach
- Improve the efficiency and productivity of the freight logistics supply chain through the electronic exchange of shipping information from origin to destination.
- Improve data accuracy throughout the process.
- Minimize costs for shippers and supply-chain partners.
In system development, the EFM Initiative also set important goals:
- EFM can help companies replace paperwork with electronic information, freeing up human resources that were previously devoted to manual entry. Data captured once can be shared by many entities.
- Develop a system for use by authorized supply chain partners without requiring them to replace or overhaul their existing information systems.
- Work directly with the freight transportation industry to gain consensus on system requirements and standards, and to identify opportunities for implementing the EFM Initiative.
Typically, freight movements are supported by point-to-point communications, either paper-based or electronic. Using the Internet to make data broadly available to any authorized and authenticated user in real time is key to improving the exchange of information along a given supply chain, and ultimately to making freight transportation networks more efficient and secure. This type of data exchange provides buyers with easy visibility into their supply chains.
Figures 3.5 and 3.6 offer different views of the EFM web application. Figure 3.5 illustrates how, in the initial steps to set up the partners, the EFM system can list and electronically publish the authorized partners for a consignment with the list of partners subscribing to the particular message. Later during the tracking process, the EFM system captures the status of the cargo. As illustrated in Figure 3.6 on the right, the Container Freight Station (CFS) notes the arrival of the cargo in the system and can hold this cargo "in bond" until the Broker has received the proper electronic clearances from Customs. A web service publishes the information—"received by CFS"—to all authorized partners. The virtual manifest is now updated with the date and time of the receipt by the CFS.
 |
 |
Two key concepts are important to gaining efficiencies for the EFM system and make the EFM system unique in today's shipping world: the design of the system is based on an open architecture/open platform, and the system uses encryption and digital certificates to ensure information security.
Open Architecture. To help solve the problem of the wide variation in technology infrastructures and application platforms, the EFM system was designed as an open platform (or architecture). Interoperability is based on data standards that enable partners to seamlessly and dynamically exchange needed information. EFM employs commercial off-the-shelf (COTS) technology and web components that are used successfully in a variety of industries. In addition, the EFM format offers uniform access to existing, customized database formats; computing platform independence; and customizable services.
The openness of the EFM architecture lends itself to the constantly changing business environments of supply-chain transactions. By using this format, supply chain partners can automate daily business interactions and streamline business processes. Diverse technology systems can communicate with one another in a service-oriented environment, and new web services can be implemented incrementally and can leverage existing information technology by reusing them for EFM.
No central data repository needs to be deployed as part of the EFM concept; instead, cross-agency messaging is accomplished on demand and in real time. For example, one supply chain partner can log onto the Internet and automatically locate information on a shipment from another partner without having to email, telephone, or fax for updates. To further facilitate customer use, the EFM system contains a Yellow Pages-like function that standardizes the directories of information on Web services. Supply-chain partners will use this information to learn the specifics of communicating with other partners' Web services and to identify new shipping and trading partners.
Information Security. Information-sharing within EFM is implemented with strict data security requirements in mind. Secure encryption and digital certificates are part of the system to ensure that the information sent between partners is:
- Only sent and received between authorized partners.
- Not corrupted along the way.
- Complete and unadulterated.
This type of security allows multiple supply-chain partners to share data within the system with the confidence that only authorized partners have access to this sensitive business data.
The EFM Approach
To reach these goals, the EFM Initiative has been designed as a three-phased research, development, testing, and implementation effort focused on developing a web-based EFM system that streamlines freight information for American businesses at home and abroad. The EFM will provide near-real-time information-sharing and shipment tracking information among supply-chain partners—tracking the movement of goods from the time of order from the manufacturer to the time of delivery—without the need to engage private, proprietary shipping services.
Phase 1: Development of the Foundational Infrastructure, Systems Design, and EFM Standards
- Work with an expert panel comprising web services experts, including users.
- Build relationships with supply-chain shippers who are technology leaders.
- Continue outreach to various standards bodies to ensure compliance with developing standards.
- Complete the EFM system design and concept of operations.
- Tailor the concept of operations with Limited Brands and its supply-chain partners.
Phase 2: Deployment and Testing
- Develop the EFM system with Limited Brands.
- Develop a test and evaluation master plan to guide the execution of the EFM deployment.
- Implement, integrate with existing systems, and test the systems.
- Conduct evaluation, testing, data collection, and analysis.
- Define the role of government agencies.
Phase 3: Industry Adoption and Outreach
- Develop an adoption strategy that promotes increased usage and engages other modes.
- Develop a transition strategy that transfers the technology and know-how to industry.
- Develop a set of business case studies that illustrate the value and effectiveness of EFM usage.
EFM Operational Test
In 2007, the ITS Program launched an operational test of the EFM system with a real-world, existing, international air-freight supply chain. The test was conducted in partnership with Limited Brands (located in Columbus, Ohio) and its supply-chain partners in Columbus and Hong Kong. The test was operated for six months ending in December, 2007. During this operational period, over 850 consignments were completed and tracked using the EFM technologies. An independent evaluation was conducted to understand whether the EFM system met requirements for:
- System Usefulness
- Will the new technology be accepted and used by supply-chain partners to support operations?
- Will the new system be seamless in its integration with legacy systems?
- Is the new system secure?
- Cargo Visibility
- Will the system allow for improved tracking of goods?
- Will government agencies find value in the improved visibility such that the information can be used for improving transportation planning, safety, and security?
- Supply-Chain and Logistics Performance
- Will the system improve supply chain logistics performance and productivity?
- Will the system help measure or forecast congestion and pollution reduction?
- Deployment and Scalability
- Are the standards appropriate and supportive of industry requirements?
- What are the cost-benefit results?
- How well does the system work when expanded to include other users?
EFM Operational Test Highlights
The EFM field test delivered the following results:
- Reduced total travel time from Hong Kong to Columbus, Ohio from 96 to 80 hours (12 percent) within the first four months of the test because all status information was available in the EFM system, thereby negating the need to track people down physically or wait for the information to be provided (see Figure 3.7).
- Saved four hours per day in reduced labor from entering paperwork (more than 75 percent per shipment) and $259 per day in labor costs.
- Improved data accuracy by at least 12 percent by reducing the number of office trips needed to verify data or fill data gaps.
- Reduced data-entry errors by at least 15 percent by eliminating manual data entry by multiple partners, which also reduced re-keying errors.
- Reduced efforts in processing customs clearances by more than 10 percent, in part due to earlier document processing because of data availability.
- Provided the supply-chain partners with an efficient, secure, and reliable tracking system without requiring changes in existing business processes or purchase of new technologies or systems.
Figure 3.7 illustrates the transit time and highlights the improvements gained over time.
Research Findings and Important Results
The EFM System delivers a non-proprietary, open platform, web-based tool for freight tracking.
Because of the open-platform nature of the EFM system, the tool is accessible to and inexpensive for any businesses and shippers in the United States or abroad to configure and connect with supply-chain partners. The EFM system provides small and medium-sized businesses with the same accurate, origin-to-destination tracking capability characteristic of the customized, proprietary systems used by Federal Express, UPS, and others.
The results of the EFM Prototype System tests concluded that the system is capable of delivering significant gains for businesses.
Preliminary conclusions indicate that the system improved:
- Timeliness of the freight release process:
- Shippers were able to prepare paperwork at their convenience and during down-times.
- Customs clearances were processed earlier in the movement of goods.
- Status information:
- The system provided near-real-time automated status reports containing all supply-chain events that either were not available before or required significant manual effort to prepare.
- Timeliness of supply-chain data:
- The system provided downstream partners with earlier access to purchase, book, and tender data.
- Users were able to access status data currently available only from manually prepared daily pre-alerts and status reports on demand.
- The Advance Shipment Notice (ASN) was available at least six hours to one day earlier than current versions. Similarly, shipment status information was available to the broker four to six hours earlier.
- Data quality on the supply chain:
- There was a reduction in data-entry errors because of less data entry and no re-keying of data on the supply chain, making it easier for partners to respond to discrepancies.
- The system proved to be more accurate than existing systems, requiring less error correction.
The EFM open architecture and EFM standards offer cost-effective implementation for businesses.
- In demonstration, the EFM system provided the supply chain partners with an efficient, secure, and reliable tracking system without requiring changes in existing business processes or purchase of new technologies or systems.
- Because of the EFM use of an open architecture, businesses can identify new shippers and trading partners with greater speed and a minimum of resources. Integration can be accomplished using web services between different types of platforms.
- The EFM Initiative successfully moved the EFM standards toward international acceptance, without which the system cannot be adopted globally. The EFM operational test validated the exchange protocols and standards.
The text box on the following page highlights two of the web-based tools that are critical to the promotion and use of the EFM system by businesses. These tools are the EFM Website and the EFM Cost-Benefit Analysis Tool.
The EFM Website
The EFM website is located at www.efm.us.com. The website provides a description of the EFM system and the prototype used during the Columbus, Ohio test. The website includes a presentation with an audio narrative that illustrates how the EFM system works to connect trading partners with information. The presentation is located under the EFM Briefing tab. Figure 3.8 shows the front page of the EFM website.
The EFM Cost-Benefit Analysis Tool
The EFM cost-benefit-analysis tool is also located at www.efm.us.com. The tool provides a capability for shippers considering using and/or implementing the EFM system to understand the benefits available to them. The tool requests that the user identify the type and size of organization and type of data. Once this information is submitted, the benefits-cost structure is immediately generated on-screen, providing decisionmakers with information to decide if the investment is appropriate for them. The tool is located on the front page of the EFM website. Figure 3.9 illustrates the benefits-costs associated with a small- to medium-sized Customs Broker using XML data.
The EFM Roadmap
In the 2006 Five-Year Plan, the EFM Initiative was described as a three-phased initiative, with completion scheduled for 2010. The EFM Initiative is on schedule (see Figure 3.10). The EFM system development of Phase 1 is complete, and the first system test and deployment of Phase 2 was successful; the evaluation is due in Fall 2008. Phase 3, focused on industry adoption and commercialization, is the final focus of the EFM Initiative and is scheduled through 2010.
Final Steps
The EFM project is poised to advance the ultimate objective of the initiative—to improve supply-chain efficiency by advancing the adoption and integration of the EFM system and technology applications into supply-chain management. Activities are focused on three efforts to complete the EFM Initiative:
- An adoption strategy.
- A transition strategy.
- Business case studies.
EFM Adoption Strategy. The EFM Initiative adoption strategy is designed to enlist industry leaders in integrating the EFM system into their supply-chain management. Goals of the adoption strategy are to:
- Increase usage. The EFM Initiative will promote EFM system adoption in parts of the country known as freight corridors—areas that house multiple distribution centers and have access to truck, rail, and ports. The adoption strategy is to register one partner who has the ability to bring three or four trading partners into the system. In this manner, partners will be able to communicate among themselves as well as with other companies via linkages provided by the web-based EFM system.
- Engage different mode types The EFM prototype system was designed for the air-truck supply chain. The goal is to broaden the EFM system to include marine and rail supply chains.
To encourage early adoption, the EFM Initiative will support up to three companies in implementation and use with their trading partners. Support includes:
- Sharing in the cost of implementing the system, with the Department's funds primarily used to build a set of final messages that were not part of the prototype system, test the package in operation for 30 days, and document the activity from installation to operation. The EFM Initiative funding will also cover the development and deployment of a translation engine to map data between partners, if needed.
- Ongoing technical support.
In collaboration with the Intermodal Freight Technology Working Group (IFTWG), the EFM Initiative requested an expression of interest from industry regarding business interest for integrating the EFM system with existing processes. Response revealed a strong market interest in investing in and using the EFM system and technology. Responses came from a wide range of firms working across the supply-chain spectrum—shippers, logistics providers, contractors working with the customs agency, and software designers who can configure the system for companies and develop new applications. The first adoption is taking place with the Kansas City SmartPort, a leading Chamber of Commerce organization that is working to improve the supply chain visibility and efficiency in the Kansas City area, as well as globally, to aid local businesses of all sizes in moving their goods domestically and internationally (see following page for more details).
EFM Business Transition Strategy. The ITS Program is committed to transferring research and technology to industry. The EFM system, the registry, and the EFM standards will be transferred to a non-Federal entity or entities for operations and maintenance. The EFM Initiative is formulating a business strategy to transition management and maintenance of these key components. The strategy will compare the benefits of transitioning to a variety of agencies such as a publicly funded Chamber of Commerce versus independent firms that support the EFM system through transaction costs. Key criteria include:
- Ability to provide an industry-accepted governance structure.
- Knowledge and capability to maintain the EFM standards.
- Ability to provide configuration control on the software design.
- Ability to authorize and authenticate users.
The result may be a variety of structures across the Nation, with the different agencies configured to meet local and regional needs in the most relevant and appropriate manner.
EFM Business Case Studies. As a means of promoting the commercial adoption and self-supporting use of EFMrelated systems and services, the EFM Initiative will produce a set of business case studies that will:
- Define the costs and benefits associated with employing the EFM system and track the operating benefit to the company in terms of return on investment (ROI).
- Describe the degree to which the EFM system architecture and associated applications can promote improved operational efficiency and transportation within intermodal supply chains.
- Document the process of implementation to provide detailed technical guidance for the next set of EFM adopters and implementers.
- Evaluate the long-term viability and sustainability of the use of the EFM system.
The case studies will result in examples of real-world EFM system implementation and operations with a clear documentation of ROI.
Kansas City SmartPort—Leading Adopter of the EFM System
Kansas City SmartPort has agreed to be one of the first adopters of the EFM system and to assist in the development of the first EFM business case. The SmartPort and the region offer important opportunities for commercializing the EFM system—the business community is global and the region's ports and facilities host dynamic freight movements (see textbox below for statistics on the region). The SmartPort will provide the connection to key supply-chain partners within the Kansas City region for adoption and deployment of the EFM system.
The SmartPort currently hosts a Trade Data Exchange (TDE)—a web-based platform that uses EDI to provide visibility into one local major freight company's rail-to-truck supply chain. Because of the EFM's open architecture, the system is expected to integrate easily with the TDE and provide the following opportunities and benefits:
- For the EFM Initiative and the ITS Program:
- The Kansas City SmartPort adoption transfers the EFM system into commercial use.
- The implementation with SmartPort will expand the EFM system from a specific focus on the air-truck supply chain to include the rail supply chain.
- The SmartPort implementation will provide documentation for future adopters on:
- How businesses connect to, configure with, and use the EFM system.
- The level of actual investment and effort required to integrate with the EFM system.
- The benefits and return on investment.
- For Kansas City SmartPort:
- The EFM system will expand the SmartPort's TDE platform to include the air-truck supply chain.
- SmartPort will be the host for the EFM system, providing a means for all local businesses to gain visibility into their supply chain and identify new shipping partners more efficiently.
- The EFM system will allow the SmartPort to broaden its services and assist smaller companies in becoming more global, efficient, and competitive.
- SmartPort senses a great deal of excitement among its stakeholders—local companies have signed up to roll out the capability and participate in case studies.
- SmartPort believes that use of the EFM system will make the Kansas City region more marketable as an inland port to the Nation and the world.
Because of the nature of the EFM field test results with Limited Brands, both the SmartPort and the ITS Program envision that adoption of the EFM system within the Kansas City region has the opportunity to:
- Decrease truck emissions and lower truck idling times associated with waiting on shipments at ports and distribution centers.
- Decrease urban congestion by improving scheduling that will result in the elimination of unnecessary truck trips.
- Improve freight flows associated with critical supply chains that support our economy.
Kansas City Transportation and Logistics Statistics
Kansas City sits at the heart of the Nation's trade routes; it is one of the Nation's leading centers of commerce and distribution through a variety of transportation modes:
- The city hosts one of the largest rail centers in the United States by tonnage.
- It is located at the intersection of three of the Nation's major interstate highways (I-35, I-70, I-29) and the upcoming fourth interstate, I-49.
- The Kansas City International Airport moves more air cargo each year than any air center in a six-state region.
- The city is located on the largest navigable inland waterway (MO/MS River system).
- The city is the heart of a rail corridor spanning coast to coast across the U.S. and extending from Canada to Mexico (NAFTA Railway). The rail system carries 300 daily freight arrivals and departures.
- The city offers over 10,000 acres of underground storage space; hosts greeting card publishing, frozen food storage and distribution, and hard winter wheat marketing, and both General Motors and Ford have major assembly plants nearby, ranking Kansas City eighth in the nation in auto assembly.
3.1.2 Emergency Transportation Operations Initiative
The Transportation Problem
There are major transportation challenges when incidents suddenly arise:
- Over 400 tropical storms, hurricanes, tornadoes, and hazardous materials incidents on highways require evacuation each year in the United States.
- Typically there is at least a 72-hour forewarning of a hurricane evacuation and time to take appropriate advance measures.
- These, plus winter weather, wild fires, complex multi-vehicle crashes, and potential security incidents, require the United States to be prepared for any eventuality.
The transportation network plays a critical role in response—emergency responders must reach the scene quickly, victims must evacuate the danger zone, and clearance and recovery resources must arrive on time. Additionally, each stakeholder has special needs for communications and services:
- For public safety agencies the need for real-time data is especially critical during emergencies, when conditions are continuously changing.
- For travelers it is critical to receive information on road conditions and/or closures during emergencies. This is especially true when coordinating evacuations of the transportation-disadvantaged.
- For transportation operators there is a need for new tools and processes that support evacuation management and operations and transportation operations during biohazard events.
The ITS Opportunity
The application of ITS technologies to all forms of transportation emergencies can result in improved management of the emergency—ITS technologies provide transportation service and public safety agencies with the ability to communicate and coordinate operations and resources in real time. For example:
- Video and imaging technologies can be used to help identify the appropriate response and get the correct equipment and emergency personnel to and from the scene quickly and safely.
- The availability of real-time data on transportation conditions, coupled with decision-making tools, enables more effective response and coordination of resources during emergencies.
- Advances in logistical and decision-making tools enable commanders and dispatchers to implement strategies as conditions change, and to update the status of the emergency and share the knowledge among many partners simultaneously.
- Advances in communication and information systems provide an opportunity for travelers and system operators to access essential real-time data about conditions on routes throughout the affected region.
- Systems and networks connected across jurisdictions enhance the ability of transportation agencies to coordinate response with other stakeholders.
The ETO Initiative Approach
The ETO Initiative activities include:
- Assess, develop, and test new tools and processes for information sharing, evacuation management and operations, and transportation operations during biohazard events.
- Apply ITS to support transportation system operations and strategies during large-scale emergencies, including those that require evacuations.
Accomplishments to Date
Worked in partnership with the Federal Highway Administration (FHWA), the National Highway Traffic Safety Administration (NHTSA), and the Federal Transit Administration (FTA) to:
- Develop and demonstrate innovative procedures and technologies for more coordinated public safety and transportation operations that improved the speed and effectiveness of response and management of major incidents.
- Provide tools, procedures, and information that can be used to actively manage and therefore expedite the safe progress of an evacuation.
- Increase transportation safety and mobility through new and dynamic partnerships linking the transportation and public safety communities—including law enforcement, fire and rescue, emergency medical service (EMS) providers, emergency managers, and emergency communications providers—at the Federal, State, regional, local, and tribal levels.
ETO Initiative Results to Date
The ETO Initiative resulted in the development of 16 resources that address critical transportation roles, processes, and operations during emergencies and evacuations and provide critical tools to enhance decision-making in three areas:
- Enhanced Information Sharing: Four resources address improvements in public safety with a focus on sharing information across and among organizations—such as law enforcement, fire, emergency medical response, tow truck drivers, and transportation operators—and jurisdictions.
- Evacuation Management and Operations: Eight resources provide an assessment on the stateof- the-practice and provide new tools and processes to help agencies plan for and manage evacuations, with a particular focus on events that occur with little or no warning.
- Transportation Operations During Biohazard Situations: Six resources provide a comprehensive and actionable understanding of the role of transportation during a biohazard situation and assist communities in better planning for, responding to, and recovering from such situations.
The ETO Initiative provided guidance to State and local agencies on effective evacuation modeling techniques.
- Early research results in 2006 determined that there was an adequate spectrum of commercial tools to support evacuation traffic decisions and operations; however, there was a significant lack of understanding among transportation and emergency management stakeholders of the capabilities and limitations of these tools. With this insight, the ETO Initiative was restructured to assess and test commercially available modeling products and provide corresponding detailed guidance to State and local stakeholders.
The ETO Initiative assisted in harmonization of data standards between transportation and emergency operators.
- Collaboration with the Department of Justice revealed an overlap in message sets of the standards used by public safety systems (GJXDM) and the standards for transportation incident management (IEEE 1512). This insight resulted in the opportunity to harmonize the standards, develop a method for data conversion, and test the capability to support connectivity between transportation operations centers and local emergency operations centers. A field operational test in Houston, Texas is expected to show the following benefits:
- Information exchange with increased data accuracy, timeliness, and automation (use of fewer resources).
- Reuse of exchanges, leading to time and cost savings.
- Enhanced Response, leading to greater situational awareness, more effective response with the ability to identify and use appropriate equipment, and more efficient response at the right time.
The ETO resources, reports, tools, and knowledge are easy to access.
- All resources are available on a 2008 CD-ROM (by emailing ITSPUBS@dot.gov) or available at the website: www.its.dot.gov/its_publicsafety/index.htm.
The ETO Initiative
During transportation-related emergencies, the use of ITS technologies can result in improved management of the emergency. ITS technologies provide transportation service and public safety agencies with the ability to communicate and coordinate operations and resources in real-time. They support the data collection required for effective coordination of changing transportation system conditions and allow for the real-time implementation of operational and logistical strategies in cooperation with many partners. Efficient and reliable voice, data, and video communications further provide agencies with the ability to share information related to the status of the emergency, the operational conditions of the transportation facilities, and the location of emergency response resources.
ITS communications and services can effectively address a wide range of stakeholder needs for information:
- For public safety agencies, advances in logistical and decision-making tools can enable commanders and dispatchers to implement strategies as conditions change. Advances in communication and information systems provide an opportunity to access essential real-time data about conditions on routes throughout the affected region. The need for real-time data is especially critical during emergencies, when conditions are continuously changing. ITS can be used to help identify the appropriate response and get the correct equipment and emergency personnel to and from the scene quickly and safely.
- For travelers, it is critical to receive information on road conditions and/or closures during emergencies. This is especially true when coordinating evacuations of the transportation-disadvantaged.
- For transportation services, the availability of real-time data on transportation conditions, coupled with decisionmaking tools, enables more effective response and coordination of resources during emergencies. ITS also enhances the ability of transportation agencies to coordinate response with other stakeholders.
The ETO Initiative was launched in 2004 with the goal of improving the safety, speed, and effectiveness of response and management of major incidents. To accomplish this, the ETO Initiative focused on:
- Developing and testing new tools and processes.
- Applying ITS to support transportation system operations and strategies during large-scale emergencies, including those that require evacuations.
- Fostering close partnerships with the public safety community, State and local departments of transportation, public transportation service providers, and emergency managers to determine their specific needs and test a range of solutions to enhance the operations of transportation systems during emergencies.
To address the diverse nature of emergency transportation operations and the stakeholder's responsibilities, a range of activities were initiated focusing on the following functional areas:
- Enhanced Information Sharing—Improving the ability to share information across organizations and jurisdictions including law enforcement, fire, emergency medical response, tow truck drivers, and transportation operators.
- Evacuation Management and Operations—Developing new tools and processes to help agencies plan for and manage evacuations, particularly where there is little or no advanced warning.
- Transportation Operations During Biohazard Situations—Providing a more comprehensive and actionable understanding of the role of transportation during a biohazard event so that communities can better plan for, respond to, and recover from such a situation.
A detailed summary of the results in each of these areas is provided in the following pages. No roadmap is provided because the Initiative is complete as of December 2008.
Research Results—Enhanced Information Sharing
The ETO Initiative resources improve public safety information sharing. Four ETO Initiative projects resulted in resources that address improvements in public safety through sharing information across and among organizations—law enforcement, fire, emergency medical response, tow truck drivers, and transportation operators—and jurisdictions22:
- CapWIN Camera Phone Proof-of-Concept Project. The July 2007 guidance report is a compilation of documents created during the Camera Phone Proof-of-Concept (POC) Project. The project demonstrated the feasibility of using commercial cellular phones equipped with cameras to capture and deliver traffic incident imagery that is useful to follow-on responders, such as tow companies, HAZMAT remediation services, health departments, or highway repair teams. It also assessed the value of these images to follow-on responders based on improvements in time, safety, and efficiency while responding to and clearing traffic incidents. The guidance report is meant to assist state and local transportation and public safety agencies in creating similar systems in their jurisdictions.
- The Public Safety/Transportation Information Exchange Project. This project was a joint effort between the Department of Transportation (DOT) and the Department of Justice (DOJ) to standardize information exchanges between systems that support highway incident responders and traffic managers. At the heart of the project, the DOT's IEEE 1512.2 standards were applied to standardize incident management messages exchanged between public safety and transportation information systems. Led by the DOJ, stakeholders were brought together to mitigate the differences between the data standards. Two key outcomes to this project are23:
- GJXDM/IEEE 1512 Compatibility Analysis Report. A March 2007 report summarizes the lessons learned in a joint ITS Public Safety Program—Department of Justice project that developed a standards-based approach to critical information exchange between transportation and public safety agencies. Figure 3.11 summarizes these critical information flows.
- Field Operational Test Results. A Fall 2008 report will document the final results of a field test that was conducted in Houston, Texas to validate the findings of this work and to test the standardized message sets. Project partners in this field test were Harris County Toll Road Authority, Metropolitan Transit Authority of Houston and Houston Transtar, the Houston region's Transportation Management Center.
- Communicating with the Public Using ATIS During Disasters: A Guide for Practitioners. This April 2006 report provides advice on the use of Advanced Traveler Information Systems (ATIS) during disasters and is intended not only for State, local, and tribal transportation agencies but also for their partners in public safety and emergency management agencies. It offers practical guidance to managers of Transportation Management Centers and emergency operations and to public information officers who may be called on to staff joint information centers during disasters.
- Communicating with the Public Using ATIS During Disasters — Concept of Operations. This March 2006 report provides a concept of operations for dissemination of information to the traveling public during disaster events. The report illustrates how agencies need to communicate with each other and the type of data and information that needs to be shared to effectively manage and deliver traveler information during disaster response operations.
Research Results—Evacuation Management and Operations
Much of what is known about evacuations is based on preparations for incidents such as hurricanes, which enables advance warning. Consequently, there is a need for new tools and processes to help agencies plan for and manage evacuations when there is little or no advance warning. Eight projects resulted in the following resources24:
- Assessment of State of the Practice and State of the Art in Evacuation Transportation Management (Case Studies). These case studies, developed in February 2006, identify commonalities and unique distinctions among the cross-section of incidents to identify successes, lessons learned, and best practices that can serve as guidance to agencies in their planning for and management of evacuations. These case studies include:
- El Dorado, Arkansas: Hazardous-material fire
- Graniteville, South Carolina: Chlorine gas incident
- South Salt Lake City, Utah: Hazardous chemical leak from a tanker car
- Southern California: Wildfires
- Assessment of State of the Practice and State of the Art in Evacuation Transportation Management (Literature Search). This February 2006 report draws upon a collection of relevant domestic and international evacuation reference materials—ranging from plans, policies, and procedures taken from newspaper and magazine articles, journals, industry publications, and other reports—to assess and document what is currently known about the management of evacuations and transportation management during evacuation situations.
- Evacuation Transportation Management (Interview and Survey Results). This June 2006 report documents emergency evacuation plans and practices employed by transportation management organizations in several large metropolitan areas within the United States. The authors discuss specific practices using ITS and related traffic management tools; interviews with 14 public and private transportation agencies from five large metropolitan areas are included. Metropolitan areas include:
- San Francisco, California
- Portland, Oregon
- Phoenix, Arizona
- Jacksonville, Florida
- Charleston, South Carolina
- Evacuation Transportation Management (Operational Concept). This June 2006 report outlines a concept of operations for transportation management during a major no-notice event or disaster requiring evacuation. It illustrates how agencies interact with each other, what information is shared, and how transportation systems are effectively managed during disasters. It also addresses the key questions—who, what, when, where, why, and how—that transportation management systems need to operate during a major no-notice event or disaster requiring evacuation.
- Evacuations Management Operations (EMO) Modeling Assessment: Transportation Modeling Inventory. This June 2007 report documents more than 30 surface transportation modeling tools that have been or could be applied to evacuation modeling. The modeling inventory includes a description of each modeling tool and cites case studies where selected tools have been used to model evacuation events. It also provides an analysis of the tools as they relate to a modeling spectrum according to scope and analytical complexity, including a discussion of how the decisions supported by analysis drive tradeoffs in terms of scale and computational speed.
- Evacuation Model Inventory and Assessment. More than 30 surface transportation modeling tools were examined to understand their scope and analytical complexity, including how analysis can result in decision tradeoffs. The findings of this assessment serve as the basis for the Evacuation Management Operations (EMO) Modeling User Guide.
- Evacuation Model Users Guide. This ETO Initiative follow-on activity involved analyzing a variety of modeling approaches that offer a range of computational complexity and a continuum of geographic scale. The objective of the analysis was to address the need of State and local stakeholders for clear guidance on the capabilities and limitations of off-the-shelf traffic modeling and simulation tools. This assessment examined the ability of various modeling approaches to support decision-making activities ranging from real-time (answer needed immediately) to planning exercises. The product of this activity is a User Guide that provides concise and accessible guidance based on the technical findings in the inventory and assessment activities for agencies considering the incorporation of evacuation modeling tools into their emergency management planning or real-time decision-making.
- Low-Cost Surveillance for Rural Evacuation Routes System (Final Report). This November 2005 report summarizes the Low-Cost Surveillance for Rural Evacuation Routes System (LCSRERS) pilot project, the project's findings, and the system recommendations resulting from pilot system testing and analysis. The project demonstrated a low-cost surveillance system that can be used to monitor rural evacuation routes that would typically not utilize surveillance due to normally low traffic volumes.
Modeling is a term that can be applied to a wide range of analytical tools. In transportation, models are computer programs that allow planners and system operators to construct a computer-based representation of their transportation networks and systems using real data to describe it. Models allow analysts to vary the data and evaluate how a change to one part of the system might impact other parts. Outputs can be in the form of graphs, images, or charts.
In evacuation planning, models present decision-makers, planners, and system operators with the opportunity to understand, beforehand, the wide range of impacts that can occur due to an event. The following graphics illustrate the types of visualizations and details that are provided by evacuation models. The image on the left allows system operators to visualize changes to their transportation networks at three levels—macroscopic, mesoscopic, and microscopic. Macro models can illustrate regional changes; micro models provide very precise results on smaller aspects of a network such as changes in congestion around a specific interchange; and meso models fall in between, generally representing regional roadway links, but not at the level of individual lanes.
The image to the right presents different information for decision-makers. It offers a visual understanding of the trade-off between time required to prepare for an event and the potential scope of the geographic impact. For example, special events typically allow for multiple days, weeks or months of planning and only impact a small geographic area (a single interchange or a larger, freeway segment). On the other hand, a terrorist event can happen with little or no warning and impact an entire metropolitan region providing little, if any, time to prepare and highlighting the critical need for pre-planning and scenario building.
Further details are available at: www.its.dot.gov/its_publicsafety/emo/emo.pdf
Research Results—Transportation Operations During Biohazard Situations
The events of September 11, 2001 marked a distinct change in how transportation agencies plan for emergency events. Prior to this date, transportation agencies focused on their role during weather-related incidents such as snowstorms, floods, and hurricanes. Since the events of 9/11, agencies have shifted their attention to the wide range of potential manmade accidents and malevolent events, including terrorist strikes that could occur without notice and that would require immediate, coordinated response efforts concurrent with accident, law enforcement, or national security investigations. One type of incident—a biohazard emergency—presents challenges that are potentially even greater than those posed by a large-scale evacuation. A biohazard release could simultaneously require both restricting and facilitating mobility of those affected.
The Application of Technology to Transportation Operations in Biohazard Situations project provides a comprehensive and actionable understanding of the role of transportation during a biohazard event so that communities can better plan for, respond to, and recover from such a situation. Six resources were developed as part of this project25:
- Applications of Technology to Transportation in Biohazard Situations (Final Report). This December 2005 report includes recommended practices and additional research needs that were identified as part of this project. The report includes sections on recommended practices and additional research needs.
- Applications of Technology to Transportation in Biohazard Situations (Literature Review). This May 2005 compilation summarizes a literature review and draws upon background information on biohazards and biohazard events. It includes documents that describe the role of transportation during a biohazard event and documents with plans, guidance, and analytical tools for transportation response.
- Applications of Technology to Transportation in Biohazard Situations (Transportation Biohazard Operational Concept). This August 2005 report supports the efforts of agencies in defining their organizational structure, roles and responsibilities, processes, and policies for managing a biohazard event. The operational concept clarifies the transportation functions to be performed during a biohazard situation by specifying the processes through which they are accomplished.
- Applications of Technology to Transportation in Biohazard Situations (Transportation Activities and Applications of Technology). This November 2005 report provides functional requirements and specifications for communications and ITS technologies that would be applicable during and in response to a biohazard event. It also recommends a set of technologies that would be especially useful.
TRANSPORTATION OPERATIONS DURING
BIOHAZARD EVENTS
Learning Tool
The learning tool offers four topics for getting started:
- Why should a transportation agency by concerned about a biohazard event?
- Who will most benefit from the Learning Tool?
- What are the main issues and features included in the Learning Tool?
- How should you navigate through the Learning Tool?
- Applications of Technology to Transportation in Biohazard Situations (Workshop Summary). This report summarizes the results of a July 18, 2005 workshop at the University of Wisconsin at Madison. This workshop was held: (1) to obtain information from a cross-section of transportation, public safety, emergency management, public health, and veterinary medicine officials regarding expected roles, responsibilities, activities, and needs during response to biohazard emergencies and (2) to validate a draft Operational Concept prepared for State Departments of Transportation (DOTs) to support activities to develop a viable biohazard response capability.
In addition to these resources, the ETO Initiative, FHWA, and partners have produced an online tool—The Transportation Operations During Biohazard Events Learning Tool—designed to inform transportation agencies about the role of transportation operations and technologies in addressing a biohazard incident and to help improve plans for dealing with such incidents. The tool walks the user through four topics (see side textbox) and is available at:
www.its.dot.gov/eto/docs/transops_biohazard/learning_tool/index2.htm.
3.2 Research Initiatives Moving into Real-World Testing
The remaining ITS initiatives described in the last program plan are well under way and will be approaching completion after significant real-world testing over the next two years. The research initiatives are:
3.2.1 Vehicle Infrastructure Integration (VII)—developing the capacity for vehicles to communicate with each other and with the roadway and developing an information infrastructure that will support critical safety applications, improve the safety and mobility of the roadway environment, broaden travel options, and assist in reducing the environmental impact of transportation.
3.2.2 Cooperative Intersection Collision Avoidance Systems (CICAS)—improving safety by enhancing driver decision-making at intersections to help drivers avoid crashes.
3.2.3 Integrated Vehicle-Based Safety Systems (IVBSS)—creating an integrated crash-alert system for the three most common causes of crash-related fatalities.
3.2.4 National Surface Transportation Weather Observing and Forecasting System (Clarus)—integrating a wide variety of weather observing, forecasting, and data management systems to deliver timely, accurate, and reliable weather and road condition information as a means of impacting decisions by both drivers and transportation operators and alleviating the safety and congestion effects of adverse weather.
3.2.5 Integrated Corridor Management (ICM)—improving multimodal congestion management in the Nation's most critical metropolitan corridors.
3.2.6 Next Generation 9-1-1 (NG9-1-1)—updating the Nation's antiquated 9-1-1 emergency calling system.
3.2.7 Mobility Services for All Americans (MSAA)—coordinating and improving mobility options for the handicapped and other historically transportation-disadvantaged communities.
3.2.1 Vehicle-Infrastructure Integration Initiative
The Transportation Problem
Transportation crash statistics in the United States paint a stark and compelling need to develop and implement new, more aggressive safety solutions. There are an average of six million crashes and 41,000 fatalities, resulting in direct economic costs of $230.6 billion in year 2000 dollars.
In recent years, the decline in crash rates has been relatively stagnant, indicating that the Nation needs a fundamentally new approach to safety. In addition to fatalities and injuries, traffic crashes account for 25 percent of all congestion and close to $20 billion per year in congestion-related costs.
The ITS Opportunity
ITS technologies offer the opportunity to move aggressively toward implementation of active safety solutions— the delivery of location-specific advisories, alerts, and warnings to drivers that provide greater awareness of the safety risks and mobility options on the roadway, as they are occurring and in real time. Technologies can target crashes through two primary approaches:
- Autonomous technologies—sensor-based systems that assist individual drivers with detection of threats and hazards within their environment.
- Cooperative systems—vehicle- and infrastructure-based systems that work cooperatively through wireless communications to detect threats and to create a networked environment that acts as a multiplier of information—data on a threat or hazard gathered from one vehicle or one point in the infrastructure can be broadcast to many nearby drivers and create warnings or advisories for avoiding the hazard.
The VII Initiative is focused on cooperative systems—integrating technologies that enable equipped vehicles and infrastructure to "sense" the movement of vehicles and other roadway users; in particular, to "sense" riskier movements that create the potential for a crash. To achieve this level of "smart" integration, VII combines:
- Wireless Communications to create a networked environment that enables rapid and secure data exchange.
- Advanced Devices for "sensing" threats.
- Advanced Applications that include combinations of hardware and software for calculating the probability of crashes and for triggering advisories, alerts, and warnings with relevant and actionable information.
When combined, these technologies form an integrated, networked environment that can provide all users with a greater situational awareness—or a full 360-degree awareness—of the events, risks, and opportunities within the environment immediately surrounding the vehicle, as well as nearby roadway conditions.
The VII Initiative Approach
The VII Initiative is researching and evaluating the feasibility of a VII-networked environment, the range of technologies and their capabilities, institutional issues, and benefits. It has evolved into a three-track approach:
- Original VII Architecture. The first VII architecture was developed using exclusively wireless dedicated shortrange communications (DSRC) as the exclusive communications technology. In 2004, research identified DSRC as the only technology with the required performance capabilities for simultaneously hosting a range of active safety and mobility applications and commercial services transactions, while prioritizing safety. At the core of this original VII architecture is a networked environment supporting vehicle-to-infrastructure and vehicle-tovehicle (V2V) communications. A key design and operating assumption of this architecture is that, when implemented, VII would be one interconnected network.
- V2V Architecture. In 2006, the Vehicle Safety Communications-Applications (VSCA) was established, built on the recognition that vehicle-to-vehicle communications can overcome limitations faced by autonomous technologies by providing significant additional information on vehicle movements that lead to crashes.
- SafeTrip-21 Field Test. Since 2004, consumer electronics and telecommunications technology capabilities have evolved rapidly, generating important new opportunities for VII:
- Mobile devices are now equipped with greater computing capabilities, GPS capability, and a greater ability to host a wider array of applications.
- Near-ubiquitous wireless coverage now exists across the Nation and continues to evolve to include faster, more secure, higher-quality capabilities.
- In 2007, SafeTrip-21 allowed the VII Initiative to incorporate these new devices and commercially available communications, potentially creating the ability to deliver some VII services faster, less expensively, and in the near term.
Through this process of evolution, the VII Initiative and its partners recognize the need to migrate the original VII architecture capabilities into an open-platform framework that allows for the integration of a wider array of technologies and ensures that, over time, VII will always be able to incorporate the most innovative applications and capabilities for robust system performance.
VII Initiative Accomplishments
- Development of the first VII architecture and a concept of operations that describe a variety of State and local use case scenarios; safety, mobility, and commercial applications; and technical requirements for system performance and security.
- Development of the DSRC standards that enable system interoperability and facilitate integration. Interoperability is paramount to safety to ensure that time-critical information can be transmitted across the network with no barriers.
- Development of the first VII technologies—vehicle-based on-board equipment (OBEs) and infrastructure- based, multi-channel roadside equipment (RSEs)—used in the process of data gathering, transmission, and broadcast.
- Design of a novel approach to large-scale network security that ensures privacy and anonymity, leveraging a well-established approach to security that can protect sensitive communications and transactions.
- Establishment of the first VII prototype system in a real-world environment (known as the development test environment) and the design of POC tests for evaluating the performance of the system and for testing applications.
- Modification of the VII architecture and DSRC standards for enabling a V2V capability; the definition of six safety applications that address frequent crash types and that are most effectively addressed by V2V.
- Launch of the SafeTrip-21 field test to assess the ability to deliver some VII through mobile devices and commercially available communications such as cellular and WiFi.
- Initiation of the process to migrate the VII architecture to an open platform. Two workshops held in 2008 engaged industry in discussions regarding technical opportunities and limitations.
Initiative Results to Date
The VII network concept works.
- The system architecture was successfully implemented as a fully functioning prototype system. The architecture supports fully interoperable two-way end-to-end communications.
- DSRC communications performed well. The DSRC protocols can prioritize radio channel access for safety while also supporting other applications. Safety applications were proven to always be given higher priority in testing.
The VII system provides the capability for vehicles to "talk" with each other in an interoperable, rapid, and secure manner.
- In the VII POC tests, cars from multiple vehicle manufacturers exchanged data using DSRC communications with 99 percent reliability up to 75 meters and over 90 percent reliability up to 100 meters.
- Data-transmission speeds of over 6 megabytes per second and latencies well under 100 milliseconds were sufficient to support timely warnings and alert drivers to imminent hazards.
- V2V "heartbeat" messages containing vehicle status information were sent between vehicles under a wide variety of road conditions. Message reception for vehicles approaching each other at road speed was greater than 99 percent at a range of 75 meters or less.
The POC results revealed that the VII system is robust against intrusions and attacks.
- The POC demonstrated that the communications security system can prevent hackers from introducing fake messages into the system, thereby providing assurances that any messages received are legitimate.
The Problem
Targeting Highest Priority
Crash Types for VII Research
NHTSA research into crashes has resulted in the development of a pre-crash scenario typology, or a method for portraying each crash scenario by contributing factors and circumstances in terms of the driving environment, driver, and vehicle. The typology groups crash types into 37 scenarios based on a review of police-reported crashes involving at least one light vehicle (passenger cars, Sport Utility Vehicles, pick-up trucks, and minivans). The crash types portrayed in the typology cover approximately 99 percent of the six million crashes. With this research, the VII Initiative has been able to identify, prioritize, and invest in the most serious crash types that can be effectively addressed through VII.
The report can be found at:www.nrd.nhtsa.dot.gov/pdf/nrd-12/Pre-Crash%20Scenario%20Typology
%20-%20Final%20PDF%20
Version%205-2-07.pdf
Transportation crash statistics in the U.S. paint a stark and compelling need to develop and implement new, more aggressive safety solutions.26 In 2007:
- The nation experienced 6,024,248 crashes.
- 41,059 were fatalities. This is equivalent to 113 fatalities each day, or one every 13 minutes.
- Direct economic costs totaled $230.6 billion (in year 2000 dollars).
In addition to fatalities and injuries, traffic crashes account for 25 percent of all congestion and close to $20 billion per year in congestion-related costs. Although the environmental costs of motor vehicle crashes and congestion have not been calculated, idling vehicles during incident detection, response, and recovery result in unproductive fuel consumption and carbon emissions.
Historically, State and local agencies have addressed crash problems through strategies such as roadway design improvements, larger and brighter signs and pavement markings, or awareness campaigns. These strategies have been successful in alerting drivers to the potential threats in the roadway environment. Similar improvements in vehicle technologies, such as airbags or automated braking systems, have contributed to a reduction in crashes. In recent years, however, the decline in crashes has been relatively stagnant, indicating that the Nation needs a fundamentally new approach to safety.
Advanced technologies offer a promising solution and an opportunity to aggressively address transportation problems. In particular, advanced technologies provide the capability to harness the power of real-time, dynamic exchange of information that can enable dramatic gains in safety and mobility.
The ITS Opportunity
ITS technologies offer the opportunity to move aggressively toward implementation of active safety solutions—the delivery of location-specific advisories, alerts, and warnings to drivers that provide greater awareness of the safety risks and mobility options on the roadway, as they are occurring and in real time. Technologies can target crashes through two primary approaches:
- Autonomous technologies—sensor-based systems that assist individual drivers with detection of threats and hazards within their environment. Autonomous technologies can include vehicle-based systems such as the IVBSS system or adaptive cruise control or infrastructure-based systems such as dynamic message signs or the Stop Sign Assist displays as part of the CICAS program.
- Cooperative systems—vehicle- and infrastructure-based systems that work cooperatively through wireless communications to detect threats and to create a networked environment that acts as a multiplier of information, such as data on a threat or hazard gathered from one vehicle or one point in the infrastructure can be broadcast to many nearby drivers and create warnings or advisories for avoiding the hazard.
The VII Initiative is focused on cooperative systems integrating wireless communications with advanced devices and software applications that enable equipped vehicles and infrastructure to "sense" the movement of vehicles and other roadway users; in particular, to "sense" riskier movements that set up the potential for a crash. To achieve this level of "smart" integration, VII combines:
- Wireless Communications. To create a networked environment that enables rapid and secure data exchange, VII utilizes emerging and commercially available wireless communications technologies:
- Dedicated short-range communications (DSRC) have the technical capability to support or enable time-critical safety applications through extremely rapid and highly secure data exchange (see side text box for description of time-critical applications). DSRC communications are enabled through vehicle-based on-board units and roadside equipment with installed DSRC radios (transmitters and receivers) along with GPS capabilities (see device images to the right). However, to implement VII through DSRC will require a strategy for deploying equipment on State and local transportation infrastructure and on all or most vehicles.
- Cellular and WiFi communications offer near-ubiquitous coverage across the Nation, thereby significantly simplifying implementation. Use of commercially available options, however, introduces limitations on the ability to prioritize transportation safety messages across the system; also, neither cellular nor WiFi can currently provide the same assurances for security, reliability, and latency performance needed for time-critical safety applications. They do, however, offer a convenient platform for providing mobility information and "soft" safety advisories due to widespread ownership and use of mobile devices by citizens on the move.
- Emerging technologies. Current cellular technology, known as second generation or 2G, is designed primarily for voice communications. Telecommunications companies are rapidly transitioning to the third generation (3G) cellular that enables broadband data transmission and offers more continuous, reliable connections. 4G, currently under development and expected in 2012, will offer comprehensive Internet Protocol (IP) capabilities with higher data rates and streaming multimedia. Innovative systems also being researched include such concepts as Vehicle Ad-Hoc Networks (VANETs) that may offer new VII opportunities.
"Hard" Safety versus "Soft" Safety
To confidently and effectively address safety as a part of VII (in particular, crash scenarios), VII technical requirements take into account the timing capabilities of communications technologies (for data delivery) and safety applications (for processing).
"Hard safety" is an informal, short-hand term for describing communications and applications that are time-critical—crash prevention requires less than a second timing for data processing and delivery, and requires the ability to clear the communications channel to deliver only safety messages (prioritization of safety). DSRC, for example, offers message delivery speeds of under 100 milliseconds or 1/10 of a second. Hard safety warnings include red light violation warnings that are being developed under CICAS-V, or emergency brake warnings that are under development in the V2V research.
For "soft safety," by comparison, timing is important but not as critical. Instead, processing and delivery of data and information can take a few seconds or more and still be effective when advising or alerting the driver to a safety-related event such as an upcoming school zone or an advisory regarding adverse roadway conditions ahead.
By looking at the timing requirements in this manner, VII can utilize the most appropriate and effective communications technologies and applications available to address safety.
- Advanced Devices. For "sensing," VII must have the capability to collect data on vehicle speed and direction (through GPS) at a minimum. Currently, VII employs two types of devices—embedded and aftermarket (see Figures 3.14 and 3.15):
- Embedded devices include vehicle-based and infrastructure-based DSRC devices. Vehicle-based devices are installed during the manufacturing process and have the ability to draw data directly from the vehicle for sensing, as they are connected directly to the vehicle databus. Embedded DSRC devices have the ability to communicate a wider range of highly accurate data on vehicle speed, acceleration and deceleration, yaw rate, turning maneuvers, windshield wiper activity, and braking and traction control, among other characteristics. Embedded infrastructure devices have the ability to house applications and generate and transmit data such as traffic signal timing. Embedded devices are being demonstrated in the VII POC tests and enable the V2V capability.
- Aftermarket devices that can be used in transportation include electronics such as cell phones or PDAs (also referred to as "carry-in" devices) that include GPS positioning capability for calculating a vehicle's speed and direction. A range of these devices will be demonstrated through the SafeTrip-21 field test. Aftermarket devices are not produced for integration with the vehicle databus and do not have access to the same detailed data on vehicle movements. These devices can, however, offer robust capabilities for providing "soft" safety and mobility advisories. Because of the more recent addition of GPS to aftermarket devices, they are able to provide "probe" data that is continuously and anonymously collected and communicated to the system network on generic location information; the generation of millions of these data points can, for instance, identify congestion in real time without the need for extensive or dedicated transportation communications infrastructure. Aftermarket devices are also evolving to include DSRC capability.
New research will explore retrofit devices that are integrated with the vehicle after manufacturing. By comparison to carry-in devices, retrofit devices may offer a limited opportunity to connect with the vehicle databus and deliver some of the capability similar to embedded devices. If feasible, retrofit devices may also offer the possibility of faster market availability in addition to the opportunity to equip existing vehicles during the time gap in which automotive manufacturers are ramping up production for VII-equipped vehicle lines.
- Advanced Applications. For targeting specific safety and mobility problems, VII includes a range of applications and combinations of hardware and software that can calculate the probability of a potential crash and trigger advisories, alerts, and warnings that present relevant and actionable information to drivers. Applications currently being addressed through VII are identified in the Table 3.1 and on the next pages.
| Type | POC Application Name | Description27 |
|---|---|---|
| VII POC Public | Traveler Information | Receives anonymous GPS and vehicle sensor data (called probe data) from VIIenabled vehicles and analyzes it to determine travel-related information such as travel times and delays. It also sends traveler advisory messages to VII-enabled vehicles. |
| Signal Timing Optimization | Receives anonymous probe data from VII-enabled vehicles and analyzes it to produce the information necessary for determining the performance of signal systems and generating optimized signal timing plans. | |
| Ramp Metering | Receives anonymous probe data from VII-enabled vehicles and analyzes it to produce the information necessary for determining the performance of ramp metering systems and generating optimized ramp metering plans. | |
| Weather Information | Receives anonymous probe data from VII-enabled vehicles and analyzes it to determine road-weather related information such as slippery conditions and icy patches. It also sends weather advisory messages to VII-enabled vehicles. | |
| Corridor Management: Planning Assistance | Receives anonymous probe data (called trip path data) from VII-enabled vehicles that "opt-in" to provide such data. It then analyzes the data to determine travel patterns such as origin-destination information, to support capital planning activities. | |
| Corridor Management: Load Balancing | Receives anonymous probe data from VII-enabled vehicles and analyzes it to determine traffic related measures such as speeds and lane closures that can be used to support strategies for balancing the traffic load within a corridor. | |
| VII POC Private | In-Vehicle Signage | Receives a wide variety of dynamic traveler information, enhanced roadside information, and safety-related information supplied by various sources, and presents it to the VII-enabled vehicle's driver based on the location, priority, and situation relevance of the information. |
| Off-Board Navigation | Enables drivers of VII-enabled vehicles to request directions, and then provides turn-by-turn navigation cues to the driver based upon location and situation, without the need for a navigation engine and map database on board the vehicle. | |
| Pay for Parking | Allows drivers of VII-enabled vehicles to securely pay for parking through direct communications between the vehicle's on-board equipment and the parking facility's on-site payment infrastructure. | |
| Pay Toll | Allows drivers of VII-enabled vehicles to securely pay tolls through direct communications between the vehicle's on-board equipment and the toll facility's on-site payment infrastructure, while the vehicle is traveling at highway speeds. | |
| VII POC Safety | Heartbeat | Allows VII-enabled vehicles to collect their GPS position and vehicle sensor data periodically and broadcast it to surrounding VII-enabled vehicles. This data is used in applications that enhance driver's situational awareness and improve safety. |
| Signal Phase and Timing/Geographic Information Description (SPAT/GID) | Provides VII-enabled vehicles with information about the current phase and timing of an approaching traffic signal and a complete description of the signalized intersection's roadway geometry and its allowable turns and restrictions. This information is used in applications that improve intersection safety. | |
| Vehicle-to-Vehicle Communications | Emergency Electronic Brake Light (EEBL) | Helps avoid or mitigate rear-end crashes, especially multi-vehicle crashes in dense traffic. EEBL issues warning to the driver of the host vehicle of an emergency or hard braking event by a vehicle ahead in traffic, even when driver's line of sight is obstructed by other vehicles or bad weather conditions (e.g., fog, heavy rain). |
| Forward Collision Warning (FCW) | Helps drivers avoid or mitigate rear-end vehicle collisions. FCW issues warning to the driver of the host vehicle in case of an impending rear-end collision with a vehicle ahead in the same lane and direction of travel. | |
| Intersection Movement Assist (IMA) | Targets a subset of intersection crashes related to stop-sign-controlled and uncontrolled intersections. IMA warns the driver of a stopped or slow-moving vehicle about to enter an intersection when it is not safe to enter because of high collision probability with cross traffic. | |
| Blind Spot Warning plus Lane Change Warning (BSW+LCW) | Targets the reduction or mitigation of crashes due to vehicle lane change maneuvers. BSW+LCW application issues various stages of warning to the driver of the host vehicle during a lane change attempt if the vehicle's blind spot is, or will soon be, occupied by another vehicle traveling in the same direction. | |
| Do Not Pass Warning (DNPW) | Targets a subset of oncoming crashes when a driver attempts to pass a slower vehicle on a two-lane road with on-coming traffic present. DNPW warns drivers who intend to pass slower-moving vehicles ahead by moving into the passing zone of the adjacent lane that is or will be occupied by another vehicle traveling in the opposite direction. | |
| Control Loss Warning (CLW) | Targets a subset of crashes involving poor road conditions. CLW warns drivers about to enter a zone where another driver has recently lost control of the vehicle. | |
| SafeTrip | Situational Safety Alerts | Improves drivers' situational safety by providing static information (such as school zones, speed zones, and clearances) and dynamic information such as curve over-speed, slow/stopped traffic, work zones, known safety "hot-spots," and other hazardous conditions. |
| Pedestrian/Bicycle Safety Alerts | Improves pedestrian/bicycle safety by alerting drivers to the presence of pedestrians using DSRC/WiFi connectivity. Similarly, hearing impaired travelers can be alerted to the presence of quiet vehicles such as electric cars. | |
| Real Time Traffic Information | Enables travelers to make real-time routing decisions by providing traffic information and incident detection using probe data derived from GPS-based cell phone traffic monitoring. | |
| Multimodal Real-Time Trip Planning | Provides information that allows travelers to make road and transit travel choices based on current traffic and transit conditions, resulting in multimodal trips that are shorter, quicker, less expensive, safer, and more energy efficient. | |
| Smart Parking Information/Reservations | Provides real-time information on parking availability allowing drivers to park and transfer to transit when confronted with roadway congestion. It can be extended to include parking reservations and payment. | |
| Transit Signal Priority | Communicates to the traffic signal cabinet that an approaching vehicle is eligible for a priority change in the signal, enhancing the speed and schedule dependability of the transit trip as well as the fuel efficiency of the vehicle. |
When combined, communications devices and applications form an integrated, networked environment that can provide users with a greater situational or a full 360-degree awareness of the events, risks, and opportunities within the environment immediately surrounding the vehicle, as well as nearby roadway conditions. Figure 3.16 below illustrates some of the key VII situational awareness concepts in action.
The VII Initiative Approach—Establishing the Original VII Architecture
The first VII architecture was developed using wireless DSRC as the communications technology. In 2004, research done by the Department and key industry stakeholders compared the commercially available technologies. DSRC was identified as the only technology with the required performance features—for instance, high security, low latency (speed of data transmission), reliability and redundancy, and ability to ensure privacy and anonymity—for simultaneously hosting active safety, mobility, and commercial services applications while prioritizing safety.
Important underlying assumptions drove many of the original technical and design requirements:
In October 1999, the Federal Communications Commission (FCC) announced the allocation of 75 megahertz of spectrum for intelligent transportation services with the following statement28:
The FCC decided to use the 5.850-5.925 GHz band for a variety of Dedicated Short Range Communications (DSRC) uses, such as traffic light control, traffic monitoring, travelers' alerts, automatic toll collection, traffic congestion detection, emergency vehicle signal preemption of traffic lights, and electronic inspection of moving trucks through data transmissions with roadside inspection facilities. ... The FCC said providing additional spectrum for ITS services would further the goals of Congress, the Department of Transportation and the ITS industry to improve the efficiency of the U.S. transportation infrastructure and to facilitate the growth of the ITS industry.
- That VII would be one interconnected network.
- That the network would be capable of delivering safety, mobility, and commercial services applications simultaneously. This assumption drove the design for a multichannel radio to ensure that safety messages could always be prioritized.
- That wireless communications would enable cooperative vehicle to- vehicle (V2V) and vehicle-to-infrastructure (V2I) data exchange.
- That VII would utilize the dedicated 5.9 Ghz spectrum allocated by the FCC (see text box).
- That vehicle-based devices would be embedded units connected to the vehicle's computer systems (also known as the vehicle databus) and be able to access data from the vehicle for use in active safety applications.
The VII research program was structured using a systems engineering approach. Partners defined a Concept of Operations and envisioned how the VII system would be used when implemented. "Use cases" were developed that defined how State and local transportation agencies might employ VII to address transportation-system problems and management: for instance, some of the public sector use cases envision how to use VII for signal timing optimization or traveler information (including integration with Clarus data to deliver road-specific weather advisories). Industry also defined a set of commercial services use cases, many of which require a transaction such as paying a toll or reserving and paying for a parking space.
The use cases formed the basis for the development of the original VII architecture, standards, technologies, and applications. In 2007, the VII partners began installation and integration of the component systems into a set of testbeds located in Oakland County, Michigan and Palo Alto, California. These testbeds offer the Nation the first working prototypes of a VII system. They use the original VII architecture as their blueprint; they exist to conduct engineering tests on the component systems and POC tests for system performance evaluation. Vehicle manufacturers also integrated VII component systems into a test vehicle fleet.
In March 2008, POC tests were launched; tests were completed in September 2008. The results are being analyzed as of the writing of this report. Preliminary results are reported at the end of this section; final results and recommendations will be available in January 2009. The following two pages present descriptions of key elements in the original VII efforts. The first page presents the challenges of establishing VII system security while ensuring the anonymity of all users. The second page contains a description of the Michigan and California testbeds and highlights of the design of the POC tests.
VII System Security
For VII to be widely adopted by the Nation, drivers and other users need to be confident that the advisories, alerts, and warnings presented to them are "real" and can be trusted. The VII Initiative has leveraged a wellestablished approach to security known as public key infrastructure (PKI). PKI is used for systems that must ensure security in protecting sensitive communications and transactions. Using PKI, five core objectives are being met through the VII system security design:
PRIVACY: Privacy is addressed in two ways in the VII security system. First, fundamental to the system operation is the assurance of anonymity and confidentiality. While service providers outside the system may need to know the identity of a specific user (for billing, for instance), the VII system itself does not need to know this information. The system has been specifically designed to avoid requiring any form of traceable or persistent identification of any users. Second, when identifying information is passed through the system to trusted service providers, the system provides mechanisms to encrypt the information so that none of the system elements or operators can access it. These encryption schemes are also used to suppress the opportunity for observers to correlate operational information such as vehicle speed with physical observation, so the system also protects against misuse by external attackers.
AUTHENTICITY: In any system it is desirable to require users to prove their authorization to access and use the system's resources. With the VII system, however, the authentication process is a unique challenge as the process must be accomplished without violating the user's privacy. The VII solution is to issue certifications using a well-known asymmetric cryptography system that uses pairs of "public and private keys" to encrypt and decrypt information. The keys are mathematically designed so that each key will decrypt what the other key encrypts. These pairs are typically separated into a public key (made generally available) and a private key (kept secret). In many cases the communicating parties do not have an established trusted relationship. As a result, the parties need to send their public keys to each other. To ensure the authenticity of these keys, they are digitally signed using the key of a well-known certificate authority that both parties know and trust. This approach allows users to be assured that information provided by the system is legitimate and it allows the system to prevent access by unauthorized users.
ROBUSTNESS: It is inevitable that the system will be attacked. These attacks may be full-scale, sophisticated attempts to disrupt the system, or they may be small-scale pranks. In any case, the system must make it very difficult to mount an attack; it must be capable of identifying and terminating a severe attack in progress, and it must provide a means for rapid recovery of full capability following any actions to terminate the attack.
SCALABILITY: Since the deployed system will include hundreds of millions of vehicles, the security solutions used for VII must be scalable to these large volumes without incurring excessive costs or any degradation of performance.
LIFECYCLE MANAGEMENT: The system must be manageable for the life of a vehicle without imposing any special or unusual service requirements over a vehicle's life span. Security updates and re-authorizations should occur transparently to ordinary users, or at worst should occur concurrently with other service and maintenance activities.
The certificates for VII Vehicle Security are defined in the IEEE 1609.2 standard. More information on the VII system security can be found within the VII document library at:
www.vehicle-infrastructure.org/library/program-documents/.
VII Proof-of-Concept Testing
The VII POC tests were designed to demonstrate the technical viability of the original VII approach. The focus of the tests was largely to confirm the capability of the VII network to provide end-to-end, interoperable communications; to simultaneously support safety, mobility, and commercial applications; and to prioritize safety at all times. The tests were limited-scale tests. They did not test the functionality of the system under heavy vehicle loads or the ability of an average drivers to use or benefit from the applications. Application "stubs," rather than fully developed applications, were used to test functionality.
Testing was performed in a laboratory and controlled test track e prior to open-road testing with professional drivers in Novi, Michigan and Palo Alto, California. The Michigan site, where the majority of testing was performed, includes 75 lane-miles of arterials and freeways with 56 DSRC roadside units installed in a network. The California site includes 60-lane miles of arterials and freeways with 12 DSRC roadside units. Collectively, the VII test fleet included 35 vehicles from six different manufactures, ten of which are owned and used by the vehicle manufacturers for testing proprietary applications.
The tests focused on:
- Delivering end-to-end communications capabilities utilizing vehicle OBE and interfaces, wireless vehicle-to-vehicle and vehicle-to-roadside links, and backhaul services.
- Understanding the capabilities of the 5.9 GHz DSRC communications using draft DSRC standards and establishing baseline performance data in a real-world environment.
- Verifying that the system architecture can reliably support and deliver intended safety services and functionality.
- Testing system management capabilities, such as the ability to remotely update software on the RSE or to remotely update vehicle security credentials.
- Testing the overall privacy and security of the VII architecture, simultaneously providing anonymity and authentication.
- Assessing the performance of wireless backhaul communications using T1, 3G cellular, and WiMax. Backhaul communications are used to transmit data from roadside equipment to a centralized TMC.
The POC tests identified areas for additional research including adjustments to the standards, the balance between privacy and security in an open-architecture environment, and the accuracy of differential GPS systems needed for certain applications. While the POC is an important milestone in the VII program, providing confidence among the VII partners that the concept is valid and warrants further investment, it is only the first of many testing activities anticipated.
The VII Initiative Approach: Establishing Vehicle-to-Vehicle Communications
Throughout the development of the original VII architecture, VII stakeholders that were focused on hard safety applications were able to identify how DSRC and positioning technologies might overcome some of the inherent limitations in the use of autonomous technologies to address crashes. In 2006, the VII Initiative team and stakeholders established a focused V2V effort, known as the Vehicle Safety Communications-Applications (VSCA) project. The VSCA partnership includes five vehicle manufacturers that chose to participate in the V2V research: Ford, General Motors, Honda, Mercedes-Benz, and Toyota. To develop a robust and secure vehicle-to-vehicle capability, the VSCA partners established the following program activities:
- Assess how previously identified crash imminent-safety scenarios in autonomous systems could be addressed and improved through the use of DSRC and positioning technologies.
- Define a set of vehicle-safety applications and specifications including minimum system performance requirements. Using the NHTSA typology, six applications (see text box) were selected because:
- In combination, they address the top five national scenarios for crash frequency, crash cost, and functional years lost. In this respect, these applications focus the V2V efforts on the most frequent crash types.
- Each is capable of being addressed by a combination of wireless V2V communications and positioning technology.
- Develop an analysis of benefits versus market penetration and potential deployment models (that is, understanding the percentage of V2V-equipped vehicles that needs to be operating on the roadway to realize the expected benefit of preventing crashes). This work is being led by NHTSA and the RITA/Volpe National Transportation Systems Center.
- Develop the scalable, common architecture; protocols; and messaging framework necessary to achieve interoperability and cohesiveness among different vehicle manufacturers. Work with standards organizations to standardize the messaging framework and protocols (including message sets) to facilitate future development. Because the development of the original VII architecture used the systems engineering process, the V2V partners leveraged the existing VII Concept of Operations, architecture, and standards and modified them for a V2V environment.
- Develop accurate and affordable vehicle positioning technology.
- Develop and verify a set of objective test procedures.
Vehicle-to-Vehicle "Heartbeat" Communications
The "heartbeat" message is a signal that emanates from the vehicle ten times per second to inform other vehicles in the vicinity, effectively saying "here I am." The same message carries data at such a speed and position that enhances situational awareness. Some examples include:
- Lane change warning. By keeping track of the trajectory of nearby vehicles via their heartbeat message, the vehicle can determine the location of other vehicles in adjacent lanes; when the driver signals to change lanes. If the vehicle moves too close, the driver could be alerted.
- Active congestion management. The heartbeat signal can be used to actively measure the number of cars in a specific lane and transmit information to the infrastructure to dynamically adjust the signal timing to minimize delays or optimize flow.
- Intersection collision avoidance. The vehicle can determine the trajectory of vehicles approaching an intersection and determine if there is a risk of collision because of, for example, insufficient left turn gap or vehicle on collision course. It can then alert the driver of the impending dangerous situation.
- Collision mitigation. If a crash is imminent, the heartbeat messages can provide key information about vehicle weights, dimensions, and other physical parameters that can allow the safety systems to optimize their response, thereby protecting the occupants.
Since December of 2006, through focused efforts and experiments, significant progress has been made in establishing the V2V capability:
- As positioning is a critical component of V2V communications, the VSCA project includes experiments to develop accurate and affordable vehicle positioning technology that can support time-critical safety applications. Experiments conducted in 2008 evaluated the capability of GPS alone and GPS with a forward-looking camera to augment relative vehicle positioning and aid the GPS in more accurately identifying the position of other vehicles in the same or an adjacent lane.
- Because the VSCA activities are scheduled on a tight three-year deliverable timeline, two successive levels of development and testing have been defined, Level 1 and Level 2. Level 1 addresses initial implementation of the safety, communications, and positioning components to understand their capabilities. For positioning, a variety of technologies will be implemented to compare multiple design alternatives and conduct an analysis of trade offs between cost and effectiveness:
Six V2V Applications
- Emergency Electronic Brake Light (EEBL)
- Forward Collision Warning (FCW)
- Intersection Movement Assist (IMA)
- Blind Spot Warning + Lane Change Warning (BSW + LCW)
- Do Not Pass Warning (DNPW)
- Control Loss Warning (CLW)
-
- Level 1 testing will include a set of engineering tests on urban roads and rural highways using 17 different test scenarios (see text box below) to understand system performance regarding:
- Data transmission and errors that could occur because of problems with:
- A vehicle's line of sight to another equipped vehicle due to buildings limiting it;
- Vehicle shadowing, when an unequipped vehicle gets in-between equipped vehicles;
- Complex intersections with many equipped vehicles;
- GPS outages; and
- Level of power required for the hardware and software.
- The performance of the standard; results and suggested modifications will be delivered to the standards working groups.
- Data transmission and errors that could occur because of problems with:
- Level 2 development and testing will build on recommendations from Level 1 test results regarding the need to further modify the technologies and standards. Level 2 development will also address system security and user certification. These tests will include full integration of all of the safety applications within the test vehicle fleet. The testing will be based on a set of objective test procedures that will result in the ability to estimate safety benefits and establish the minimum requirements for how the system and applications should work when implemented under real-world conditions. Level 2 testing is expected to be complete in Fall 2009.
- Level 1 testing will include a set of engineering tests on urban roads and rural highways using 17 different test scenarios (see text box below) to understand system performance regarding:
| Level 1 Tests
Level 1 tests are engineering tests that explore V2V capability to date under these 17 scenarios: |
|
|---|---|
|
|
VII Initiative Accomplishments
Development of the first VII architecture and a Concept of Operations.
The VII architecture is the basis for the first VII environment established in the United States. The architecture lays out the key logical components of the VII system, including mobile OBEs and stationary RSE in the infrastructure. High-level functional requirements are also defined and allocated among these components. The architecture provides the information flow among these components, from the OBEs in vehicles over the wireless DSRC link to RSEs, and upstream from there to message switches—which later evolved into service delivery nodes—and on to end users and end user applications. Support functions such as security, network management, and mapping are also defined.
In addition, the architecture describes the first State and local government use case scenarios, or the vision for how agencies might apply VII. They identify a set of safety, mobility, and commercial applications for industry development and set technical requirements for the first VII network capability. Use cases establish the basic requirements for the variety of safety and mobility applications associated with VII. Between 2004 and 2006, well over 100 use cases were identified by industry. The VII Initiative focused on 20 that were considered high priority for public sector safety, mobility, and commercial applications, and tested the architecture's ability to support them within the POC.
Development of DSRC standards that enable system interoperability and facilitate integration.
The DSRC standards and technologies were designed to meet very strenuous requirements for active safety systems—applications and systems with a requirement for rapid communications and low latency (the messages are transmitted without significant delay)—to prevent or lessen the impact of a crash with vehicles traveling at high speeds. DSRC requirements include:
- Very low network access times;
- Low latency (delay of well under 100 milliseconds per second);
- Rapid message delivery (data exchange of over 6 megabytes per second);
- High reliability and availability;
- High security and privacy protection; and
- Limited range (less than 1,000 meters) to allow spectrum reuse and to limit interference.
DSRC was also designed using high-volume (low cost) technology.
Development of the first multi-channel radios.
The VII Initiative invested in the development of vehicle-based OBEs and infrastructure-based RSEs that are used in the process of data gathering, transmission, and broadcast. To support multiple applications but prioritize safety, the DSRC radios were designed as multi-channel.
Development of software that provides a novel approach to large-scale network security and ensures privacy and anonymity.
Security is based on authenticating users of the system and issuing security certificates that allow for system use. The process designed for VII is an innovative design that ensures the anonymity of users.
Establishment of a VII prototype network in a real-world environment.
The primary testbed is the Development Test Environment (DTE) in Oakland County, Michigan. It was established in cooperation with automotive industry partners, the Michigan DOT, and the Road Commission of Oakland County. A second testbed site is located in Palo Alto, California as part of the California VII Initiative. In March 2008, POC testing began. It will be competed in September 2008 with analysis of results continuing through late Fall 2008. Final presentation of the results is expected in January 2009.
Establishment of a working partnership with a wide group of stakeholders.
Participants include the vehicle manufacturers, State and local DOTs, the Alliance of Automobile Manufacturers, AASHTO, the Association of International Automobile Manufacturers, the Institute of Transportation Engineers, the Intelligent Transportation Society of America, and the International Bridge, Tunnel and Turnpike Association, and others. Information on working partners can be found at: www.vehicle-infrastructure.org/coalition/.
Development of a V2V capability.
Vehicle-to-vehicle "heartbeat" communications were registered during research and during the POC tests.
Development and demonstration of six safety applications based on the SAE J2735 V2V message set.
Working cooperatively with NHTSA and five vehicle manufacturers (Ford, GM, Honda, Mercedes-Benz, and Toyota), seven interoperable V2V applications have been developed and successfully demonstrated hard safety capabilities. The seven applications include EEBL, FCW, DNPW, CLW, IMA, LCA, and BSW. Prototyping these safety applications required the development of a system concept of operations, hardware and software requirements, minimum performance specifications, a scalable architecture that can support a large number of vehicles, and advanced techniques to achieve relative positioning between vehicles with automotive grade (inexpensive and affordable) GPS receivers.
Modification of the VII architecture and standards for a V2V environment.
V2V employs the same DSRC standards as the original VII architecture, using the IEEE 1609 standards for security, the IEEE 802.11p standards for wireless local area networks, and the SAE J2735 standards for DSRC messaging.
Development and evaluation of techniques to achieve relative lane-level vehicle positioning with GPS receivers.
A preliminary analysis conducted under the VSCA effort studied the GPS capability to clearly identify the position of other vehicles in the same or adjacent lane using "automotive grade" GPS receivers alone and in combination with a camera. Research is ongoing, as the addition of the camera presents important issues including the cost of the system and the viable size of a camera for vehicle installation.
Establishment of V2V capability testing through 17 test scenarios in urban and rural environments.
Level I testing began in July 2008 and will be complete in late Fall 2008.
Development of privacy principles.
The VII privacy principles are based on consensus agreement with a wide range of stakeholders including privacy advocacy representatives. Successful VII adoption will depend in part both on technical design and the operation of a VII system that respects the reasonable privacy expectations of individual VII users. Because the VII Initiative sought to ensure the anonymity of VII system users, privacy requirements drove system design, security, and usecase requirements. The privacy principles can be found at: www.vehicle-infrastructure.org/library/program-documents/institutional/privacy-policy.pdf.
Technology transfer and establishment of VII at the State and local levels.
In anticipation of the gains in safety, a number of State and local transportation agencies are implementing VII and conducting concept testing. Implementation sites are located in Arizona, California, Florida, Michigan, Minnesota, New York, and Virginia. The Department is tracking the efforts by the States and facilitating knowledge-sharing through peer exchanges, technology transfer, and stakeholder meetings. More information can be found at: www.vehicle-infrastructure.org/tests-demonstrations/us-vii-related-activities.php.
State transportation representatives have also participated in architecture and design reviews and have engaged in discussions regarding local implementation issues. In addition to the safety benefits, States are interested in the VII concept for its ability to collect probe data. This has the potential to perform functions similar to existing infrastructure—such as loop detectors or roadside variable message signs—while providing significantly richer data. VII thereby has the potential to reduce the financial burden of maintaining, repairing, and replacing this infrastructure.
VII Research Results and Important Findings
VII tests are providing valuable insight as to how the VII network concept operates and performs in a real-world setting. The first VII architecture using DSRC technologies (RSEs and OBEs) met performance standards and exhibited the capability to simultaneously deliver active safety, mobility, and commercial services applications while prioritizing safety. The VII architecture demonstrated the first networked transportation environment, including vehicle-to-infrastructure communications capability and a preliminary V2V capability. Results and findings from the tests are summarized below.
The VII network concept works.
- The system architecture was successfully implemented as a fully functioning prototype system.
- The architecture supports fully interoperable two-way end-to-end communications between traveling vehicles and the infrastructure.
- Multi-RSE transactions are possible: a vehicle leaving the range of one RSE is able to resume a transaction when it enters the range of another RSE. This is a critical demonstration of capability, as the large number of safety, mobility, and commercial services transactions that a driver has in process at any one time may not be fully completed by exchange at only one RSE. The ability to resume a transaction is an important innovation.
- The VII network can keep transmission of messages local, thereby ensuring that system bandwidth is used efficiently.
- RSEs and other network equipment can be remotely configured and monitored and software updates can be easily uploaded, enabling practical system maintenance from remote operations centers.
- VII is compatible with and will be able to accommodate the next generation of Internet protocols (e.g., IPv6) that will be widely implemented over the next few years.
- DSRC communications performed well.
- The DSRC protocols can prioritize radio channel access for safety while also supporting other applications. Safety applications were proven to always be given higher priority in testing.
- DSRC range is better than expected (up to 800 meters) and was found generally acceptable under all environmental conditions. DSRC communications were demonstrated to work in congested traffic, hilly terrain, and urban canyon environments. Tests indicate, however, that issues such as shadowing or multi-path interference can have unpredictable effects on communications ranges.
- The POC also revealed an unexpected performance feature of the OBE receivers: they can "hear" RSEs from a long distance, requiring that the OBE arbitrate between messages from a distant RSE versus a nearby RSE. The standards were based on a vision of RSEs being greater distances apart. However, due to the urban setting of the POC and the longer-than-expected range of DSRC, the tests revealed this as an issue with the standards and the need to improve the ability of OBEs to handle multiple competing services.
- Commercial wireless local area network products, based on the industry standard of 802.11, are easily adaptable to DSRC. These products typically include WiFi chip sets used in many commercial devices.
The VII system provides the capability for vehicles to "talk" with each other in an interoperable, rapid, and secure manner.
- In the VII POC tests, cars from multiple manufacturers exchanged data using DSRC communications with 99 percent reliability up to 75 meters and over 90 percent reliability up to 100 meters.
- Data transmission speeds of over 6 megabytes per second and latencies well under 100 milliseconds were sufficient to support timely warnings and alert drivers to imminent hazards.
- V2V "heartbeat" messages containing vehicle status information were sent between vehicles under a wide variety of road conditions. Message reception for vehicles approaching each other at road speed was greater than 99 percent at a range of 75 meters or less.
The VII network can support safety and mobility applications and commercial services.
- VII technologies are capable of generating and distributing quality "probe data". Embedded DSRC technologies are capable of connecting with the vehicle databus to access data describing a vehicle's direction, speed, and position, among other parameters, as well as the location of key events such as hard braking, turning on rain wipers, or when vehicle traction control is applied due to icy conditions, for instance. For example, probe data can be collected from moving vehicles as they pass roadside equipment at full speed and can be delivered to subscribers according to their specified data needs. The POC tests generated over 10,000 data points of vehicle status and events during testing.
- The VII infrastructure technologies support robust transmission of signal phase and timing and intersection maps within 100 meters.
- The system can support a variety of commercial services that require secure, individual, two-way communications at high speeds, including payment and invoicing. For example, toll collection, including payment transactions, was demonstrated at highway speeds.
- Low-cost commercially available GPS devices used for navigation are not capable of meeting the requirement for lane-level accuracy in some geographic configurations. This precludes knowing vehicle position accurately enough for some safety applications such as lane-departure or lane-change warnings. More accurate GPS devices are available today but are more expensive. The V2V approach is leading further research into this area and seeking solutions for passive/cooperative positioning and urban canyon positioning.
The POC results revealed that the VII system is robust against intrusions and attacks.
- The POC demonstrated that the communications security system can prevent hackers from introducing fake messages into the system, thereby providing assurances that any messages received are legitimate.
The POC tests successfully demonstrated that the VII system supports basic services that are the first steps in preserving personal security, system integrity, and anonymity.
- Authentication can occur without identifying the sender or tracking a driver moving through the network.
- Over-the-air security credential management using public key infrastructure (PKI) has successfully demonstrated the ability to remotely issue and revoke security certificates while the vehicle is in motion. Revocation of up to 5,000 certificates was demonstrated in a single pass at an RSE at 65 miles per hour.
The V2V standards modifications efforts have resulted in an important new data capability for DSRC standards.
- A "breadcrumb" concept was developed as part of the SAE DSRC message sets. The breadcrumb concept borrows from internet navigation practices. With the V2V communications, the breadcrumb messages identify the last ten seconds of location points based on the vehicle's GPS data. Having this type of data passed from one vehicle to another helps vehicles know how to react to one another. For example, a vehicle approaching another vehicle stopped at an intersection will receive data on how long the vehicle ahead has been stopped or whether it recently changed lanes to avoid an object or pedestrian. Or, during night conditions or low visibility, the vehicle ahead could transmit to a following vehicle that it just entered a curve. The changes to all of these standards will be tested as part of the V2V validation testing to ensure that the modified standards work under real-world V2V conditions.
The combination of DSRC and GPS might not provide enough accuracy for hard safety applications and may require additional technologies such as cameras.
- A comparative analysis of GPS alone and GPS with a camera revealed that GPS has limitations when used to determine the position of other vehicles in or near the lane.
- Using a combined GPS and camera system increased the ability to provide a more exact positioning through the ability to identify the lane edges and nearby vehicles. The addition of the camera provided other benefits as well:
- The capability to confirm the entering and exiting points of a curved road;
- Assistance to the driver in the early detection of lane departure; and
- The ability to "coast" during temporary GPS outages and be able to maintain surrounding vehicles' relative position information.
Evolving to Meet a Changing Environment
Throughout the course of VII research and development, important changes in technologies and their uses have enabled an expansion of the VII concept. Since 2004, the market has created a revolution in consumer electronics— the availability and use of highly mobile, dynamic communications has enabled a society on the move, with information as close as the click of a button using:
- Mobile devices that are now equipped with more computing and GPS capabilities and a greater ability to host a wider array of applications.
- Commercially available wireless communications. Near-ubiquitous wireless coverage now exists across the Nation and continues to evolve to include faster, more secure, higher-quality capabilities.
The text box below highlights some of the more significant market evolutionary shifts that have occurred since 2004.
Rapid Evolution of Technology
In 2004, as the Department was developing its major research initiatives, approximately 4 million Apple iPods were sold. The market for GPS navigational devices (known as personal navigation devices, or PNDs) in the United States numbered approximately one-half million devices. In as little as three years, consumer demand has driven dramatic marketplace growth and today, those numbers are vastly different:
- In 2007 alone, 33.9 million navigational units were sold, providing 10 percent of all U.S. drivers with GPS-based route information; 69 percent of all new vehicle models include navigational devices.
- There are now 150 million iPods worldwide.
- Mobile technology manufacturers and mobile service companies are converging. Companies such as cellular providers, map database firms, and PND manufacturers are merging to be able to meet consumer needs for information in a single device. In 2008, the newest entrant, traffic services companies, will likely merge with or serve these new technology companies to provide traffic information.
- Wireless communications capabilities have evolved rapidly since their introduction in the 1980s. The first generation of wireless, known as 1G communications, is transmitted in analog format. The second generation, or 2G, introduced digital transmission in the early 1990s. 3G is employed today and "...offers users a wider range of advanced services ... including wide-area wireless voice telephony, video calls, and broadband wireless data, all in a mobile environment." 4G will deliver IP environment capabilities and is projected to be available in 2012.29
In 2007, the Department recognized that these changes in the environment warranted a fresh look at the VII program. The outcome was the establishment of SafeTrip-21, an initiative that creates an opportunity for the VII Initiative to explore whether some of the VII capabilities can be delivered faster, less expensively, and in the near term. SafeTrip-21 seeks to harness the power of consumer electronic innovations for transportation. Under SafeTrip-21, travelers with mobile devices can become an active part of the transportation network by simply choosing to connect. Devices will generate anonymous, real-time data to update the transportation system and also provide travelers with current information on the safety of roadway conditions, congestion, and alternative travel options. SafeTrip-21 will demonstrate:
- The ability of a range of new mobile technologies to be integrated with existing ITS technologies and transportation system operations and their ability to deliver safety, mobility and environmental benefits.
- The ability of cellular and WiFi to create a viable VII network. DSRC is also being assessed as part of SafeTrip-21; the evaluation will offer a greater understanding of the opportunities and limitations.
- The capability of mobile devices to act as traffic probes to improve existing traffic and planning models and tools in terms of pinpointing recurring safety problems as well as recurring congestion.
SafeTrip-21 leverages commercially available wireless (cellular and WiFi); mobile or "carry-in" devices will be used to establish V2I and V2V capability to assist travelers in receiving the most current information on:
- The safety of roadway conditions (e.g., work and school zone advisories, alerts on slowed or stopped traffic, excessive speed warnings).
- Alternative travel options for their route (e.g., less congested routes or greener travel choices).
- Real-time information on traffic congestion, parking availability, and transit service.
SafeTrip-21 Testbed: Enabling the Connected Traveler
In May 2008, the U.S. Department of Transportation awarded the first SafeTrip-21 test site to a partnership of state and local agencies, industry, and academia. Located in the San Francisco Bay area, the site is known as the Enabling the Connected Traveler testbed. It will host a set of integrated applications focused specifically on the delivery of dynamic safety and mobility advisories to travelers on-the-go.
The California SafeTrip-21 testbed is a partnership of Federal, State, and local governments and agencies, the private sector, and academia. As the lead partner, Caltrans has assembled a $12 million testbed with safety and mobility applications. Collectively, these applications seek to improve travelers' situational awareness and thus enhance their safety and mobility. The initial capabilities that are included in SafeTrip-21 will include:
- Traffic data from GPS-enabled mobile phones.
- multimodal trip planning based on real-time conditions and personal routing objectives (i.e., the shortest, quickest, most predictable time-wise fuel economy, and environmental footprint).
- Dynamic roadway, transit, and parking status information.
- Transit signal priority.
- Innovative electronic payment for bridge tools, transit fare, and high-occupancy or toll lanes.
Specific to safety, the California SafeTrip-21 testbed will evaluate the following applications for their ability to enhance a driver's awareness of the threats and hazards within the roadway environment:
- Dynamic signage for active road work or school zones.
- Dynamic alerts regarding slow/stopped traffic; crashes; and/or excessive vehicle speed entering a curve.
- Pedestrian and bicycle alerts for transit bus drivers and Quiet Vehicle Alerts for hearing impaired travelers.
In November 2008, the Department awarded a second test site in partnership with the I-95 Corridor Coalition. This partnership will test new services in the New York, Philadelphia, Baltimore, and Washington, D.C. metro areas.
SafeTrip-21 will help the Coalition continue testing vehicle probes to provide travel time information along the East Coast. This information will be used to test, evaluate, and deploy a wide range of traffic management, traveler information, and performance measurement applications to demonstrate mobility benefits.
The Virginia Department of Transportation will deploy updated travel information at two Welcome Centers along I-95 and at Tyson's Corner Mall to help travelers avoid congested work-zones. Travelers to BWI Airport in Baltimore will be provided real-time information on traffic delays via mobile devices. The North Carolina Department of Transportation will be able to better monitor travel through work-zones so it can advise approaching motorists of delays and speeds to achieve safer and more efficient operations.
Migration to an Open-Platform Framework
Through the process of evolving the VII Initiative, there has been a growing recognition of the need to migrate the original VII architecture capabilities into an open platform. The definition of an open platform is provided in the textbox below. Such a framework has multiple benefits: it will enable industry to take advantage of emerging technologies; it will allow for integration of a wider array of technologies; it will allow the VII architecture to adapt as technologies evolve, ensuring that the VII network incorporates innovative approaches and applications over time; and it will ensure that VII benefits are not limited to drivers of VII-equipped vehicles since this would limit how and when significant safety and mobility benefits can be realized.
The Open-Platform Vision for VII
In typical usage, an "open platform" is one that allows third parties to add new hardware or software components that plug into or interoperate with the platform and possibly even replace some components with new ones having similar functionality and conform to common interface standards. This openness is made possible through the use of thorough and detailed interface specifications. The PC platform (a system running the Windows operating system on a modern x86 compatible processor) is an example of an open platform. Thousands of third party suppliers build and sell hardware and software components for this platform. The World Wide Web provides a similar example: standards such as TCP/IP and HTML have enabled millions of new applications to be developed that "plug into" the internet.
The interface standards for an open platform may be proprietary standards developed and controlled by a single vendor or they may be open standards approved and maintained by a standards development organization or industry consortium such as IEEE's standards for WiFi or the World Wide Web Consortium's HTML and XML standards. The VII open-platform vision calls for open interface standards.
The collective results of the original VII, V2V, and SafeTrip-21 efforts will inform the understanding of what is required from an open-platform framework and will establish an initial foundation. Migration to an open platform is not without challenges. For instance, while the open platform concept can be easily defined when one is dealing with a simple system, such as PC hardware, it becomes more complex when dealing with a system of systems such as VII.30 Furthermore, many of the safety and mobility applications developed for VII require not just openness but interoperability between systems and, most importantly, among the different vehicle manufacturers and models without compromising competition and proprietary features. As of the writing of this report, new partnerships are forming, resulting in the move to an open-platform framework and to the initial steps to test the mobile device communications concept. Key efforts include:
- The definition of an open-platform VII framework. A workshop was held in August 2008 to bring together device manufacturers, the automotive industry, key sectors of the transportation industry, and transportation agencies to define the open platform concept. The agenda and discussion questions can be found at:
www.its.dot.gov/vii/vii_roundtable.htm. - Research to identify and assess emerging communications technologies. New technologies under investigation in the near term include WiMax, MANETs, VANETs, nanotechnology, and the next advance in cellular communications, 4G. A workshop was held in May 2008 to explore the opportunities and limitations that new communications technologies offer in support of transportation safety applications. Proceedings can be found at:
www.vehicle-infrastructure.org/library/program-documents/.
Next Steps and Activities
Going forward, the VII Initiative has identified a focused research and investment agenda in the areas described below. Research will be structured to support development of capabilities that can be applied in the near (less than three years), medium (three to five years) and long terms (more than five years). Central to the program and key to enabling the industry to leverage future technology advancements is an investment in an open-platform VII framework that will support multiple technology options, including proprietary and open system solutions that meet safety goals.
- Technology scanning and research. Technology scanning and research will identify a wide range of potential technology solutions. Ongoing scanning of developments in the public, private, and academic sectors, both nationally and internationally, will be conducted to ensure that a wide range of technologies are fully considered for use in support of safety applications; trends will be monitored to stay abreast of breakthrough capabilities in evolving technologies.
- Safety applications research. Safety systems may be based on multiple underlying technical capabilities. Research, demonstration, and evaluation activities will focus on the effectiveness of new safety applications for crash reduction, human factors implications, and viable approaches that ensure security and scalability of potential solutions. Over time, this research may evolve to accommodate new capabilities associated with more vehicle intervention and automation. This research will also continue the coordination with the automotive industry and its suppliers and will expand to include relationships with stakeholders in the aftermarket and carry-in consumer electronics markets.
- Testbed(s). Field and laboratory test facilities assist in gaining understanding of how technologies and systems perform under real-world conditions. The Department will work with industry to define testbed requirements and will evaluate sites around the country to determine their capability to meet (or be adapted to meet) requirements. The outcome will be an effective mix of testbed capability and geographic locations that can provide a full range of testing in the near- through long-term future. Testbeds will be required to support an open architecture while accommodating closed-system testing by companies. In establishing testbeds, the Department will seek optimal leverage with the private sector to minimize Federal support, particularly for ongoing operations.
- Architecture and standards. Standards and an open architecture are key elements in establishing a robust, open environment that can support a wide range of technologies. Near-term research will focus on migrating the existing VII architecture to an interoperable platform. A minimum set of data and interface standards that enable interoperability will be identified and will include an assessment of DSRC and other standards for their applicability. Over time, the VII architecture will be monitored and revised to ensure that it continues to meet industry needs and support evolving technologies.
- Non-Technical Issues. While much can be accomplished through technical research, institutional issues have the potential to thwart implementation. Near-term research will focus on a range of critical issues including ways to speed up the deployment of safety capabilities (including assessment of the viability of retrofit and aftermarket options), governance and certificate management, liability, privacy, regulation (if necessary), and outreach and stakeholder engagement.
- Mobility and environmental benefits. Improvements in safety have ancillary benefits for mobility and the environment. When crashes are substantially reduced, non-recurring congestion and the associated fuel consumption and air quality impacts are lessened. Additionally, proliferation of wireless capabilities will provide new sources for mobility data regardless of the technology used. Research is anticipated to help the transportation industry make use of safety technology advantages for ancillary mobility and environmental benefits.
In late Fall 2008, the ITS Joint Program Office launched an effort to "rebrand" the VII Initiative to better represent the program's goal of achieving a safer and smarter transportation system. This effort was driven by the growing recognition that the name "vehicle-infrastructure integration" did not convey the benefits made possible through a wireless networked driving environment. The end result is the new name, IntelliDriveSM, which more effectively conveys the full potential of a wireless networked driving environment to enhance the safety, mobility, and convenience of everyday transportation.
In 2009, the logo (illustrated to the left) will be applied to print materials and websites to help spread the word about IntelliDriveSM. Though its name has changed, the IntelliDriveSM program's focus remains: to develop a networked environment supporting very high speed transactions among vehicles (V2V), and between vehicles and infrastructure components (V2I) or hand held devices (V2D) to enable numerous safety and mobility applications.
3.2.2 Cooperative Intersection Collision Avoidance Systems Initiative
The Transportation Problem
There are 2.6 million intersection crashes every year in the U.S. This is nearly 45 percent of all crashes and 25 percent of all traffic fatalities. In 2003 alone, 9,510 people died and almost 1.4 million were injured in intersection crashes. Predominant factors behind intersection collisions include:
- Violations of traffic signals and stop signs because of inattentiveness, improper signage, poor line of sight, or willful behavior.
- Misjudging the gap when turning into or across traffic (for instance, when taking a left hand turn across multiple lanes of oncoming traffic or when proceeding straight across a busy, rural highway after a stop on a smaller road).
- Aggressive or impaired driving.
The ITS Opportunity
Cooperative Intersection Collision Avoidance Systems (CICAS) are critical safety applications that directly address some of the predominant causes of intersection crashes. The use of ITS technologies to provide real-time warnings—both in the vehicle and on the infrastructure—can substantially improve driver perception of the intersection situation and the threats and hazards posed by other vehicles and other users (e.g., pedestrians). This awareness, in turn, provides drivers with greater response time, which can create safer and more timely driver action in averting potential crashes.
CICAS combines the following ITS technologies to provide drivers with warnings and alerts:
- Vehicle-based technologies and systems—processors, in-vehicle driver assistance systems, and positioning technologies.
- Infrastructure-based technologies and systems—roadside sensors and processors, intersection maps, and roadside systems that include traffic signal systems, messaging signs, and other infrastructure equipment.
- Communications systems that enable cooperative two-way information exchange.
The CICAS Initiative combines these different technologies to form four innovative and leading-edge safety applications:
- CICAS-Violation Warning System (CICAS-V). Using cooperative wireless communications technologies, CICAS-V provides in-vehicle warnings of potential signal or stop sign violations using vehicle-based calculations and traffic signal input regarding the timing of when the light will change to red.
- CICAS-Stop Sign Assist (CICAS-SSA). Using infrastructure-based sensors, CICAS-SSA provides assistance to drivers making decisions on when to proceed onto or across a high-speed road after making a legal stop at a rural road stop sign. Assistance is provided through an infrastructure-based animated display sign.
- CICAS-Signalized Left-Turn Assist (CICAS-SLTA). Using a combination of cooperative systems (building from CICAS-V) and infrastructure sensors, CICAS-SLTA provides assistance to drivers who must judge the timing of a left turn across oncoming traffic, and who may be prevented from completing the turn by pedestrians or other obstacles within the turning path.
- CICAS-Traffic Signal Adaptation (CICAS-TSA). Using a combination of the CICAS-SLTA infrastructure sensing features with the vehicle-based features of CICAS-V, CICAS-TSA is a system that is capable of identifying when a vehicle might run a red light and create a threat to other vehicles. The system triggers an extension of the all-red clearance time of the traffic signal to actively protect drivers from the crash threat.
CICAS Initiative Approach
In partnership with the automotive industry, State and local transportation agencies, academia, and the transportation equipment industry, the CICAS Initiative is researching and developing four intersection collision avoidance systems. All four systems include common development activities: the development of a Concept of Operations and technical requirements; management of the systems development process; evaluation of system effectiveness; and facilitation of the technology transfer to industry and the market. CICAS is, additionally, one of the major VII safety applications and leverages the VII DSRC technologies. CICAS institutional research and testing are being closely coordinated with the VII Initiative.
Accomplishments to Date
- Building from IVI research, the National Highway Traffic Safety Administration (NHTSA) has performed a detailed analysis of the intersection crash problem. From this research, the CICAS Initiative identified five crossing path intersection crash types that could be addressed through the three CICAS systems. The research, along with related reports, is located at:
www.nrd.nhtsa.dot.gov/departments/nrd-12/pubs_rev.html. - CICAS-V: A CICAS-V Concept of Operations and working prototype have been developed. As of Summer 2008, engineering testing is underway in California, Michigan, and Virginia to assess system performance and readiness. Pilot testing has taken place to understand how the system works in a real-world environment. Testing will be completed in Fall 2008 and analysis of the results will be available in January 2009.
- CICAS-SSA: A CICAS-SSA Concept of Operations and working prototype have been developed; included in this research is the analysis needed to develop infrastructure-based CICAS-SSA displays. A fully functional system is currently installed at a test intersection in Minnesota. Validation testing is occurring with instrumented vehicles through October 2008. Results are expected in January 2009.
- CICAS-SLTA: Initial concept research is underway; a preliminary Concept of Operations has been developed and is being refined through further field studies. Comparative experiments have been conducted on driver acceptance of an alert/warning system.
- CICAS-TSA: A CICAS-TSA Concept of Operations is complete and a working prototype has been developed. Initial system testing has taken place on a test track to understand how the system performs.
CICAS Initiative Results to Date
Preliminary results from a pilot demonstration show that the CICAS-Violation System works.
- Using 87 naïve drivers on a test track, CICAS-V tests showed that the system is able to identify an impending violation of both signals and stop signs, and deliver a timely alert to warn the driver.
- The CICAS-V system passed all of the Department's objective tests on test track tests that included multiple scenarios requiring approximately 200 intersection approaches. The results of this pilot testing identified minimal modifications for the prototype CICAS-V.
Research and experimentation reveal that CICAS-Stop Sign Assist can provide a novel approach to reducing rural intersection crashes.
- Analysis of rural intersection crashes revealed that misjudging the gap in traffic to allow for safe turning or passage across oncoming traffic is responsible for approximately two-thirds of all crashes where rural roads intersect high-speed State highways.
- The CICAS-SSA has designed an innovative infrastructure-based animated display (sign) with the appropriate timing to warn drivers about unsafe entry conditions at the intersection. Three types of signs were tested—an Icon sign, a Countdown sign, and a Hazard sign. Test results with drivers using a simulator showed that for decision support, the Icon sign is highly preferred and most easily comprehended by drivers with 67.8 percent of test drivers using the Icon sign to decide when the gap was safe enough to proceed.
- Experiments on the CICAS-SSA sensor suite has resulted in a working intersection prototype that is projected to be less than $200,000, which is less than the cost of a rural signalized intersection. In addition, the CICAS-SSA approach will not stop traffic along the mainline in the way that a signalized intersection would. The final price point may prove cost-effective for State and local governments and the components are off-the-shelf and easily deployable.
CICAS-SLTA and CICAS-TSA research is providing a foundation for technology development.
- Foundational research on left turn behavior (required to advance existing technology capabilities for CICAS-SLTA) has revealed that drivers making left-turn decisions can be influenced to choose a safer (larger) gap using both in-vehicle and infrastructure-based warning displays.
- Using data on red light running systems and driver behavior, CICAS-TSA research has provided a basis for system calculations that can predict and determine "how", "when" and "for how long" to adapt the signal timing. These calculations should enable a CICAS-TSA system to implement an all-red extension as soon as vehicles running a red light pass the last infrastructure sensor. Further, when combined with a CICAS-V vehicle, early testing suggests that the CICAS-TSA should be able to trigger an all-red signal adaptation in the "last-minute" and offer greater protection to all intersection users.
The Problem
Intersection collisions are a significant cause of deaths and injuries in the United States. In 2006, approximately 2.4 million intersection collisions occur, representing 41 percent of all vehicle crashes and approximately 21 percent of all traffic fatalities. In 2006, 8,850 people died and an additional 800,000 suffered injuries due to intersection-related crashes.31 Predominant factors behind intersection collisions include:
- Violations of traffic signals and stop signs because of inattentiveness, improper signage, poor line of sight, or willful behavior.
- Misjudging the size of the gap when turning into or across traffic (for instance, when taking a left hand turn across multiple lanes of oncoming traffic or when proceeding straight across a busy, rural highway after a stop on a smaller road).
- Aggressive or impaired driving.
Intelligent intersection technologies were researched under the Intelligent Vehicle Initiative (IVI) through 2005. The IVI research identified their value in the prevention of crashes and injuries through:
- Warnings and alerts to drivers on threats and hazards within the vehicle and intersection environment.
- Alerts to enhance driver decision-making and reaction.
- Advisories to help drivers safely navigate through an intersection.
The IVI concluded, however, that intelligent intersection technologies required further research and advancement in their ability to identify, process, and respond to hazardous and imminent situations. Additionally, IVI research determined that intelligent intersection technologies are most effective when the sensing and communications features are combined through vehicle-based and infrastructure-based technologies. By working in close coordination, cooperative intersection systems provide a broader, yet more richly detailed, monitoring of the environment surrounding the intersection and identification of hazardous situations.
The Opportunity
The CICAS Initiative brings together different combinations of technologies to form four innovative applications (as illustrated on the next page). All are designed to present information to the driver in real-time to increase situational awareness and help prevent intersection collisions. CICAS systems address crashes that are caused by driver distraction; improper signage; speed; and the misjudging of the safe gap in oncoming traffic when crossing or turning into traffic.
The hypothesis underlying CICAS is that crash avoidance can be achieved through the creation of greater situational awareness of the events within the intersection environment. To create greater situational awareness, data is gathered and processed using the most effective combinations of infrastructure, vehicle, and wireless technologies:
- Vehicle-based technologies and systems—processors, in-vehicle driver assistance systems, and positioning technologies.
- Infrastructure-based technologies and systems—roadside sensors and processors, intersection maps, and roadside systems that include traffic signal systems, messaging signs, and other infrastructure equipment.
- Communications systems that enable cooperative two-way information exchange.
CICAS systems are capable of communicating under two scenarios:
- Between equipped vehicles and the equipped infrastructure.
- Between unequipped vehicles and the equipped infrastructure, thereby providing an enhanced safety to those drivers without equipped vehicles.
CICAS is a critical component of the ITS program's move toward preventing crashes through the development and deployment of active safety systems. Ultimately, all of the CICAS systems will be capable of integration with the VII network and will be able to leverage the rapid and secure communications to further enhance CICAS system capabilities.
CICAS-Violation Warning System (CICAS-V)
CICAS-V is a system that provides drivers with in-vehicle warnings of potential traffic signal or stop sign violations. Using a combination of a Dedicated Short-Range Communications system, a GPS system, and processing capabilities, the CICAS-V calculates the risk that the vehicle will violate the upcoming stop sign or traffic signal. If the risk of violation is high enough, CICAS-V transmits a warning to the driver with enough time to allow the driver to take appropriate action—for example, by applying the brakes or braking at a faster rate.
CICAS-Stop Sign Assist (CICAS-SSA)
CICAS-SSA is an infrastructure-based system designed to help drivers on low-volume roads who, after stopping at a stop sign, wish to cross or turn into traffic on higher-volume, higher-speed roads. The system synthesizes data from roadside sensors, processors, and communications technologies to provide information to drivers via an infrastructure-based message sign that indicates when gaps are unsafe. This sign provides drivers with additional information to help them judge when it is unsafe to enter a rural highway intersection.
CICAS-Signalized Left-Turn Assist (CICAS- SLTA)
CICAS-SLTA is a system that provides information to drivers via vehiclebased or infrastructure-based displays as drivers approach unprotected left turns and need to accept a safe gap in oncoming traffic. CICAS-SLTA can also inform drivers when other users, such as pedestrians, might pose a hazard to completing a safe left turn. The CICAS-SLTA system combines roadside sensors, infrastructure-based messaging signs, communications and positioning technologies, dynamic maps, traffic signal interfaces, and dedicated short-range communications (DSRC). Notably, CICAS-SLTA is able to build from the work completed under CICAS-V to advance positioning technology capabilities that can address complex, multilane traffic environments.
CICAS-Traffic Signal Adaptation (CICAS-TSA)
Research under CICAS-TSA is addressing how technology might actively protect drivers from the crash threat caused by red-light running. The CICAS-TSA combines the infrastructure sensing features of CICAS-SLTA with the violation warning vehicle-based features of CICAS-V. Using data from the vehicle regarding the high probability of the vehicle violating a red light, the CICAS-TSA system acts to extend the red light to allow the intersection to clear itself of all cars, including the violating vehicle. Specifically:
- Vehicles equipped with CICAS-V gather data on vehicle movement to identify the level of probability for a potential red light violation and transmit this data to the infrastructure systems.
- CICAS-SLTA infrastructure-based traffic detectors act in coordination to:
- Provide further data on location and speed of unequipped vehicles.
- Gather real-time traffic signal phase timing status from the signal controller.
- Synthesize vehicle and infrastructure data and trigger a message back to the signal controller to adjust the phasing to an all-red status.
The CICAS Approach
The CICAS Initiative is collaborating with automotive manufacturers and State Departments of Transportation to provide the background research necessary for developing CICAS prototypes. These and other stakeholders are engaged in the conceptualization and development of prototype systems. The CICAS Initiative is focused on addressing five types of crossing-path intersection crashes (see textbox below) through the development, demonstration, and testing of four prototype systems—CICAS-V, CICAS-SSA, CICAS-SLTA, and CICAS-TSA. Key activities are common to each system development effort. The following pages present a section on each of the CICAS systems and summarizes, for each:
- The systems development approach:
- Research to develop a Concept of Operations and technical requirements. Foundational research and experiments conducted to advance the capabilities of technologies available today and to assess the effectiveness of the driver alert and warning components (human factors research).
- Pictures and illustrations of how advanced technologies combine to form each CICAS system.
- The testing approach, including descriptions of:
- Human factors tests with drivers to assess, under controlled and safe conditions, whether the system performs as expected and whether drivers find the alert and warning components acceptable (i.e., Will they use the system? Is it intuitive? Does it provide value?).
- Engineering and pilot tests with prototype systems in real-world conditions to understand the performance of the system and to assess how driver decision-making changes with the use of a CICAS system.
- Results and findings from the research and tests.
- Next activities and final steps.
With the completion of each CICAS system, the ITS Program will facilitate technology transfer to industry to encourage market availability of CICAS systems. Because the CICAS systems are considered key safety applications for VII, institutional research for CICAS is coordinated with the VII Initiative.
CICAS addresses five types of crossing-path intersection crashes, and related factors such as the potential involvement of pedestrians and bicyclists during a crossing-path crash. Other types of crashes, including rear-end, non-crossing-path pedestrian and bicyclist, and single-vehicle crashes, are addressed by other ITS program technologies, such as those developed under the IVBSS Initiative.
CICAS Violation Warning System
CICAS-V Partners
- US DOT/RITA/ITS JPO
- NHTSA
- FHWA
- Michigan DOT
- Road Commission of Oakland County, Michigan
- Virginia DOT
- Caltrans
- General Motors
- Ford Motor Company
- Mercedes-Benz
- Toyota
- Honda
- Virginia Polytechnic Institute and State University
Since 2006, the ITS Program has been working in partnership with the automotive industry, State and local governments, and academia (see list of partners in textbox to the side) to develop and evaluate a prototype cooperative intersection collision avoidance system that reduces the frequency of crashes between vehicles due to violations of traffic signals and of stop signs by warning the driver of an impending violation.
Efforts to develop a CICAS-V system were initiated under the CICAS Initiative based on the following statistics:33
- Intersection crashes account for 27.3% of all police-reported crashes, or 1.72 million crashes annually in the U.S.
- In 2004, stop sign and traffic signal violations accounted for approximately 302,000 crashes, resulting in 163,000 Functional Years Lost and $7.9B of economic loss.
The CICAS-V system is the furthest advanced of all the CICAS systems. Much of the foundational research on crash causes, technology capabilities, and human factors had been substantially completed under the IVI.
CICAS-V Approach: System Development
The CICAS-V team has developed a Concept of Operations and system architecture to guide the development of a working prototype. Throughout development, the CICAS-V team conducted a series of experiments that provided insight into how the basic processing and calculation capabilities would work. The images below show the infrastructure components of a CICAS-V system installed on the roadside in Oakland County, Michigan, one of three test sites (the others are located in Palo Alto, California and in Blacksburg, Virginia). These installations supported engineering tests and experiments. The in-vehicle components of CICAS-V include a DSRC radio, GPS receiver, and a driver warning system (shown in Figure 3.34).
These hardware components work in cooperation with key software applications including:
- Traffic signal phase and timing (SPaT) information. The SPaT information is received from the intersection controller and contains all the information for each of the traffic signals in the intersection.
- GPS positioning corrections (GPSC). The CICAS-V system requires accurate lane matching in the cases where protected left turn lanes and signals are present so that the system can correctly determine the application traffic signal information. GPS positioning in the vehicle is aided by differential corrections located on the infrastructure.
- Geometric intersection description (GID). The GID is a type of electronic map. The CICAS-V system requires that the vehicle can determine which traffic signal applies to its path through the intersection. In CICAS-V, this is achieved by giving the vehicle a lane-level accurate map of the intersection (the GID). The vehicle, using its GPS and assisted by the GPSC signal. matches itself to the correct lane and can determine the correct signal.
Another important component of the CICAS-V is the in-vehicle driver warning system or Driver Vehicle Interface (DVI). The CICAS-V team tested various warning DVIs (visual, acoustic, haptic) individually and in combination to understand which would offer the greatest effectiveness in getting drivers to stop. The highest effectiveness came through a combination of a visual warning indication, speech warning, and a brake pulse (see textbox on next page for a detailed description of these experiments).
The most effective warning came through a combination of visual, audio, and haptic. The graphic to the side illustrates how the prototype DVI works. As a driver approaches an intersection equipped with CICAS-V, the blue icon lights up to indicate that the CICAS-V intersection is functioning. Using data from the vehicle on speed and distance to the intersection, and gathering data from the infrastructure on signal timing (when the light will turn red), the CICAS-V system calculates the probability of the driver violating the red light. If the probability is high enough, the DVI icon turns to a flashing red and warnings are delivered simultaneously as an audio warning and a brake pulse indication.
Testing of Alternative Driver-Vehicle Interfaces for CICAS-V
One of the primary tasks of the CICAS-V development was to identify a DVI that is effective in preventing crashes by reducing violations and that is acceptable to users. Experiments were conducted under controlled conditions on the Virginia Tech Transportation Institute Smart Road using volunteer drivers. Drivers were purposefully distracted on approach to the intersection as the traffic signal cycled from green to red, creating a situation where the driver was "surprised" by the sudden changing of the traffic light when they returned their attention to the road ahead. The driver's response to the signal change and the CICAS-V system warning was then recorded for analysis and comparison. Data collected was used to determine:
- Whether a tone alert or a speech warning should be used as an auditory component in the DVI. The speech warning investigated was the message "Stop Light."
- Whether the addition of a brake pulse feature would increase DVI warning effectiveness. A brake pulse is a haptic cue in which the car's brakes are momentarily applied and released in a rapid manner to create a vehicle "jerk." The activation of the brake pulse would coincide with the onset of the auditory and visual warnings.
- Whether adding a brake assist feature to the DVI would benefit the driver, when a stop maneuver is performed in a situation where a violation of a traffic control device is imminent. A brake assist feature uses sensing technology on-board the vehicle to help the driver achieve higher levels of braking in emergency situations as compared to a driver's typical braking ability. This could potentially reduce the occurrence of false alarms for the CICAS-V system by permitting the warning to be issued later in the approach to the intersection, since the driver could potentially use the benefits of the brake assist feature to stop in a shorter distance.
- When the warning should be issued (i.e., at what time or distance from the intersection) to minimize false alarms.
Altogether, eight studies looked at eight combinations of interfaces and their effectiveness (see table below). The combination used in study "E" resulted in the highest level of effectiveness and the greatest acceptance by drivers. These results are reflected in the DVI described on the previous page.
| Study | Experimental Driver-Vehicle Interface |
|---|---|
| A | Visual Icon + Auditory Tone |
| B | Visual Icon + Auditory Tone |
| C | Visual Icon + Speech Warning |
| D | Visual Icon + Auditory Tone + Haptic Brake Pulse |
| E | Visual Icon + Speech Warning + Haptic Brake Pulse |
| F | Visual Icon + Auditory Tone + Haptic Brake Pulse + Panic Brake Assist Feature |
| G | Visual Icon + Auditory Tone |
| A | Visual Icon + Speech Warning + Haptic Brake Pulse + Panic Brake Assist Feature |
CICAS-V Approach: Testing
In 2007, a set of working prototype components were installed at intersections and on a set of test vehicles to conduct a pilot test with the following objectives:
- Assess the performance of the CICAS-V system and data acquisition system (DAS). The DAS is required for collecting data during a larger-scale field operational test.
- Conduct human factors evaluations of the preferred DVI to check basic user acceptance. Users found the system to be intuitive and easy to understand.
The CICAS-V pilot test consists of three activities:
- 87 naïve drivers drove a scripted route on public roads through 3 signalized intersections and 10 stop sign intersections for a total of 4,526 crossings.
- Professional drivers tested the more complicated scenarios on Virginia Tech's Smart Track. These tests included attempts to try to "break" the system to ensure that the system is robust.
- Post-test surveys with drivers.
The results of the pilot test will verify whether the CICAS-V system is ready for a field operational test (FOT). An FOT is different from engineering tests and experiments that focus on the components of the system and how well they work. An FOT is designed to answer critical questions: whether users will accept and use the CICAS-V system under normal driving conditions; whether the system introduces any unintended consequences; and whether the system provides safety benefits above and beyond the baseline of no CICAS-V system in use.
The final task of the CICAS-V efforts was to identify the FOT design necessary to address these goals. Specifically, the task focused on:
- The size of the FOT needed, including the number of intersections and the number of vehicles in the test, and the number of drivers involved.
- The cost of the FOT.
- The location of the FOT.
- Additional tests that would need to be run to support the evaluations (for instance, testing the highest risk test scenarios on a test track).
Three designs were proposed (see table below for designs that were investigated). To arrive at meaningful conclusions for each of the questions, the design must take into account the number of drivers needed to study the effects of the CICAS-V system. This further requires an analysis of the number of alerts that could be expected from the alternative designs and the number of estimated violations that might occur during the test. These test designs are structured to capture data on violations and near violations.
| FOT | Number of Subjects | Individual Subject Data Collection | Number of Signalized Intersections | Number of Cars | Overall Duration of Data Collection |
|---|---|---|---|---|---|
| Small | 90 | 5 weeks | 20 | 10 | 52 weeks |
| Medium | 108 | 12 weeks | 20 | 27 | 52 weeks |
| Large | 204 | 12 weeks | 24 | 51 | 52 weeks |
Based on the analysis conducted it was concluded that the number of expected alerts for the small FOT was too small to determine answers to the FOT questions. If the number of alerts generated under the medium and large test is at the high end, most drivers, if not all, will experience at least one alert. However, if the number of alerts is at the low end, the medium FOT would not generate enough data since only about half of the drivers would experience an alert.
For these reasons, it was determined that the large FOT was the best choice for providing answers to the FOT questions with the smallest risk of generating insufficient data for analysis.
Research Findings and Important Results for CICAS-V
Preliminary results from a pilot test show that the CICAS-Violation System works.
- Using 87 naïve drivers on a test track, CICAS-V tests showed that the system is able to identify an impending violation of both signals and stop signs, and deliver a timely alert to warn the driver.
- Preliminary analysis of the data suggest that no false negative warnings occurred—there were no instances in which drivers did not get a warning when they should have.
- The positioning component worked well for all signalized intersections. There were no nuisance alerts due to erroneous lane matching.
- The infrastructure part of the CICAS-V system appears to work well and is very low maintenance. Throughout the period of the pilot test and the time leading up to it there were no outages or required maintenance of the roadside equipment.
The pilot test design was able to identify remaining issues with the system.
- The results of this pilot testing provided minimal modifications for the prototype CICAS-V.
- One issue required that the system be modified during the test. The stop sign warning relied too heavily on driver braking as the means to suppress nuisance warnings. Once modified, nuisance warnings were eliminated.
The CICAS-Violation prototype also successfully met the goals set for objective tests to ensure that the CICAS-V system performed according to specifications.
- The objective test consisted of 13 test procedures with multiple scenarios and runs for each procedure, requiring approximately 200 intersection approaches.
- The tests covered the typical situations that would be encountered when approaching an intersection and tested whether warnings were provided at the correct distance as well as whether nuisance warnings would be suppressed.
- For each objective test procedure, the system needed to pass 6 out of 8 valid runs to pass the individual test. The CICAS-V system passed all tests without any problems.
- One of the tests was an engineering test that would test the limits of the system. In this test, the CICAS-V vehicle was driving behind a tractor-trailer that blocked DSRC messages from the intersection. The system performed well even when more than 40 percent of the messages were not received.
The CICAS-V system is ready for a real-world field operational test.
- The CICAS-V prototype successfully met the goals for the pilot test.
- The CICAS-V system performs better than specified in the performance specifications.
- In addition to testing the system, the pilot test offered an opportunity to test a Data Acquisition System (DAS). The main utility of this DAS is to determine the presence of other vehicles in the cross direction of the intersection and their distance from the intersection. Preliminary analysis of the pilot test data suggests that the DAS performed accurately and offers an important tool for full-scale field operational testing and evaluation.
Next Activities and Final Steps for CICAS-V
The CICAS-V pilot test ended in early Fall 2008. The test data is undergoing analysis to understand the results at a detailed level and to complete the scope of the CICAS-V effort. With a set of more detailed results, the ITS Program and NHTSA will consider whether the CICAS-V system will require further evaluation in the form of a fullscale field operational test (FOT).
CICAS Stop Sign Assist System
CICAS-SSA Partners
- US DOT/RITA/ITS JPO
- FHWA
- Minnesota DOT
- University of Minnesota ITS Institute
- Goodhue County, Minnesota
- Pooled Funds Partners:
- California
- Georgia
- Iowa
- Michigan
- North Carolina
- Nevada
- New Hampshire
- Wisconsin
Until recently, conventional wisdom associated rural thru-stop intersection crashes with a driver "running" the stop sign. Based on this understanding, transportation agencies have implemented strategies to make the intersection more conspicuous: red warning flashers, larger stop signs, or bolder and larger stop bars. However, these strategies by and large have failed to elicit the desired response; crash rates have not changed. Instead, recent research has revealed that the primary causal factor in these rural thru-stop intersection crashes is the failure of a driver to recognize and properly reject an unsafe gap in the oncoming traffic stream. Specifically, research has shown that for drivers who stopped before entering the intersection34:
- The driver looked but did not see the other vehicle (62.1 percent).
- The driver misjudged the gap size or speed of approaching vehicles (19.6 percent).
- The driver had an obstructed view (14.0 percent).
- The roads were ice-covered (4.4 percent).
Of these four driver errors, the first three are a problem with judging the gap; the CICAS-SSA system is designed to provide a technological solution that addresses rural thru-stop intersection crashes.
Through the CICAS Initiative, the ITS Program has established a working partnership with State and local governments and academia (see list of partners in textbox to the side). The goal of the partnership is to develop and evaluate a prototype system that assists drivers in making safer gap assessment decisions at rural intersections between a high volume expressway and a low volume road.
CICAS-SSA Approach: System Development
Development of the CICAS-SSA system has assisted with results of a Pooled Funds Study led by the Minnesota Department of Transportation and the University of Minnesota (see textbox above for listing of partners). The pooled funds project studied whether there were regional differences in drivers' gap acceptance and gap rejection behavior and how those differences might affect the design of a CICAS-SSA system. As a means to this end, the Minnesota team designed, built, and deployed the Minnesota Mobile Intersection Surveillance System (MMISS). MMISS collected two months of data in eight of the nine pooled fund states. Results from this effort show that drivers' gap acceptance and rejection behavior does not vary based on the region or geography across the country.
Using this data, the CICAS-SSA system development proceeded with four major activities:
- Further foundational research was conducted on the CICAS-SSA sensor suite. Various sensors were purchased and installed to determine:
- The sensor capabilities, cost, costeffectiveness, and reliability.
- The minimum suite of sensors needed for an effective CICAS-SSA (see adjacent graphic for intersection overview and sensor placement).
- Driver behavior and driver acceptance of traffic gaps at a high crash, dangerous intersection during varying conditions (day/night, adverse weather) and for different age groups and vehicle classifications.
- Development of the CICAS-SSA warning sign—the Driver-Infrastructure Interface (DII). The ability to quantify driver behavior provided critical input that was necessary for developing the DII—an animated graphical display. The DII development efforts included the design and experiments on three different types of signs to assess which sign was most effective in terms of clear presentation of information, timing, and information content.
- Development and installation of a field-based prototype CICAS-SSA system that combines the sensor suite and DII. The system design is based on an open architecture to ensure that the system can be easily upgraded should improved sensors, computers, and driver interfaces become available.
- Pilot tests to assess the system's performance and driver acceptance under real-world but controlled test conditions. The intersection chosen for data collection on driver behavior, sensor testing, and pilot testing is located in Goodhue County, Minnesota at the intersection of US 52 and Goodhue County Route 9 (see illustration at left).
The textboxes on the following pages present research details and results on two of the key components of the CICAS-SSA system—the experiments that led to the choice of the most effective DII; and the determination of the minimum sensor suite needed for an effective CICAS-SSA.
CICAS-SSA Approach: Testing
Pilot tests of the CICAS-SSA system were launched in late Summer 2008. The tests involve approximately forty-five participants. Each participant was instructed to drive through the intersection twelve times: six times with the sign 'on', and six times with the sign "off".
This first test is being conducted using passenger cars; following this test, a similar set of tests will be conducted with heavy trucks. The results of both pilot tests are due in January 2009 and will provide recommendations on how to proceed with further testing.
Importantly, because the CICAS-SSA uses infrastructure-based displays, the system must meet standards and specifications set through the Manual on Uniform Traffic Control Devices (MUTCD). The Minnesota DOT has worked closely with the National Committee on Uniform Traffic Control Devices and FHWA to receive permission for the installation at the test intersection and to ensure that the final system meets MUTCD standards.
Additionally, the CICAS-SSA sign is based on typical, commercially available displays that use off-the-shelf color LED (light emitting diode) components, making the sign readily available for State and local agency procurement.
Research Findings and Important Results
The CICAS-SSA system is showing a trend toward drivers accepting a safer gap for crossing or turning when the sign is "on".
- An important trend emerging as of the printing of this report is that, overall, the time that drivers took to assess the gap increased for all three concept signs. Based on driver comprehension, the Icon sign was selected for pilot testing.
- Simulator results also showed no statistically significant differences in the average size of the accepted gap during either day or night conditions or based on age.
The CICAS-SSA Initiative has produced a warning sign that is understandable and effective.
- The CICAS-SSA is an innovative infrastructure-based animated display (sign). Three types of signs were tested— an Icon sign, a Countdown sign, and a Hazard sign. Test results with drivers using a simulator showed that for decision support, the Icon sign is highly preferred and most easily comprehended by drivers with 67.8 percent of test drivers using the Icon sign to decide when the gap was safe enough to proceed (see textbox on following page for details of the tests).
- CICAS-SSA preliminary observations and analysis suggest that the CICAS-SSA signs are having a small but positive effect on driver behavior:
- When using the CICAS-SSA, on average test participants are rejecting gaps that are approximately 2 percent larger while waiting at the stop sign and rejecting gaps that are approximately 9 percent larger while waiting in the median, suggesting that drivers are choosing to cross through safer (larger) gaps when using the sign than when crossing unassisted. This effect also appears stronger when crossing from the median to the far side of the road (crossing northbound traffic), a crossing maneuver that has been associated with more crashes at this particular intersection.
- The CICAS-SSA appears to increase the frequency of two-stage maneuvers—after assessing the gap in traffic approaching from the left, the driver crosses the first leg of the artery and stops in the median to assess the gap in traffic approaching from the right. Results indicate that 80 percent of crossings are two-stage with the sign on and 60 percent during sign off conditions. This marked increase in the frequency of two-stage maneuvers due to sign use is a positive behavioral change in light of the fact that the majority of crashes at the test intersection tend to occur when drivers perform one-stage maneuvers.
- Although overall crossing and wait times appear to be unaffected, safety margins were shorter (6 percent shorter while crossing southbound and 25 percent shorter crossing northbound), most probably because drivers are waiting slightly longer to make their crossing decision (i.e., larger lead gaps).
- In terms of drivers' attitudes towards using the CICAS-SSA signs, participants do not appear to find their experience to be any more stressful, to involve more effort, or to negatively affect their perceived level of safety while crossing. Driver surveys are revealing that the signs are thought to be useful.
Experiments on the CICAS-SSA sensor suite have resulted in a working intersection prototype that is projected to cost less than $200,000, which is less than the cost of a rural signalized intersection.
- CICAS-SSA research addressed the number and types of sensors required for an effective CICAS-SSA system. Sensors were mounted along the major, fast moving main leg of the intersection; the minor, rural road representing the slower moving leg of the intersection; and the crossroads/median. Data was collected to gauge the most effective and cost-effective set of sensors. (See textbox on page 78 for a description of the experiments associated with determining the minimum suite of sensors.)
- The final price point may prove cost-effective for State and local governments and the components are off-the shelf and easily deployable.
Development of the CICAS-SSA Driver Warning Sign (DII)
Simulator studies were conducted to identify the best sign design for presenting information to drivers at the intersection. The studies evaluated three concept signs using younger (20–40) and older drivers (55–75) to determine which informational elements and styles result in safer crossing behaviors. The driving simulator modeled the real-world test intersection at the crossroads of US 52 and Route 9 in Goodhue County, Minnesota. The simulator was able to test the drivers' acceptance of the signs during high (day) and low (night) visibility conditions. The three signs are illustrated below. Further detail on the experiments can be found at: www.its.umn.edu/Publications/ResearchReports/pdfdownload.pl?id=656.
The simulator studies tested signs that met the Manual on Uniform Traffic Control Device (MUTCD) standards. The signs that were tested include variations of each of the following three signs:
- Icon Sign: Two identical signs (one in the median on the left for traffic approaching from the left and one on the far right for traffic approaching from the right) provided drivers with warning indicators about approaching traffic and a "prohibitive" message for each set of traffic lanes.
- Countdown Sign: Two identical signs (one at the stop sign for near lane traffic; one in the median for far lane traffic) provided drivers with a timer countdown indicating how far away (in seconds) approaching traffic is for each set of lanes. The countdown sign was combined with Icon messages to indicate prohibited actions (i.e., do not cross or do not turn left) as seen in the left and middle signs. The bottom half of the right hand sign is clear, indicating no warning.
- Hazard Sign: Two identical signs (one located on the stop sign; one located on the yield sign in the median) provided a flashing yellow "Traffic Too Close" message to alert drivers to the presence of traffic on the main roadway, as seen in the right hand sign.
In the study, the Icon sign performed best overall. This sign also did not produce any unsafe or unexpected behaviors from drivers. The Icon sign continued to be highly preferred by the subjects in this study and 67.8% of study participants said they used the sign to help them make their gap acceptance decision. The Icon signs presented below are the signs deployed and working at the Minnesota intersection.

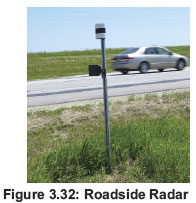
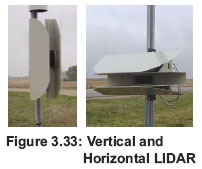
Next Activities and Final Steps for CICAS-SSA
The final steps in CICAS-SSA include:
- Analysis of pilot validation testing. CICAS-SSA system testing is underway through October 2008. Using instrumented vehicles at a test intersection with the proposed signs, the CICAS-SSA team is studying the detailed behavior of participant drivers and approaching traffic.
- Rural Safety Innovation. In August 2008, the US DOT's Rural Safety Improvement Program awarded a team consisting of the Wisconsin Department of Transportation; Village of Minong, Wisconsin; Washburn County, Wisconsin, the Traffic Safety Commission; the University of Minnesota; and the University of Wisconsin with the opportunity to implement, demonstrate, and validate a CICAS-SSA system. Similar to the Minnesota intersection, the implementation of a CICAS-SSA at Wisconsin intersections will address rural thru-stop intersection crashes and evaluate the ability of the system to reduce the frequency of rural fatal and serious injury crashes at these intersections. The reduction in crashes at the Wisconsin intersections is expected to reach 80 percent. This test will provide additional data points to the CICAS-SSA test data, allowing for a more robust assessment of the safety benefits of the system.
CICAS Signalized Left Turn Assist
CICAS-SLTA Partners
Since 2006, the ITS Program has established a working partnership with State and local governments and academia to research the driver behavior and complexity of the intersection environment and to evaluate technology capabilities. Partners include:
- US DOT/RITA/ITS JPO
- FHWA
- Caltrans
- University of California PATH Program
- University of Michigan Transportation Research Institute
CICAS-SLTA is the most complex of the systems as it addresses multiple interacting vehicles and other road users within difficult and dynamically changing urban environments. This requires the technologies to have more advanced solutions to address more complicated intersection situations.
The primary purpose of the CICAS-SLTA system is to provide support to the driver to avoid collisions during permissive left turn movements with oncoming traffic. This type of crash accounts for 27% of intersection crashes.35 The CICAS-SLTA system addresses vehicle-vehicle head-on crashes, sideswipe crashes, and potential crashes from conflicts of left-turning vehicles with other roadway users such as pedestrians and bicyclists.
The CICAS-SLTA addresses left turn safety problems at intersections without the need to alter the signal phasing, such as replacing a permissive left by a protected left turn, which typically leads to traffic flow reductions and might not be feasible in some circumstances. If the CICAS alerts can provide effective assistance to drivers, the CICAS-SLTA may even increase intersection capacity by helping drivers distinguish acceptable turning gaps, reducing the number of adequate gaps that are rejected. From this perspective, it offers another option for the traffic engineer to consider when an intersection has left turn safety problems
CICAS-SLTA Approach: Research and System Development
The CICAS-SLTA team has developed a Concept of Operations and is conducting foundational research to establish the system requirements and understand today's technology capabilities. Currently, a series of experiments are underway that include:
- Understanding driver response to warnings—The experiment is designed to examine the effectiveness of two warning technologies: a DII and a DVI. The experiments are comparing how each system influences positive driver response, including decisions on waiting for a safer gap in traffic before turning left or braking and yielding to oncoming traffic. The research is also assessing how the location of the warning technology—either installed on the infrastructure or in the vehicle—affects the amount of time needed to present an effective warning (or onset timing requirements). Results of this work are summarized in the textbox on the next page.
- Development of an effective and timely alert system with little or no false positive alerts—Using radar and videos from the test intersections, the team is analyzing a range of behaviors associated with speed, vehicle deceleration, and intersection clearance times to understand how drivers avoid crossing path crashes (or fail to avoid them). The analysis to date has highlighted the timing requirements (see textbox on next page for results) for presenting the driver with information and the differences when:
- Presenting the driver with decision support.
- Providing the driver with a warning regarding an imminent crash.
- Providing the driver with additional warnings when a driver does not heed an initial system warning.
Next Activities and Final Steps for CICAS-SLTA
- CICAS-SLTA research is providing a foundation for system development.
- Foundational research on left turn behavior (required to advance existing technology capabilities) has revealed that drivers making left-turn decisions can be influenced to choose a safer (larger) gap using both in-vehicle and infrastructure-based warning displays.
- A summary of the results from experiments comparing the DII to the DVI is described below.
Summary of Driver Infrastructure Interface (DII) versus Driver Vehicle Interface (DVI) Results
Forty-eight road trials were conducted using the same test participants. The goals were to:
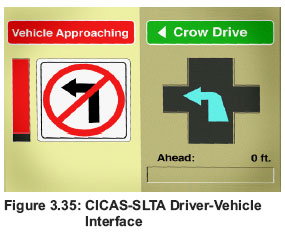
- Evaluate how effective the DII versus DVI might be at influencing the driver's decision on when to turn.
- Determine how use of a DII versus DVI affected the requirements for the timing of the information delivery to the driver (also known as warning onset).
- Determine how the warning and timing of the warning affected the driver's braking response.
Using a controlled test environment that was closed to traffic, drivers approaching the intersection were provided with a range of alerts and warnings from both the DII and the DVI. Through observation of behavior and post-test surveys, drivers overall revealed that they preferred DII to the DVI, for two reasons:
- Visual location. The DVI was considered too low and out of the view of drivers who were concerned about looking away from the oncoming traffic.
- Auditory component. Most drivers did not consider the voice component intuitive and felt its warnings were potentially too frequent.
However, both systems were found to have the potential to reduce unsafe turns. The DII helped reduce unsafe turns by 55 percent and the reduction with the DVI was 28 percent.
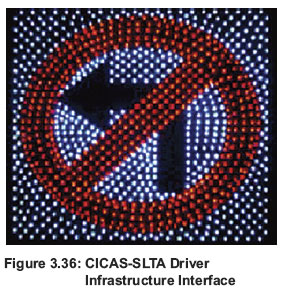
In terms of the timing of the information delivery, drivers overall preferred to have 3–4 seconds of information alert. Older drivers who preferred the DII also preferred the information alert even earlier. Drivers were more comfortable with the DVI presenting the warning later, but this heightens the risk of an intersection collision and is not preferred.
In terms of how the timing of the warning affected braking, tests revealed that for the general driving population, the initial turning decision of the driver occurred 2.5 – 3 seconds before the turn, regardless of warning type or modality. This data provides insight as to the timing to provide "situational awareness" to assist the driver (less than 2.5 – 3 seconds before arrival at intersections) or provide an actionable warning (more than 2.5 – 3 seconds before arrival at intersections). The full report on experimental results and recommendations can be found at:
http://repositories.cdlib.org/its/path/reports/UCB-ITS-PRR-2008-1/.
Next Activities and Final Steps for CICAS-STLA
Based on the findings of the experiments to date, the CICAS-SLTA will move into prototype development and system testing. Next steps include:
- CICAS-SLTA system development. The CICAS-SLTA data analysis from experiments will be completed in September 2008 and will inform further progress on the project.
- CICAS-SLTA field measurements. Field measurements are underway to identify left-turn conflicts and to quantify vehicle and other road user movements. These real-world measurements are aimed at further developing and tuning the CICAS-SLTA alert and warning calculation capability.
- Planning for CICAS-SLTA demonstration tests. Engineering tests on the system, including the DII and DVI, are planned for 2009 at a California intersection. These tests will demonstrate system performance, driver acceptance, and establish a baseline of data for comparison in a full-scale field operational test.
CICAS Traffic Signal Adaptation
The CICAS-Traffic Signal Adaptation (TSA) concept was developed from combining components from CICAS-SLTA and CICAS-V systems. The CICAS-TSA combines the infrastructure sensing features of CICAS-SLTA with the violation warning vehicle-based features of CICAS-V. Using data from the vehicle regarding the high probability of the vehicle violating a red light, the CICAS-TSA system acts to extend the red light to allow the intersection to clear itself of all cars, including the violating vehicle. Specifically:
- Vehicles equipped with CICAS-V gather data on vehicle movement to identify the level of probability for a potential red light violation and transmit this data to the infrastructure systems.
- CICAS-SLTA infrastructure-based traffic detectors act in coordination to:
- Provide further data on location and speed of unequipped vehicles.
- Gather real-time traffic signal phase timing status from the signal controller.
- Synthesize vehicle and infrastructure data and trigger a message back to the signal controller to adjust the phasing to an all-red status.
The graphic below illustrates the CICAS-TSA system.
CICAS-TSA Approach: Research and System Development
Using results from a number of research studies and combining them with data from CICAS-SLTA and CICAS-V experiments, the CICAS-TSA team has:
- Developed the hardware and software needed to operate the system.
- Modified and enhanced traffic signal controllers to incorporate CICAS-TSA functionality. Work has been performed specifically on an older (legacy) version of a controller that is in predominant use throughout the country.
CICAS-TSA Approach: Testing
In late Fall 2008, the CICAS-TSA is expected to launch a controlled series of engineering tests at a California intersection. These tests are planned around two of the CICAS-V DSRC-equipped intersections and will use up to six DSRC-equipped cars on at least two approaches, all driven by researchers and engineers. The tests are expected to validate the CICAS-TSA processing and timing parameters, and importantly, to provide an initial field deployment for decision-makers to understand the impacts and effects of the system.
Research Findings and Important Results
CICAS-TSA research has reviewed the effectiveness of red light running systems and has provided a clearer understanding of a variety of red light running scenarios and outcomes.
- Research results showed that red light running systems are effective at reducing right angle crashes by over 55 percent and the injury rate of right angle crashes by over 56 percent.
- Analysis revealed an important insight—only 10 percent of red light running occurrences are caused by vehicles being caught in the dilemma zone (the point when a yellow light creates a dilemma for the driver as to whether to run the yellow light or brake precipitously to be safe but potentially cause a rear-end crash). Instead, over 60 percent of red light running vehicles were part of a platoon of vehicles completing passage safely through the intersection. Under these conditions, the common practice by local transportation agencies of extending the green phase to avoid creating a dilemma zone for drivers may not perform as expected. A green extension would potentially encourage more cars to platoon through the intersection.
- These results highlight the importance of developing the CICAS-TSA capability to correctly predict when a true red light running incident will occur and endanger other vehicles.
CICAS-TSA has established the basis for actively protecting drivers from the impending crash hazard caused by red-light running.
- Using data on red light running systems and driver behavior, CICAS-TSA research has resulted in the basis for system calculations that can predict and determine "how", "when" and "for how long" to adapt the signal timing. As a result, the CICAS-TSA system can implement an all-red extension as soon as vehicles running a red light pass the last infrastructure sensor. Further, when working with a CICAS-V vehicle, or when continuous speed and location information from the vehicle is available, CICAS-TSA can trigger a signal adaptation in a "lastminute" manner to ensure greater protection for all drivers.
Next Activities and Final Steps for CICAS-TSA
The next activities in the testing of the CICAS-TSA include:
- CICAS-TSA pilot field tests. The activities to move the prototype CICAS-TSA to a set of pilot field tests will require the implementation of the system on a research intersection off public roads, where engineering development, test process and buy-in from local authorities can be established. Once set, permission will be sought to conduct the tests on California public roads, which requires trial approval from the California Traffic Control Device Committee. Once permission is obtained, tests will be conducted. To fully validate the system under real-world conditions, the CICAS-TSA will expand the initial tests to include multiple vehicles over multiple Caltransowned and -operated intersections. The scale and scope of this expansion is currently being planned.
CICAS Implementation
Ultimately, State and local governments will decide whether to deploy the infrastructure side of the CICAS solution, and automotive manufacturers will make the decision on whether to install and deploy CICAS solutions in vehicle product lines. However, the Initiative has focused on understanding issues associated with deployment and market commercialization. Ongoing stakeholder meetings are held to allow State and local agencies and vendors to provide input to critical problem definition and to participate in reviews of important results. In addition to regular teleconferences, the CICAS Initiative has convened:
- A workshop with traffic signal manufacturers to structure a working partnership based on common infrastructure interests in the design of the signal interface and signal communications. This industry was invited to participate in the CICAS-V Program Design Review in November 2007. Comments were incorporated into the design before a working prototype was developed for pilot testing.
- A public agency stakeholder group open to and comprising State and local agencies to gain a perspective on deployment scenarios. States that consistently meet include Arizona, California, Florida, Michigan, Minnesota, and Virginia. The CICAS Initiative has also reached out and engaged operators and engineers at the local agency and municipal level for a better understanding of how CICAS systems will be integrated with existing infrastructure.
Because successful deployment of CICAS requires consumer acceptance, the CICAS Initiative has engaged stakeholders on privacy and liability issues. Finally, the CICAS Initiative is being closely coordinated with the VII Initiative, as the VII architecture incorporates CICAS vehicle- and infrastructure-based components into one cooperative system.
CICAS Roadmap
The CICAS Initiative is on schedule. However, there are important shifts since the 2006 Five-Year Program Plan:
- The field operational test plans for all systems are under reconsideration. In 2006, the plan was to conduct three separate field operational tests. With the testbed development under the VII Initiative, the ITS Program will instead consider how individual safety applications might be combined to evaluate a wider array of safety benefits. The analysis and final results of the individual CICAS system pilot tests will provide the basis for deciding when and how to proceed with further testing.
- The CICAS cost-benefit analysis task highlighted in the 2006 plan has been incorporated into the VII cost-benefit analysis task. The CICAS Initiative roadmap can be found on the next page.
3.2.3 IVBSS Initiative
The Transportation Problem
More than half of all crash-related fatalities are caused by three types of crashes: rear-end, lane-change (merge), and road-departure or lateral-drift (inadvertently driving off the side of the road or drifting into another lane). Collectively, these three crash types account for 60 percent of all police-reported light vehicle (automobile) and heavy truck crashes, as shown in Figure 3.39.
Individually installed, single-function crash-warning technologies are available in today's automotive marketplace. This "one-technology per crash-type" approach, however, may not fully address the problem, as single-function technologies are not designed to provide warnings for multiple, simultaneous threats. For example, when a driver gains speed to merge onto a highway, two threats may be present—the threat of a fast-moving vehicle in the driver's blind spot during the merge and the possibility of traffic stopped ahead due to congestion. In this instance, the two separate crash-warning technologies would simultaneously provide warnings to the driver, with no information on which crash is more imminent or more serious.
An integrated system of crash-warning technologies offers a robust solution. Yet little quantitative data exists on the potential effectiveness of an integrated system and whether such a system can:
- Arbitrate among multiple threats and prioritize warnings for the driver.
- Detect all three types of crashes.
- Provide clear alerts or warnings to drivers to elicit an effective response and without causing confusion.
Further, no quantitative measurements exist on the safety benefits, cost-effectiveness, or driver acceptance of an integrated crash-warning system. These measurements are critical to automotive industry decision-makers when deciding whether to incorporate an integrated system into their vehicles.
The ITS Opportunity
Intelligent vehicles are a key component in fully realizing the safety benefits of an ITS-based transportation network. Through the integration of multiple crash-warning technologies, the IVBSS Initiative provides the opportunity to make vehicles smarter and safer and provide drivers with increased situational awareness of the threats and hazards within the driving environment. The integration of three single-function technologies into one integrated IVBSS system advances the state-of-the-art in crash prevention and delivers a system capable of:
- Identifying the threats associated with all three crash types and identifying multiple threats as they occur simultaneously.
- Promptly assessing and arbitrating between threats, and prioritizing the seriousness of the threats for the driver.
- Delivering information to drivers using alerts and warnings that are designed to elicit appropriate and timely responses for both automobiles and trucks.
- Reducing false alerts and nuisance warnings.
The IVBSS Initiative Approach
In cooperation with the automotive industry, the IVBSS Initiative will develop, pilot test, field test, and evaluate an integrated system. Research activities include:
- Combine three detection systems into an integrated system and integrate their sensor data.
- Experiment with a range of options for delivering information to drivers to understand which offer the safest and most effective warnings that command a driver's attention yet avoid creating confusion.
- Demonstrate and pilot test the IVBSS system's performance and capabilities through a series of controlled, on-road and test track tests.
- Evaluate the system's effectiveness and benefits through a more comprehensive field operational test.
- Facilitate industry adoption by providing decision-makers with test procedures and results that guide the incorporation of IVBSS systems as part of new vehicles.
IVBSS Initiative Accomplishments to Date
- Developed the IVBSS system and installed the system on a set of prototype light vehicles (includes passenger cars, Sport Utility Vehicles SUVs, pick-up trucks, and minivans) and heavy commercial vehicles (includes trucks over 10,000 pounds).
- Identified the effectiveness of a variety of alerts and warnings to understand which best communicated information to drivers. Published results to guide industry development of intuitive driver-vehicle interface (DVI) both for light vehicles and for trucks.
- Conducted test-track and on-road tests to assess the system performance for both vehicle platforms and verified that performance meets program requirements.
- Developed a plan for field operational testing under real-world conditions to assess potential safety benefits, cost-effectiveness, and driver acceptance.
IVBSS Initiative Results to Date
The IVBSS prototype system has successfully completed system performance verification tests. On-road and test track tests results revealed that:
- The IVBSS prototype system can arbitrate between multiple threats—the system recognized all potential crash situations successfully and produced appropriate alerts when exposed to real threats.
- The system was able to distinguish between and provide warnings for targets that posed a threat and those that did not such as bridges and other physical infrastructure features.
- The system successfully kept nuisance alerts below the maximum allowed for the system.
- Test results can be obtained at:
www.nhtsa.dot.gov/staticfiles/DOT/NHTSA/NRD/Multimedia/PDFs/Crash%20Avoidance/2008/810952L o.pdf.
The IVBSS alert/warning experiments produced results that will assist manufacturers in tailoring commercially available DVIs for optimal effectiveness with drivers. For example, results showed:
- In comparing the effectiveness of auditory warnings against a range of sound characteristics, tests revealed that reaction times increased slightly when warnings had increasing numbers of bursts, increasing numbers of beeps in a burst, or delays between bursts.
- For all threat types and warning signals, drivers were likely to fixate on the area forward of the vehicle—even for lane change-merge warnings where the hazard was on the side of the vehicle. There was not, however, any consistency in where the drivers looked or the sequence in which they looked around.
- In testing how drivers responded to a single warning versus two warnings that occurred simultaneously, results revealed that drivers had no strong preferences for any distinct prioritization rule. Results also showed no one approach to warning combinations (single, dual-simple, dual-hybrid, or multiple warnings) led to noticeably better driver responses, though drivers favored the multiple warning approach least. A dual-warning approach is recommended for IVBSS.
- Driver-interface experiment results can be obtained at:
www.nhtsa.dot.gov/staticfiles/DOT/NHTSA/NRD/Multimedia/PDFs/Crash%20Avoidance/2008/DOT-HS-810-905.pdf.
The IVBSS prototype system is ready for operational testing and evaluation under real-world conditions. The IVBSS Initiative has developed an operational test plan that will test the IVBSS system on 16 automobiles and 10 trucks over a period of 12 continuous months.
The IVBSS Initiative has taken the first steps toward commercialization.
- The test procedures developed for the IVBSS system and test results have been provided to the automotive industry and other interested stakeholders and are available at: www.itsa.org/ivbss.html.
- The IVBSS Initiative team has worked closely with industry, held annual public meetings, and sought stakeholder consensus on high-level requirements. Through the final steps of the IVBSS Initiative, the Department will continue to ensure that research results are readily available as a means of supporting automotive companies and suppliers with their business investment decisions regarding introduction of IVBSS-like systems into the marketplace.
The IVBSS Initiative has advanced the state-of-the-art in crash warning systems.
- Integrated systems have not been the subject of substantial public research efforts in the past. What differentiates the IVBSS efforts from previous efforts is two-fold: (1) the ability to protect against multiple crash types is being evaluated as part of an integrated system, rather than separate technologies, and (2) the level of integration is greater than in prior programs of this type.
The Problem
Approximately half of all crash-related fatalities—accounting for 27,500 lives annually36—are caused by three types of crashes: rear-end, lane change/merge, and road-departure or lateral-drift (inadvertently driving off the side of the road or drifting into another lane). Collectively, these three crash types account for 60 percent of all police-reported light vehicle (automobile) and heavy truck crashes (see pie chart to the side).
Prior to 2004, these facts led the ITS Program, NHTSA, and the automotive industry to collaborate on the design and development of crash-avoidance technologies addressing a single crash type for light vehicles. As part of the Intelligent Vehicle Initiative (IVI) research, three prototype technologies were developed and tested independently. These technologies actively address safety by providing the driver with greater awareness of situations and conditions that may lead to a crash—known as "situational awareness". (See Figure 3.41 for an illustration of three technologies and their ability to "view" and assess surrounding conditions for greater driver awareness.)
In addition to technologies' capabilities for gathering critical data and monitoring the situation for potential hazards, these technologies provide in-vehicle warnings that alert the driver to the impending hazard and the potential for a crash, thus allowing the driver to take action to avoid the crash or significantly reduce the impact.
More recently, these crash-avoidance technologies have become available in the automotive marketplace; however, they usually exist as "single function" warning systems—one technology for each crash type—which may lead to the following potential challenges:
- Independent systems are not capable of advising drivers which warning is most urgent or which warning represents the greatest potential hazard (i.e., when a vehicle merging onto a highway might detect a danger of both a rear-end and a lane-change crash).
- Different systems may have widely varying warning thresholds such that one system may warn frequently of low-hazard situations, creating a nuisance, while another system may warn only when a potentially severe crash is imminent. The frequency of nuisance warnings may lead drivers to ignore all warnings, including those delivered to alert the driver of the imminence of a serious crash.
For crash-avoidance systems to be most effective and for drivers to receive the most useful information, integration is key. Crash avoidance requires that the integrated system track threats from the individual warning functions and prioritize the crash threats for the driver. The warning system must then be able to communicate the appropriate warning to the driver without causing confusion or eliciting a response that worsens the situation.
Yet little quantitative data exists on the potential effectiveness of an integrated system—merging the three technologies together—and whether an integrated system could:
- Effectively arbitrate among multiple threats and prioritize warnings for the driver.
- Reliably detect all three types of crashes.
- Provide clear alerts or warnings to drivers about threats without causing confusion and then elicit effective driver response.
Further, no quantitative measurement of the safety benefits, cost-effectiveness, or driver acceptance of an integrated crash-warning system has been accomplished. Automotive industry decision-makers lack information on the effectiveness and consumer acceptance of such systems that is necessary to justify continued investment in their development or their adoption in the vehicles they manufacture.
The ITS Opportunity
Intelligent vehicles are a key component in fully realizing the safety benefits of an ITS-enabled transportation network. Through the integration of multiple crash-warning technologies, the IVBSS Initiative provides the opportunity to make vehicles smarter and safer and provide drivers with increased situational awareness of the threats and hazards within the driving environment. The integration of three single-function technologies into one integrated IVBSS system advances the state-of-the-art in crash prevention and delivers a system capable of:
- Identifying the threats associated with all three crash types and identifying multiple threats as they occur simultaneously.
- Promptly assessing and arbitrating between threats, and prioritizing the seriousness of the threats for the driver.
- Delivering information to drivers, using alerts and warnings that are designed to elicit appropriate and timely responses for both automobiles and trucks.
- Minimizing false alerts and nuisance warnings.
The IVBSS Approach
The IVBSS Initiative is a two-phased research, development, and evaluation effort focused on the following objectives:
- Integration of three independent safety technologies.
- Development of quantitative system performance data on the effectiveness of an integrated system.
- Testing of the system capability to arbitrate between and prioritize warnings.
- Development of an intuitive driver interface that effectively provides information to actively assist the driver in avoiding crashes. An effective interface will reduce the potential for driver confusion.
In defining the IVBSS system, input from stakeholders, previous tests, and actual drivers helped determine that two types of information would be provided: crash alerts and advisories.
Crash alerts are audible, visual, or haptic displays that help make the driver aware of an existing or quickly developing potential crash threat. Drivers are then responsible for deciding whether and how to respond to the threat.
Advisories are less urgent warnings that are intended to assist drivers in decision-making to reduce the likelihood that a crash will develop.
With these two types of information, IVBSS offers a vehicle system that supplements drivers' situational awareness. IVBSS will not assume control of the vehicle, so there is no ongoing control function (e.g., active cruise control or lane-centering assist) and no automatic crashavoidance control (e.g., automatic braking).
As part of the IVI effort, the crash-warning safety systems had successfully undergone evaluation as independent, singlefunction warning systems. Building upon these results, the IVBSS integration goals are focused on advancing system performance through:
- Increased system reliability.
- Reduced nuisance warnings to the driver.
- Improved driver-reaction time to warnings.
- Improved driver acceptance.
Two important guiding principles form the basis for the IVBSS research:
- To collaborate with industry to develop an integrated system with an intuitive driver warning system for both cars and trucks, using an open process that facilitates industry acceptance and accelerated commercialization.
- To assess the safety benefits, cost-effectiveness, and driver acceptance associated with the new system as the basis for future policy and industry investment decisions.
The IVBSS System
The IVBSS system is made up of a suite of sensors on the vehicle (the types of sensors used on light vehicles versus trucks differ). Sensors include vision-based cameras, radar, and vehicle sensors, complemented by other technologies such as Global Positioning Systems (GPS) and digital mapping. All systems include software that allows the system to interact with the vehicle to monitor vehicle speed and longitudinal and lateral acceleration along with driver steering, brake and throttle inputs, and to provide messages to the driver if necessary. Figure 3.42 illustrates the sensor coverage provided by the IVBSS system on a car—providing the driver with 360-degree situational awareness to identify specific types of surrounding hazards with the assistance of the sensors. Figures 3.45 – 3.46 on the next page illustrate the sensor placements on the automobile and truck platforms.
The driver-vehicle interface, or DVI, is the means by which a driver interacts with the system—the driver is notified of a hazard, the driver prioritizes the hazard over other threats or other distractions (such as cell phones) and the driver is prompted to take action. The DVI is a critical component of the system. Figures 3.43 and 3.44 below illustrate the DVIs for the integrated IVBSS system for both automobiles and trucks.
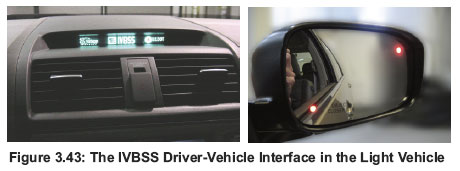 |
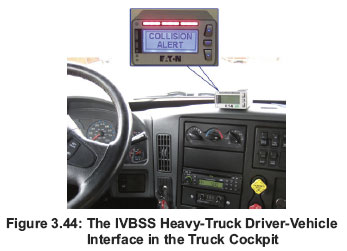 |
As no DVI existed that satisfied the criteria for the potentially life-saving IVBSS notifications, the IVBSS Initiative developed a prototype DVI for the test and conducted a series of experiments to ascertain which features worked most effectively. Five human factors experiments were conducted to differentiate how a variety of audible, visible and haptic (producing a physical sensation) warnings for the integrated warning subsystems were understood and responded to by the driver (see Table 3.4 below for illustrated examples). Research was also completed on the display requirements for drivers.
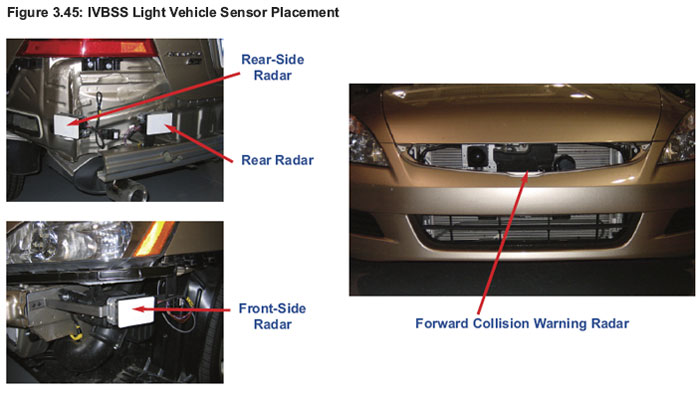
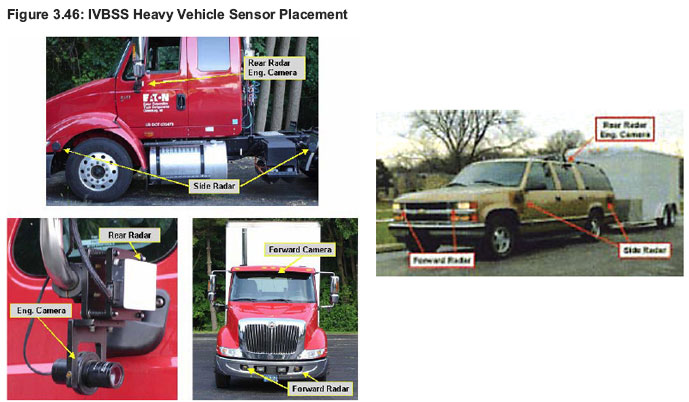
Based on these objectives, goals, and principles, the IVBSS Initiative team has structured the following program:
Phase 1: Research and Development.
Phase 1 activities include:
- Development of the IVBSS prototype system
- Researched and developed an integrated prototype system that combines three detection systems (which then become subsystems within the one system) and integrates their sensor data across the subsystems.
- Developed and tested algorithms that provide the ability for the integrated system to prioritize, or arbitrate, warnings based on assessment of the severity of the threat.
- Developed objective tests and criteria for the performance and effectiveness of an integrated system that simultaneously addresses rear-end, road departure, and lane change crashes.
- Conducted a series of test-track and on-road tests to evaluate system performance (see textbox below for details on test design).
IVBSS Test-Track and On-Road Test Designs (Phase 1)
Between September 2007 and March 2008, a variety of test-track verification and on-road tests were conducted on each of the IVBSS prototype plaforms. Specifically:

- On-road tests were designed to allow test drivers to drive the vehicles in real-world conditions to:
- Measure the system's susceptibility to nuisance alerts.
- Assess the alerts in perceived crash-risk situations as they arise.
- Exercise the crash warning functions to develop a better understanding of the warning system's logic.
The on-road tests employed approximately 300 miles of freeway, arterial, and local roads throughout southeast Michigan under a variety of roadway conditions, light conditions, driving manuevers, and exposure to other vehicles (see maps to the side).
- Test-track verification tests allowed for a wider range of test scenarios to safely evaluate how the system works under varying conditions that could not (for safety reasons) be tested during on-road tests, to evaluate system performance, and to verify that the prototype integrated system meets design requirements and is ready for use in the field operational test. Testing scenarios were designed to reflect the crash types that occur the most frequently. The system was also tested for its ability to supress alerts in scenarios when a warning was not required. The test procedures include the following:
-
- Extensive test-track testing was performed for both platforms and included the following test scenarios (see example scenario illustrated below): 12 rear-end crash threats; 5 lane-change threats; 8 road departure crash threats; 2 multiple threats; and 8 no-warn threats.
- Test scenarios and specifications incorporating varying speeds, closing rates and road geometry.
- Pass/fail criteria for evaluating system performance.
- A set of measurement variables that will be used to evaluate system performance when compared to an independent measurement system installed on the test vehicle.
Detailed test plans for both platforms are available at: www.itsa.org/ivbss.html.
Summary of IVBSS On-Road and Test-Track Tests (Phase 1)
Overall, the IVBSS system passed all on-road and test-track tests. However, some tests revealed system failures or system anomalies. Phase 1 was extended to allow both the light-vehicle and heavy-truck teams to update IVBSS and re-run the track testing for the affected tests. The affected tests were rerun in November 2007 and February 2008. The final result of all of the tests concludes that the IVBSS system satisfies performance guidelines required to proceed to Phase 2 of the program.
On-Road Tests Summary:
- Tested valid alert rates versus nuisance alerts.
- Tested Lane Departure Warning (LDW) availability to track both left and right lane markers.
| Automobile | Truck | |
|---|---|---|
| Nuisance Alert Rates —Test limit of 15 per 100 miles | 11.4 per 100 miles | 7.4 per 100 miles |
| LDWAvailability | Exceeded availability targets but tests revealed degraded system performance under rainy conditions, which likely limits the system's ability to identify contrast between the road surface and lane markings. | Exceeded availability requirement for freeway and arterial roads, but not for local roads—most likely due to rainy conditions and salt residue on the surface of lane markings. |
Test-Track Tests Summary:
| Automobile | Truck | |
|---|---|---|
| Pass/Fail Scenarios: | 11.4 per 100 miles | Required |
| Forward Collision Warning (FCW) (Warns drivers of the potential for a rear-end crash with another vehicle) |
Passed All (7) | Passed All |
| Lateral Drift Warning (LDW) (Warns drivers that they may be drifting inadvertently from their lane or departing the roadway) |
Passed All (5) | Passed All (4) |
| Curve Speed Warning (CSW) (Warns drivers that they are driving too fast into an upcoming curve and as a result might depart the roadway) |
Passed All (2) | (CSW capability not included on truck platform) |
| Lane Change Warning (LCW) (Warns drivers of possible unsafe lateral maneuvers based on adjacent or approaching vehicles in adjacent lanes, and includes full-time side object presence indicators) |
Passed All (3) | Passed All (2) |
| Multiple Threats (MT) (Ensures that the IVBSS system recognizes the presence of more than one threat and can issue a timely warning based on the most serious threat) |
Passed All (2) | Passed All (2) |
| No-Warn Scenarios (Ensures that the IVBSS system recognizes when the presence of nearby vehicles and infrastructure in close proximity do not pose a threat and therefore do not require a warning) |
Passed All (8) | Passed All (7) |
The full set of test track results is available at:
www.nhtsa.dot.gov/staticfiles/DOT/NHTSA/NRD/Multimedia/PDFs/Crash%20Avoidance/2008/810952Lo.pdf.
- Testing of Options for the IVBSS Driver-Vehicle Interface:
- Conducted a set of experiments on options for delivering information to drivers to understand which offered the safest and most effective warnings that command a driver's attention yet avoid creating confusion. Five experiments were conducted in total. The textbox below provides an overview of the results.
- Published the results to assist industry development of an intuitive driver-vehicle interface (DVI) both for light vehicles and for trucks.
Overview of DVI Experiments and Results (Phase 1)
In Experiment 1, a panel of experts and lay drivers rated warning sounds on a variety of factors, including location and understandability, to help determine the best way to produce warnings that are reliably heard, differentiated, and responded to in the context of the vehicle sound environment.
Experiment 1: How does auditory warning effectiveness vary with warning sound characteristics?
- Both urgency and annoyance increase as the frequency pitch of the warning increases.
- Minor alterations to the sound characteristics of auditory icons can result in markedly different performance, but neither the addition of noise nor spatial enhancement improved the accuracy or speed of response to a warning sound.
- Reaction times increased slightly when warnings had increasing numbers of bursts, numbers of beeps in a burst, or delays between bursts.
For Experiments 2 through 5, lay drivers were placed in a simulated driving environment while a variety of events, including vehicles cutting in or lead vehicles braking, took place. Driver responses and reactions were recorded and used to address the issues outlined below.
Experiment 2: How do drivers respond to warnings?
- For all threat types and warning signals, drivers were likely to fixate on the area forward of the vehicle, even for lane change-merge (LCM) warnings where the hazard was on the side of the vehicle. There was not, however, consistency in where the drivers looked or the sequence in which they looked around.
Experiment 3: Does using a similar cue to represent more than one threat scenario improve driver response?
- No combination of threat scenarios into one or more cues led to substantially better driver responses, though drivers liked the multiple warnings for all subsystems the least.
Experiment 4: Warnings that are delayed may be more accurate. Does the tradeoff between timing and accuracy impact driver response?
- Subjects did not perceive the difference in warning delays and did not respond differently.
Experiment 5: Is there a difference in driver response to a single warning versus two warnings that are co-occurring? Co-occurring warnings were presented:
- Whenever they occurred, even if simultaneously.
- One at a time, with higher priority warnings interrupting those of lower priority.
- In sequence of occurrence, with the first warning playing to completion before the second started.
- No strong preference was shown for any distinct prioritization rule, and responding to multiple warnings tested as no different from responding to single warnings.
The full report on the experimental results and recommendations can be obtained at:
www.nhtsa.dot.gov/staticfiles/DOT/NHTSA/NRD/Multimedia/PDFs/Crash%20Avoidance/2008/DOT-HS-810-905.pdf.
Phase 2: Testing and Evaluation
Phase 2 activities began in June of 2008 and will include testing and evaluation of the integrated prototype system with a final assessment. The primary goal of the field operational test is to determine the suitability of the integrated warning system for widespread use on public roadways in both automobiles and trucks and its potential effectiveness in reducing crashes. Suitability for widespread use will be determined by the extent to which the installed systems:
- Are deemed acceptable to drivers and easy to use.
- Yield safety benefits.
- Pose minimal added risk.
The light vehicle field test will be conducted over 12 continuous months, with each driver receiving an IVBSS-equipped vehicle for a period of 40 days, allowing for a total of 108 drivers. The first 12 days of testing will collect baseline driving data—the system will collect information on each driver's driving style and not present warnings to the driver. The remaining 28 days will serve as the assessment period in which the integrated system will be fully functional and present warnings to the driver. In this manner, it will be possible to make a direct comparison between the "before and after" effects of IVBSS. Automobile drivers will use the IVBSS-equipped vehicle in place of their own vehicle.
IVBSS will be tested on trucks as part of a fleet that is operated on regular routes by drivers who volunteer to participate in the test. The truck field test will last 10 months with the first three months as a baseline data collection period (similar to the light vehicle tests), and remaining seven months will have the IVBSS system fully functional.
The current field test plan includes 108 automobile drivers and 20 truck drivers. (See Table 3.5 below for specific numbers and durations.)
| Automobiles | Trucks |
|---|---|
|
|
Research Findings and Important Results
The IVBSS prototype system design has been successfully verified using system performance tests, meeting on-road and test-track requirements.
Overall, on-road and test track test results revealed that:
- The IVBSS prototype system can arbitrate between multiple threats—the system recognized all potential crash situations successfully and produced appropriate alerts when exposed to real threats.
- The system was able to distinguish between and provide warnings for targets that posed a threat and those that did not such as bridges and other physical infrastructure features.
- The system successfully kept nuisance alerts below the maximum allowed for the system.
The IVBSS driver-interface experiments produced results that will assist manufacturers in commercializing and tailoring the Driver-Vehicle Interface (DVI) component for optimal effectiveness with drivers.
The results describe opportuintities to maximize the likelihood of prompt and correct driver actions in response to one or more crash warnings. Results showed, for example:
- In comparing the effectiveness of auditory warnings against a range of sound characteristics, tests revealed that reaction times increased slightly when warnings had increasing numbers of bursts, numbers of beeps in a burst, or delays between bursts.
- For all threat types and warning signals, drivers were likely to fixate on the area forward of the vehicle—even for lane change-merge warnings where the hazard was on the side of the vehicle. There was not, however, any consistency in where the drivers looked or the sequence in which they looked around.
- In testing how drivers responded to a single warning versus two warnings that are co-occurring, results revealed that there are no strong preferences for any distinct prioritization rule. Results also showed that there is no great difference in driver response in responding to multiple warnings from responding to a single warning.
Examples of spectific technical recommendations include38:
- Warnings should be designed to be a minimum of 80 decibels with frequencies in the 1 to 5 KHz range in order to be heard within the vehicle.
- If pulsed warnings are used, they should consist of two bursts of three beeps each, with gaps of approximately 161 milliseconds between bursts.
- No definitive conclusions could be reached on a single most effective location for a warning display in the vehicle.
- With no strong preferences for a specific type of shared warning, IVBSS will use a dual warning interface approach, providing unique auditory tones and lateral and longitudinal warnings.
- Delays of between 150 and 300 milliseconds were deemed acceptable between the onset of a threat and the presentation of a warning to the driver.
- No single rule for prioritizing between multiple warnings was recommended, though participants showed a strong desire for blind spot detection warnings to receive highest priority.
The IVBSS Initiative has taken the first steps toward enabling commercialization on IVBSS-like technologies. A set of test procedures and test results have been provided to the automotive industry and other interested stakeholders.
In April 2008, the IVBSS Initiative team held its fourth public meeting in Ypsilanti, Michigan to provide an annual progress report on the IVBSS efforts to members of the vehicle safety research community and other interested parties. The meeting focused on the results of Phase 1 activities and highlighted Phase 2 activities, including the planning and conduct of the light vehicle and heavy truck field operational tests. The meeting featured:
- Presentations on the light vehicle and heavy truck prototype system development processes, development of tests to verify prototype system performance, and results from human factors experiments conducted to guide drivervehicle interface development.
- Representatives from the National Institute of Standards and Technology (NIST) discussed the independent measurement system developed and used to collect data during the verification testing process.
- The US DOT/RITA/Volpe National Transportation Systems Center staff discussed results from test track and on-road verification testing.
- The public was able to view outdoor static vehicle displays and computer-based demonstrations of analytical tools developed during the first phase.
Details and further documentation are available at: www.itsa.org/ivbss.html. This website also provides the public and stakeholders with an archive of the critical IVBSS reports and technical papers.
The IVBSS prototype system design has been successfully verified and is ready for operational testing and evaluation under real-world conditions.
With the development of the integrated system and the DVIs, the IVBSS Initiative has completed the required research, developed a fleet of prototype vehicles, and conducted verification tests that serve as the basis for the decision to proceed with the field operational test (Phase 2).
IVBSS Roadmap
In close collaboration with the automobile industry and other stakeholders, the initiative has completed all of the Phase 1 work: the engineering design, initial prototyping, DVI design, and verification testing. Figure 3.49 illustrates the IVBSS Initiative Roadmap in 2008. The duration of the program was extended by a period of six months, from an original Phase 1 completion date of November 2007 to May 200839 to accommodate additional Phase 1 testing. The roadmap from the 2006 Five-Year Plan has been updated to account for the extension in Phase 1.
Final Steps
The IVBSS initiative team is conducting Phase 2, field testing of the IVBSS system on light- and heavy-vehicle platforms. The prototype systems will move from the controlled tests to field testing with lay drivers on public roads. Phase 2 began in June 2008; testing will be underway by early 2009. As of August 2008, the field operational test plan is complete and vehicles are being prepared. Partners have initiated building the IVBSS-equipped fleet for the test. The tests will continue through March 2010; extensive data analysis will be carried out and a report on system effectiveness and potential safety benefits is scheduled for delivery in late 2010.
The field operational test plan is available at:
www.nhtsa.dot.gov/staticfiles/DOT/NHTSA/NRD/Multimedia/PDFs/Crash%20Avoidance/2008/811010.pdf.
Over the next year, the Department will conduct public meetings and support industry executives as they consider steps toward potential commercialization, including deciding:
- Whether to include the system as a new feature on vehicle lines.
- How to most efficiently design the system into new vehicles as an integrated system versus stand-alone components.
- Whether to make the investment to tailor manufacturing processes to accommodate the incorporation of the system.
3.2.4 Clarus Initiative
The Transportation Problem
Adverse weather is associated with over 1.5 million crashes each year, resulting in over 800,000 injuries and 7,400 fatalities. Injuries, loss of life, and property damage cost an average of $42 billion annually. Drivers endure over 500 million hours of delay due to fog, snow, and ice.
Today's weather data is generally insufficient to support transportation operations and safer travel decisions—forecasts are not specific to roadway segments and current data does not characterize roadway conditions.
Yet, increasingly, our transportation and weather systems are expected to identify weather patterns and provide detailed information about the weather effects on roadway conditions. Gaining this level of accuracy is a complex but valuable investment, as it can significantly improve the caliber of site-specific, road-condition forecasts for:
- Drivers need accurate and timely alerts to avoid road hazards, leading to fewer weather-related crashes.
- Transportation agencies, which require detailed, accurate, segment-specific weather data to anticipate, observe, and manage hazardous conditions. When available, such information will significantly reduce expenses by allowing for targeted decisions on how to allocate labor, minimize use of treatments, and address hazardous areas as a priority.
- Environmental improvements, with more efficient, spot-specific road-chemical treatments during inclement weather.
Significant challenges exist in moving the industry toward greater levels of specificity:
- Road weather sensors are individually owned by a variety of organizations—State and local agencies, weather monitoring and reporting agencies, and private sector firms. There is little aggregation, integration, or data exchange to supply the detail needed to support safer travel choices at either broader, regional levels or specific, local levels.
- Data formats differ across sensor types (environmental, imaging, mobile, and remote), across organizations, and across borders. As a result, it is difficult to check the quality of the data to ensure that it is reliable and timely.
- Data is typically not readily available to forecasters.
- Existing data tends to address only general atmospheric conditions and not specific roadway information.
The ITS Opportunity
The Clarus Initiative is based on the premise that the integration of a wide variety of weather observing, forecasting, and data management systems, combined with robust and continuous data quality checking, can serve as the basis for timely, accurate, and reliable weather and road condition information. When disseminated to a wide audience of users, use of this real-time information will impact decisions by both drivers and transportation operators and alleviate the safety and congestion effects of adverse weather.
The Clarus system will offer a one-stop, Internet-based portal for all surface transportation environmental observations, allowing users to tap into the system for easy access to the data. Three critical features make Clarus information unique and separate from other forms of weather information available on the market today:
- Transportation-related. Clarus specifically provides information related to roadway conditions.
- Level of detail. With the ability to gather data from a vast array of sensors, the Clarus system enables service providers to generate and deliver targeted and route-specific information.
- Quality Control. Clarus performs comprehensive data-quality checks.
Clarus Initiative Approach
To provide anytime, anywhere road-weather information, the Clarus Initiative will:
- Build a coalition of federal agencies responsible for weather forecasting (e.g., the National Atmospheric and Oceanographic Administration NOAA's National Weather Service NWS among others) and private industry, and together design a national network.
- Create a Nationwide Surface Transportation Weather Observing and Forecasting System (the Clarus system) by connecting a wide variety of sensors owned and operated by Federal, State, local, and private partners, thereby leveraging the collective investments that agencies have made in road-weather information systems.
- Develop and offer a method for robust data integration, quality checking, and dissemination.
- Demonstrate and evaluate the ability of the Clarus system to provide near real-time, quality-checked atmospheric and pavement observations.
- Facilitate access to and effective delivery of road-weather information to a wide audience of customers who require it for a wide range of uses—for instance, truck and fleet logistics planning, daily work commutes, event planning, and many more.
Accomplishments to Date
- Worked in partnership with agencies to connect existing sensors into a nationwide network that is now generating and delivering Clarus data.
- Developed an innovative method for robust data assimilation, quality checking, and data dissemination that can provide near real-time atmospheric and pavement observations from existing technologies.
- Developed easy, web-based accessibility to the Clarus data through tools such as the Clarus website.
- Developed three initial Concepts of Operation that describe how Clarus data could be used to deliver transportation and weather-related services to support improved operations by public sector agencies. Three multi-State teams comprised of thirteen States and three Canadian provinces participated.
- Conducted proof-of-concept testing to evaluate the ability for data exchange for surface environmental data and relevant surface transportation conditions.
Clarus Initiative Results to Date
Clarus is able to aggregate, integrate, and exchange data.
- Results from the multi-State proof-of-concept tests show that the Clarus system is able to successfully exchange and incorporate data from multiple sources and to provide data and observations to the Internet.
- The Clarus system dissolves boundaries between States and operating agencies to provide crossjurisdictional road weather observations, making corridor operations and travel safer and more efficient.
Clarus provides accurate, quality data.
- Clarus offers state-of-the-art, active, quality checking of data in real-time. It is a first-of-a-kind system that runs nine separate quality checks on at least 20 different types of data such as pavement temperature, atmospheric pressure, precipitation start times or amounts, freezing points, or visibility, among others. The Clarus system utilizes the full suite of "metadata"—information and details about the sensor site itself, the sensor hardware/software, and sensor operations—that provides a baseline from which to check the quality of the active data.
State and local agencies that have connected to Clarus are recognizing the benefits. Agencies report:
- It is easier to monitor the health of their ESS networks, as operators can identify when the network is down or isolate equipment failures and send maintenance crews out for targeted repairs.
- Operators have gained access to road weather observations from the entire Clarus network—multi- State data enables operators to watch the weather approach and know with greater levels of precision how the weather will impact roadway conditions and traffic conditions.
- Decision-makers benefit from the new tools, techniques, and improved forecasts enabled through the Clarus system. For instance, Clarus data greatly enhances the capabilities of agency tools such as the Winter Maintenance Decision Support System (MDSS).
- Agencies find that Clarus offsets the deployment costs of new Environmental Sensor Stations (ESS). By integrating observations from other surface observation sources with their own data, Clarus acts as an "asset multiplier"—leveraging the investments of agencies and providing a broader and richer source of weather data.
There is growing interest in connecting to Clarus.
- To date, 19 States and three Canadian provinces connect their sensor networks and provide data to Clarus.
- Clarus has created the opportunity to expand beyond domestic borders to successfully exchange international road weather data and leverage funding to share in the development of road weather information systems across national borders.
The Problem
Weather severely impacts roadway capacity and traffic flow. Bad weather increases congestion, leads to crashes, and can close down roads altogether. Regional weather predictions currently lack specificity with respect to road conditions, making it difficult for drivers to postpone or reroute their travel to try to avoid the worst road conditions
According to the Transportation Research Board's report Where the Weather Meets the Road — A Research Agenda for Improving Road Weather Services,40 weather has a severe impact on transportation:
- Adverse weather is associated with over 1.5 million motor vehicle crashes each year, resulting in over 800,000 injuries and 7,400 fatalities.
- The injuries, loss of life, and property damage caused by weather-related crashes cost an average of $42 billion.
- Drivers endure over 500 million hours of delay due to fog, snow, and ice.
Today's weather data is generally insufficient to support transportation operations and safer travel decisions. While weather observations are plentiful, they are not often integrated to form a coherent picture that is useful for transportation system operators and drivers, nor are they available as current or predicted information on specific road segments. Such information could play a critical role in helping both drivers and transportation agencies make decisions that would significantly alleviate weather-related safety problems.
Increasingly, our transportation and weather systems are expected to identify weather patterns and impacts and provide information in much greater detail and at multiple levels of detail:
- At broader, regional levels—providing macro-level information (forecasts that cover tens of miles and reflect longer corridor conditions such as interstate trucking routes); or meso-information (forecasts covering miles that usually relate to commuter driving patterns during rush hours).
- At specific, local levels—providing microclimate (i.e., less than a mile) information which reports at the sub-mile level (forecasts that identify when bridges ice over or drifting snow covering sections of the pavement).
Gaining this level of accuracy is a complex but a valuable investment, as it can significantly improve the caliber of site-specific, road-condition forecasts for:
- Drivers who are alerted, in an accurate and timely manner, to specific road hazards, leading to a reduction in crashes and fatalities.
- Transportation agencies that can reduce expenses by using the information to make targeted decisions on how to allocate labor, minimize use of treatments, and address hazardous areas as a priority. When used in conjunction with tools such as the Winter Maintenance Decision Support System (MDSS—see section 3.4.4 for more detail), Clarus data results in optimal local decision making.
- Environmental improvements, with more efficient, spot-specific road-chemical treatments during inclement weather.
Weather reporting at this level can revolutionize the way that road-weather conditions are measured and monitored, and the way that drivers use the information to make better and safer travel choices. Yet significant challenges exist in moving the industry toward greater levels of specificity:
- Road weather sensors are individually owned by a variety of organizations—State and local agencies, weather monitoring and reporting agencies, and private sector firms. There is little aggregation, integration, or data exchange to supply the detail needed to support safer travel choices at either broader, regional levels or specific, local levels.
- Data formats differ across sensor types (environmental, imaging, mobile, and remote), across organizations, and across borders. As a result, it is difficult to check the quality of the data to ensure that it is reliable and timely.
- Data is typically not readily available to forecasters.
The ITS Opportunity
With the ITS data generated through the integration of transportation and weather technologies, the ITS Program and its partners can revolutionize the way that road-weather conditions are measured and monitored, and the way that drivers use the information to make better and safer travel choices.
The Clarus Initiative is based on the premise that the integration of a wide variety of weather observing, forecasting, and data management systems, combined with robust and continuous data quality checking, can provide timely, accurate, and reliable weather and road condition information. When disseminated to a wide audience of users, use of this real-time information will impact decisions by both drivers and transportation operators, and alleviate the safety and congestion effects of adverse weather.
What Is "Clarus"?
Clarus is a Latin word that translates to "clear". The objective of the Clarus Initiative is to provide clear, relevant information on roadway conditions to all transportation managers and users to alleviate the effects—fatalities, injuries and delays—of adverse weather conditions.
Clarus is an open-source system that connects road and weather observation sensors into a unified network. The network feeds data into the Clarus system—a one-stop, Internet-based portal for all surface transportation environmental observations. The network feeds raw data in many formats into the system which then:
- Transfers the data into one common format with full "metadata"—the data that describes critical details associated with the sensors and the sensor sites, for instance, the sensor's latitude and longitude or the type of sensing (imaging versus mobile) provided by the sensor. Having metadata, in addition to road-weather data, provides a baseline from which the Clarus system's quality checking can identify sensor problems and error and environmental variations.
- Allows users to tap into the system for easy access to the data with a wide array of data retrieval capabilities to make effective use of the data. The system also manages user's rights to input or extract specific data components.
- Provides standardized output—data with no post-processing—that is ready for incorporation into value-added products such as weather and traffic models, or operations decision support systems.
Three critical features make Clarus information unique and separate from other forms of weather information available on the market today:
- Transportation-related: Clarus specifically provides information related to roadway conditions.
- Level of detail: With the ability to gather data from a vast array of sensors, the Clarus system enables service providers to generate and deliver targeted and route-specific information.
- Quality control: Clarus performs one of the most comprehensive data quality checks of all the road-weather data systems available today.
The Clarus Approach
The Clarus Initiative aims to demonstrate and evaluate the value and impact of an integrated system of weather networks capable of providing "anytime, anywhere road weather information" that is:
- Provided by multiple sources in both the public and private sectors, including transportation agencies, traveler information agencies and firms, and weather organizations.
- Used by a wide audience of transportation users and operators, including drivers.
- Accurate and reliable with continuous data quality checking.
To provide anytime, anywhere road-specific information, the Clarus Initiative was structured to create a Nationwide Surface Transportation Weather Observing and Forecasting System (the Clarus system) that:
- Connects a wide variety of sensors owned and operated by the partners, thereby leveraging the collective investments that agencies have made in road weather information systems and that include environmental sensor stations (ESS) and mobile observations from Automated Vehicle Location (AVL) equipped trucks. Eventually, the Clarus system will incorporate data generated by passenger vehicles equipped with transceivers that are part of the VII proof-of-concept tests.
- Provides near real-time atmospheric and pavement observations.
- Facilitates the access to and effective delivery of road-weather information to a wide audience of customers who require it for a wide range of uses—for instance, truck and fleet logistics planning, daily work commutes, event planning, traffic operations and maintenance, and many more.
- Offers a method for robust data integration, quality checking, and dissemination.
Track 1: Stakeholder Coordination
The Clarus Initiative took a three-track approach in creating, demonstrating, and testing the Clarus system and concept:
- Promote multilateral stakeholder ownership by building consensus in design and building partnerships to provide nationwide connections to sensor systems.
- Establish a working partnership with NOAA.
- Create the Initiative Coordinating Committee.
Partnerships Are Critical to Successful Technical Integration
Deploying a national road weather observational network has required a multiyear effort to build consensus across the transportation and weather communities to collaboratively design, build, test, and evaluate the system components. The Clarus Initiative is a partnership of:
- Federal agencies responsible for weather forecasting, such as the National Atmospheric and Oceanographic Administration's (NOAA) National Weather Service (NWS).
- State and local transportation agencies.
- Private industry, such as radio, television, and internet weather providers.
This partnership is known as the Clarus International Coordinating Committee (ICC) and, in effect, defines the content, extent, and capability of a nationwide road-weather observation network in that each of these partners offers access to a variety of data. The ICC will ultimately provide the path to transition Clarus into nationwide use.
Private sector involvement is critical to the initiative's success. With the launch of the Clarus system and the availability of consistent quality data, market opportunities open up to develop new decision support products, information delivery products, or even information content products. Finally, in working to overcome data sharing barriers, it is expected that national companies whose customers do not think in terms of political boundaries will be encouraged to develop new and enhanced services to better serve their customers.
ITS Standards in Use with Clarus
- Environmental Sensor Stations (ESS)
- Weather Report Message Set for ESS
- NTCIP Application Profile—XML in Center-to-Center Communications
- NTCIP Generic Reference Model (GRM) for Center-to-Center Communications
- Standard for Functional Level Traffic Management Data Dictionary (TMDD)
- Message Sets for External TMC Communication (MS/ETMCC)
- NTCIP Application Profile for Data Exchange ASN.1 (DATEX)
- NTCIP Application Profile for Common Object Request Broker Architecture (CORBA)
- Message Sets for Advanced Traveler Information System (ATIS)
- Dedicated Short Range Communications (DSRC) standards
Track 2: System Design
- Develop a generic Concept of Operations, system requirements, and engineering plans that will guide State and local implementation and that can be customized to meet State and local needs and circumstances.
- Identify technical, institutional, and policy constraints and barriers.
- Integrate State road weather data with NOAA data.
- Conduct proof-of-concept testing to ensure that the system components operate and interface properly.
The Clarus system Concept of Operations, requirements, system design documents, and test plan can be found on the Clarus Initiative website at: http://www.clarusinitiative.org/Archive.htm.
To integrate the wide variety of data, sensors, and networks (Federal, State, local, and private sector) into a Clarus system, many of the ITS Standards are employed (see list in side textbox), creating an open platform that allows for:
- Seamless data exchange and interoperability among the various sensors and networks.
- The ability for future innovations and technologies—those not yet envisioned by agencies or private sector companies—to easily connect and provide new services.
Clarus Provides An Open, Flexible System Design
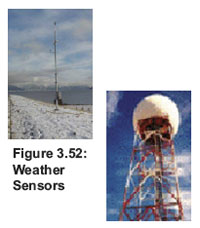
The Clarus system is created as an open-source system with a design that is flexible, to accommodate current observational techniques as well as emerging vehicle-based and remote sensing technologies. The basic components of a road-weather-reporting system exist—about 2,500 sensors monitor road-weather conditions across the country. The Clarus system effectively integrates the following technologies into a networked system:
- Environmental Sensor Stations (ESS) — An ESS is a fixed roadway location with one or more sensors measuring atmospheric, surface (i.e., pavement and soil), and/or hydrologic (i.e., water level) conditions. These stations are typically deployed as field components of Road Weather Information Systems (RWIS), the Automated Surface Observing System (ASOS), or the Automated Weather Observing System (AWOS). Data collected from environmental sensors in the field are stored onsite in a Remote Processing Unit, which transmits environmental data to a central location via a communication system. Central RWIS hardware and software collect field data from numerous ESS, process data to support various operational applications, and display or disseminate road weather data in a format that can be easily interpreted by a user.
- Remote Sensing Technologies — In remote sensing, a detector is located at a significant distance from a target. The sensor is typically part of a radar or satellite system used for surveillance of meteorological and oceanographic conditions. Images and observations from remote sensors are used for weather monitoring and forecasting from local to global scales. Remote sensing is used for quantitatively measuring atmospheric temperature and wind patterns, monitoring advancing fronts and storms (e.g., hurricanes, blizzards), imaging of water (i.e., oceans, lakes, rivers, soil moisture, vapor in the air, clouds, snow cover), as well as estimating runoff and flood potential from thawing.
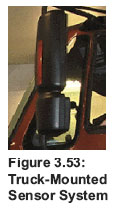
- Mobile Sensing Technologies — Mobile sensing involves the integration of environmental sensors with vehicle systems. In combination with global positioning system (GPS) technologies, truck-mounted sensor systems can be utilized to sense pavement conditions (such as temperature, friction) and atmospheric conditions (such as air temperature). Mobile sensing is not an active component of Clarus data collection today. However, as VII and SafeTrip-21 are implemented, new sources of data will become available; the Clarus system is designed to evolve and incorporate these and other mobile sources.
Track 3: Multi-State Regional Demonstrations
Track 3 employs an evolutionary path to testing, evaluation, technology transfer, and commercialization of Clarus. The Clarus Multi-State Regional Demonstrations is a three-phased effort designed to achieve the following objectives:
- Demonstrate that the Clarus system functions as designed—incentivize a large number of State (or Provincial) and local agencies to contribute data from their ESS networks.
- Enable proactive transportation system management through use of the Clarus system.
- Provide an environment for the private sector and academic organizations to innovate and create new and improved services that will benefit the public (both government and travelers), academia and the entire weather enterprise.
Track 3 / Phase 1:
The first phase of the Clarus Multi-State Regional Demonstrations was launched during the fall of 2006 with a Request for Applications (RFA) for State DOTs to contribute their ESS data and metadata to the Clarus system and to document their needs (for new products, techniques, etc.) for a new set of transportation-weather services. Three multi-state teams were chosen:
- The Alaska/Canadian (ALCAN) Team
- Lead Agency: Alaska Department of Transportation and Public Facilities
- Agency Team Members: Alaska, Yukon Territory, British Columbia, and Alberta
- The Aurora Team
- Lead Agency: Iowa Department of Transportation
- Agency Team Members: Iowa, Illinois, Indiana, and Ohio
- The Northwest Passage Team
- Lead Agency: South Dakota Department of Transportation
- Agency Team Members: South Dakota, North Dakota, Minnesota, Wisconsin, Montana, Wyoming, Idaho, and Washington State.
Their Concepts of Operations can be found at:
www.clarusinitiative.org/regional.htm.
In addition to the development of Concepts of Operation, the creation of the three teams allowed for proof-of-concept testing of the Clarus system. Results from the multi-State proof-of-concept tests show that the Clarus system is able to successfully exchange and incorporate data from multiple sources and to provide data and observations to the Internet.
Also, the Clarus system dissolves boundaries between States and operating agencies to provide cross-jurisdictional road weather information, making corridor operations and travel safer and more efficient. With this initial success, 16 additional States have connected for a total of 19 States and three Canadian provinces that connect their sensor networks and provide data to Clarus. See Figure 3.54 for an illustration.
Track 3 / Phase 2:
The second phase of the Clarus Multi-State Regional Demonstrations began during the summer of 2007. This phase, the Connection Incentive Program, provides grants to public transportation agencies to assist them in connecting to the Clarus system. Funding from the grants can be used, with FHWA approval, for expenses associated with metadata collection or for software or hardware changes needed to connect to the system. Agencies will be able to participate in this phase (and apply for grants) through September 2008.
Track 3 / Phase 3:
The third phase is specifically focused on the development and deployment of Clarus-enabled services. Within the Track 3/Phase 1 Concept of Operations, a set of use case scenarios were defined, identifying the prospective services and applications that could use Clarus to improve agency operational efficiency, streamline decisions and procedures, and target hazardous conditions during adverse weather to improve safety. Use cases have been developed for a range of public sector needs such as maintenance and construction operations, traffic operations, and traveler information. Three use cases are presented as examples on the following pages.
To advance the development of new Clarus applications and services, a Request for Proposals was released in Spring 2008 to engage the private sector and academia. In addition to development and implementation activities, awardees will document their experiences in accessing and using the Clarus system and Clarus data, providing further insight into potentially new system uses or whether further modifications are necessary.
Research Findings and Important Results
The Clarus Initiative validated that the Clarus concept works—the Clarus system is capable of aggregating, integrating, and exchanging data among multi-State networks.
- Results from the multi-State proof-of-concept tests show that the Clarus system is able to successfully exchange and incorporate data from multiple sources and to provide data and observations to the Internet.
- The Clarus system dissolves boundaries between States and operating agencies to provide cross-jurisdictional road weather information, making corridor operations and travel safer and more efficient.
Clarus provides accurate, quality data.
Clarus offers state-of-the-art, active, quality checking of data in real-time. It is a first-of-a-kind system that runs nine separate quality checks on nearly 20 different types of data (e.g., pavement temperature, atmospheric pressure, precipitation start times or amounts, freezing points, or visibility, among others). The Clarus system is able to do full quality checking with access to the full suite of "metadata"—information and details about the sensor site, the sensor hardware/software, and sensor operations—that provides a baseline of information from which to check the active data.
Clarus Use Case Scenario Examples
Winter and Non-Winter Maintenance and Operations Decision Support
The Clarus Initiative efforts aim to take a broader look at expanding decision support activities. For instance, Clarus data can be used to assist in such decisions as:
- Road maintenance scheduling decisions, especially those activities that affect traffic flow and mobility (e.g., lane closures for striping or pothole filling).
- Construction-related scheduling decisions such as for applying pavement applications or curing concrete.
- Winter maintenance operations and decision support.
Specifically, the Winter Maintenance Decision Support System (MDSS) offers an example of how Clarus data can be combined with other weather, route, and local information for use as decision support to efficiently allocate resources and prioritize and target dangerous roadway segments. MDSS takes forecast data on weather and pavement conditions and customizes it for task planning and for scheduling transportation agency personnel for operations, year-round maintenance, and construction. Documentation and source code for the Winter MDSS can be found at the National Center for Atmospheric Research (NCAR) Web site at www.rap.ucar.edu/projects/rdwx_mdss/.
Enhanced Road Weather Content for Traveler Advisories
Enhancing road-weather content is focused on two needs:
- The limitations of agencies to access information across borders and exchange information with adjacent states.
- The opportunity to improve content related to both public and private sector needs:
- Public sector needs for postings of road-weather advisories on such ITS technologies as dynamic message signs (DMS), highway advisory radio (HAR) broadcasts, or 511 telephone services and related web sites.
- Private sector business-to-traveler information services solutions that can provide road-weather advisories directly into vehicles and tend to make use of in-vehicle navigation systems, radio subscription services (such as satellite radio), mobile technologies (e.g., cell phones, PDAs, or text messaging), or push technologies (e.g., RSS or emails).
Clarus does not change the framework of any of the existing traveler information systems; instead, Clarus facilitates the pooling of informational resources already in use. Clarus also provides broader accessibility of improved data by each service provider to be able to deliver enhanced, spot-specific advisories and forecasts over the width of a corridor (for instance, being able to target a segment of the interstate and deliver route-specific weather forecast information, road condition data, and actual atmospheric and pavement conditions and advisories).
With enhanced data, new services and tools could be implemented by either the public or private sector. For instance:
- 511 providers can enhance their current data with road weather content using ESS and target specific routes with road condition information.
- Regional traveler alert systems become more robust as more channels offer targeted road-weather content such as mobile technologies, Dynamic Message Signs, or Highway Advisory Radio.
- Public transportation agencies can create road weather coordination messages or advisories specific to emergency managers, state police and first responders, needs.
Curt Pape
Road Weather Information
System Coordinator
Minnesota Department of Transportation
Multi-State Control Strategy
The use of control strategies (e.g., lane/road/bridge closures, contra-flow operations, detours, etc.) is a common process for transportation agencies when road conditions deteriorate during adverse weather. However, experience has proven that closing a road along a transportation corridor at or just beyond the border of the next State can result in significant impacts on transportation agencies along with potential hardships on travelers.
There is a well-documented need for improved coordination within states as well as with adjacent states with respect to the imposition of controls and dissemination of associated advisories. These actions can result in significant travel impacts as traffic stalls in areas that are not well prepared to handle the influx of stranded motorists. The development of a timely process to communicate changes in road status would permit officials in adjacent areas the opportunity to take proactive steps to mitigate the impact on travelers. Such actions could include rerouting travelers prior to a blockage in areas that have better infrastructure to handle lodging, fueling and dining.
Transmitting such information requires a common repository or data warehouse where the information from all jurisdictions can be stored and made available for posting to appropriate channels for information dissemination. Parties interested in accessing this information include transportation agencies, law enforcement agencies, fleet managers, travelers, and traveler-related interests.
The Clarus system offers an existing data management system that currently houses the weather and road-condition information that triggers the use of control strategies during adverse conditions. If combined with a system for communicating control strategies, agencies would have a decision support tool that operates within and across multiple states or provinces in a timely manner. Some potential scenarios could include:
- During winter storms, Clarus ESS data would provide information about freezing pavement temperatures while road condition data would provide information about pavement conditions and mobility. Resulting recommendations might be to suggest tire controls (e.g., snow tires, chains).
- During rain events, Clarus ESS data would provide information about rainfall intensity or flooding while road condition data would provide information about resulting closures of roads or bridges.
- During high winds, Clarus ESS data would provide information about strong crosswinds along interstates or bridges. Road condition data would provide information about wind buffeting on high profile vehicles which could lead to travel restrictions on bridges.
Research Findings and Important Results
Agencies report:
State and local agencies that have connected to Clarus are recognizing the benefits.
- It is easier to monitor the health of their ESS networks, as operators can identify when the network is down or isolate equipment failures and send maintenance crews out for targeted repairs.
- Operators have gained access to road weather observations from entire Clarus network—multi-State data enables operators to watch the weather approach and know with greater levels of precision how the weather will impact roadway conditions and traffic conditions.
- Decision-makers benefit from the new tools, techniques, and improved forecasts enabled through the Clarus system. For instance, Clarus data greatly enhances the capabilities of the Winter Maintenance Decision Support System (MDSS).
- Agencies find that Clarus offsets the deployment costs of new Environmental Sensor Stations (ESS). By integrating observations from other surface observation sources with their own data, Clarus acts as an "asset multiplier"—leveraging the investments of agencies and providing a broader and richer source of weather data.
Private sector traffic and weather providers are increasingly integrating road-weather data into their predictive algorithms that drive their forecasts, as weather is a critical element in traffic mobility, safety, and congestion.
Improved information from Clarus is expected to expand this market and provide greater accuracy and timely and spot-specific information.
"Clarus is an integrated road weather observing system that can save lives on our nation's highways."
Ray Ban
Executive Vice President
Meteorology
The Weather Channel
There is growing interest in connecting to Clarus.
- To date, 19 States and three Canadian provinces (Alberta, British Columbia, and Yukon) connect their sensor networks and provide data to Clarus.
- The strong working relationship with NOAA has resulted in a plan for integrating road weather data into future nationwide observation systems.
- Private sector weather forecasting and information providers are finding Clarus easy to connect with and are using Clarus data.
Clarus delivers innovation.
- Clarus employs the most advanced use of quality checking algorithms to ensure the best quality road weather (pavement-specific) observations ever.
- Clarus has demonstrated the feasibility of international data exchange and the shared development of road weather information systems.
Clarus Roadmap
The Clarus Initiative is on schedule. As the roadmap in Figure 3.55 below illustrates, the Clarus Initiative has worked in close collaboration with the weather forecasting industry, the private sector, and other stakeholders to substantially complete Tracks 1 and 2, with a few remaining ongoing activities, such as stakeholder engagement and finalization of system Concepts of Operations. The best concepts and lessons learned formed the bases of Track 3 Regional Demonstrations. Within Track 3, Phases 1 and 2 of Track 3 are moving forward and Phase 3 is being launched in October 2008.
Final Steps
The Clarus Initiative is on schedule for completion in 2010. In October 2008, awards for Track 3 will be announced; work with private sector and academic organizations will commence to build applications for the public sector services that improve transportation operations and safety. An independent evaluation will be conducted to identify measurable evidence showing an improvement to some aspect of road weather forecasting as a result of these services and applications.
Steps Toward Technology Transfer and Commercialization
The following activities comprise the final and key steps in deploying the Clarus system for the Nation:
- Transition to NOAA. NOAA's National Weather Service operates the Meteorological Assimilation Data Ingest System (MADIS), an extensive ground, aviation and upper air, and maritime weather observation network. The capabilities of the Clarus system will be merged with MADIS which offers the charter and capacity to integrate the breadth of the Clarus surface-observing systems and to disseminate the data to the weather and transportation communities at large. Clarus complements and supplements MADIS; Clarus brings to MADIS broader, richer transportation data and additional sources of environmental data. Clarus also offers a more demanding set of surface transportation metadata and has additional quality checking capabilities. The transition is expected to begin in the 2010-2011 time period.
- Expansion of Clarus Participation. The Clarus Initiative continues to work with State and local Departments of Transportation (DOTs) to connect their networks to the system. In June 2007, the ITS Program and the FHWA initiated the Clarus Connection Incentive Program (CIP) to incentivize more State participation with the goal of connecting with 33 States by 2010. The CIP provides grants to agencies to participate in the Clarus regional demonstration. Funding is available to assist in offsetting the cost that enables the State Road Weather Information System (RWIS) Environmental Sensor Station (ESS) networks to be connected to the Clarus System.
- Continued Clarus research. The Clarus Initiative has the opportunity to investigate the potential of mobile sensors—sensors on the vehicle—to capture real-time weather observations and road conditions. Data at this level does not exist today—it is highly local and time and space specific. For instance, mobile sensors on a truck moving through Utah's mountain passes at 11 p.m. may be able to reveal, with great accuracy, the weather and roadway conditions and alert system operators and other drivers to dangerous conditions. To test the capability of mobile sensors, initial data collection is proceeding in conjunction with the VII proof-of-concept tests. Vehicles include maintenance fleets, trucks, and passenger vehicles equipped with GPS and on-board sensors that provide weather-related data (see diagram 3.56). Analysis of this data will determine if mobile sensors can be used to provide quality weather information. As a close working partner, NWS is very interested in the quality of data and the ability to identify whether mobile sensors could be a quality and robust source of meteorological phenomena as they begin to develop.
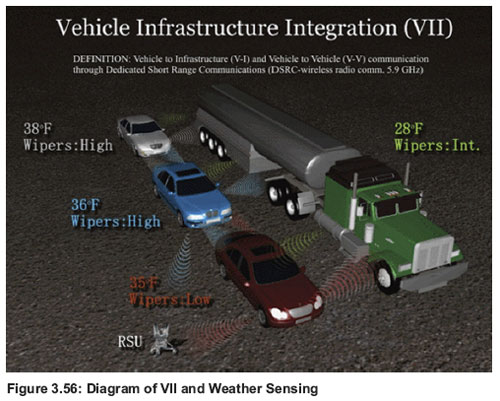
- Integration with other ITS systems. As the system expands, the Clarus Initiative team is anticipating how Clarus data will support a variety of other intelligent solutions such as VII, 511 traveler information systems, and advanced Traffic Operations Centers.
- Promotion of wider use. As the Clarus System has successfully met the goals for data processing, incorporating approximately half of the nation's Environmental Sensor Station data from State DOTs, the ITS Program and FHWA are embarking on efforts to promote wider use of Clarus data. This directly fits with the initiative's goal of making quality-check observations widely available, but in particular, to target public and private weather service providers and the traveler information community and enable the development of a wide range of value-added road weather information products for the breadth of transportation users and operators. The textbox on the next page provides a description of how one private sector company is moving forward using Clarus data in their applications. Additional promotional efforts will include a variety of outreach activities such as exhibiting and presenting papers at transportation and weather events, publishing and distributing flyers and other promotional materials, and reaching out to these communities via the web. Planned efforts to broaden Clarus exposure include funding projects within the academic community and giving graduate students the opportunity to explore new and innovative uses of the data.
Safer Travel Decisions—Baron Services and XM Satellite Radio Partnership Utilizes Clarus Data for an In-Vehicle, Real-Time Weather Product
A key strategy for the success of the Clarus Initiative is the wider use of Clarus data by private sector weather and travel information providers so that road-specific information can be used in products developed to benefit travelers. Frequently, this means getting the road-weather information into the vehicle. Market-based service providers offer the most direct access to travelers through such avenues as GPS Navigation systems, radio stations, new subscriber radio services, or cell phone and PDA alerts.
One such leading-edge application that makes use of Clarus data is a product called NavWeather with Threat Matrix technology. It is produced by Baron Services and delivered directly into the vehicle through a partnership with XM Satellite Radio. Baron Services takes government-provided data from Clarus, MADIS, and other satellite, radar and pavement sources, supplements it with its own data and quality-checking measures, and combines it in custom designed, complex models to provide consumers with real-time, driver-centric weather information. The output results in simplified current/forecast weather and road condition threats, which are updated every 90 seconds and transmitted via satellite to drivers en route. The data stream includes:
- Atmospheric and road conditions that highlight and make drivers aware of current and short-term weather threats.
- Warnings and advisories, including basic NWS watches/warnings/advisories in effect.
- Weather-related road closures.
In particular, the road conditions are derived from Baron Service's high-resolution Roadway Modeling System. The resulting display is a consumer-friendly, simple analysis of the current road state, such as wet, flooded, icy, or snow-covered. Although the result is simple, the process by which it is derived, the Baron Threat Matrix analysis, is comprehensive and utilizes cutting-edge technology. One of the key ingredients is Clarus data, which is used by Baron Services in two ways—to bias-adjust its high-resolution Roadway Modeling System with actual surface data, and as a quality-control measure for the company to evaluate the accuracy of its product.
Using the GPS capability of in-vehicle navigation systems, NavWeather can tailor information to the specific 7-kilometer region where the driver is currently located. The inclusion of road condition information in NavWeather is the first-ever application of such data being sent directly to the vehicle, and is an example of the innovative new weather services that may be developed through use of Clarus data. With such specific, road-segment information drivers have the information needed to make sound weather-related driving decisions. (Graphic below illustrates the in-vehicle capability of the Baron-XM partnership.)
Baron Services represents the post-research phase of the Clarus Initiative—putting Clarus data into use and operations. Other private sector firms are moving forward with plans to incorporate and use Clarus data in a similar fashion.
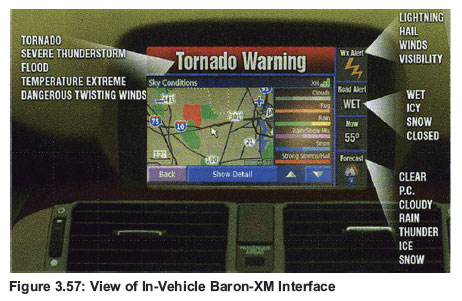
3.2.5 Integrated Corridor Management Initiative
The Transportation Problem
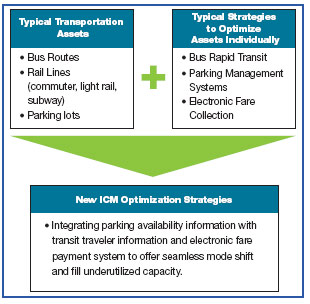
Our nation's transportation corridors are one of our greatest economic assets, providing the most efficient means for moving people and goods. They link commuters and consumers with residential areas, business centers, sports arenas, tourism, and shopping areas and provide commercial vehicles with the most direct path to move from origin to destination. The greatest congestion often occurs along our Nation's most critical corridors, resulting in decreased productivity and increased safety problems for travelers:
- Congestion and Safety Problems:
- Businesses lose approximately $200 billion per year due to freight bottlenecks.
- Drivers annually waste nearly 4 billion hours and more than 2 billion gallons of fuel in traffic jams.
- Beyond the economy and the environment, congestion increases the risk of traffic accidents and incident responders are delayed due to the heavy traffic increasing risks of secondary accidents.
- Underutilized Capacity: During peak-hour traffic, typical management strategies often do not enable the full use of parallel or adjacent routes, single occupant vehicles (SOV), less-than-full transit vehicles, and/or suboptimized transit routes. Similarly, freeways, arterial roads, and transit services in the opposite direction of peak-hour traffic often have excess capacity.
Fragmented system operations add to these problems. Despite the growth in ITS around the Nation, agencies need to integrate their systems to provide greater multimodal capacity. Additionally, agencies need to integrate their systems across jurisdictions to ensure that individual strategies for optimal flow and capacity within one jurisdiction do not conflict or hamper another jurisdiction's strategies.
The ITS Opportunity
ITS offers two important opportunities:
- The opportunity to take existing transportation and ITS assets within a corridor and integrate them into multimodal systems that allow agencies to collaboratively and dynamically manage and operate their individual assets.
- The opportunity to develop a set of integrated corridor management (ICM) strategies that, when applied, lead to optimal corridor traffic flows and management. Agencies can derive the most effective ICM strategies by collaboratively modeling their corridor with surrounding jurisdictions and inputting data on the real-time status of transportation and ITS assets (for instance, Is the bus on time or delayed in congestion? What is the real-time demand for use of the highway?). Once all assets are incorporated, a process of analysis, modeling, and simulation, or the AMS approach, is applied to explore how different strategy combinations may affect a corridor's flow and to identify where unused or underutilized capacity may exist. The graphic above provides an example of assets and strategies in the top row; once combined into ICM strategies, an agency can gain even greater operational efficiencies and make the most optimal use of their major corridors. Ultimately, the AMS approach will be used by agencies to analyze, model, or simulate multimodal conditions in real-time in order to assist operators in making decisions that provide for the maximum mobility at all times.
ICM Initiative Approach
The ICM Initiative selected eight Pioneer sites located throughout the Nation to demonstrate the ICM concept. One site with significant existing archived ITS data has provided the baseline data for laboratory testing of the ICM concept. Seven additional sites (eight in total) have developed local ICM Concepts of Operations and Requirements, and will further integrate their assets into multimodal networks.
The ICM Initiative approach also includes an adaptation of commercial off-the-shelf modeling software packages to create the capability needed to model the complex combinations of multimodal and integrated systems strategies (known as the analysis, modeling, and simulation AMS approach). Using their integrated networks, the Pioneer sites will generate corridor data and apply the AMS approach to derive the most effective ICM strategies, given their existing investments, demographics, and land use patterns.
Three of the sites will be selected to apply and validate the ICM strategies under real-world conditions. These demonstrations will also provide the opportunity to evaluate the use of the AMS approach as a tool for optimizing everyday operations. Resulting enhancements and modifications to the modeling packages will be provided back to industry for incorporation into commercial products.
Accomplishments to Date
- Developed a generic ICM Concept of Operation and defined a set of performance measures for assessing the impact of ICM strategies when they are applied in real-world operations. Measures include: mobility (travel time and travel time reliability), safety (incident management response time), fuel consumption, and emissions.
- Partnered with eight metropolitan sites to develop their own ICM Concepts of Operations that reflect the unique characteristics of demand, geography, and land use patterns of their corridors.
- Developed the AMS approach by enhancing the capabilities of commercial off-the-shelf transportation modeling packages with new features. The enhancements deliver new modeling capabilities that can incorporate multimodal and integrated corridor systems and can model combined strategies.
- Tested the AMS approach using archived data. The archived data was able to recreate a corridor network and reflect its traffic and transit movements. The AMS approach was able to model, for the first time, individual strategies in combination with each other to identify the most optimal combinations, synergies, and benefits. Additionally, the AMS approach enabled the capability to model mode shift, tolling/HOT lane/congestion pricing, and traveler response to traveler information, capabilities not previously available as part of transportation modeling packages.
- Using the test results, defined a set of ICM strategies. In laboratory testing, these strategies show an improvement in operational efficiencies of corridor networks; accommodate and promote route and mode shifts; and manage, in real-time, the corridor capacity in relationship to demand for both short-term and long-term effects.
Initiative Results to Date
The ICM Initiative validated that the AMS approach works and, in doing so, validated the ICM concept.
- The AMS approach integrated existing transportation models, providing transportation professionals with the ability to model, for the first time, integrated corridor management strategies and to understand the most optimal combinations of strategies.
- The preliminary AMS test helped identify and address key gaps in existing modeling approaches, specifically developing the capability to model traveler response to travel information, effects of variable pricing and High Occupancy Toll (HOT) lanes, and ability to promote mode shift.
- The test corridor modeling validates the ICM concept and illustrates that dynamically applying ICM strategies in combination across a corridor has great potential to reduce congestion and improve the overall productivity of the transportation system.
The ICM Initiative was able to model approaches never modeled before and understand benefits from a multimodal perspective. For instance, two significant findings from the test corridor include:
- In the presence of a major incident (i.e., when 2 freeway lanes are blocked for 45 minutes), 1 to 4 percent of travelers affected by the incident are likely to shift to transit.
- Adding a HOT lane and proactively disseminating highway traveler information are, in combination, consistently the most effective ICM investments in terms of both benefit-cost and net annual benefit.
The ICM test corridor illustrated positive effects and benefits of ICM optimization strategies:
- ICM is most effective under the worst operational conditions including heavy demand and major incidents, which represented approximately 25 percent of all commute days for the test corridor.
- AMS reveals how combinations of different strategies support each other, and therefore can provide a more optimal approach than if used alone; also how certain combinations might work in conflict with one another. For instance, the most significant benefits were derived from dynamic adjustments to the price of the HOT lane in response to changing traffic conditions. In combination with HOT, when the system provided information to direct travelers to transit and other routes, updated the ramp meters, and changed arterial signal timings, the benefits increased significantly by comparison to using each strategy individually.
The Problem
Our nation's transportation corridors are one of our greatest economic assets, providing the most efficient means for movement of freight, commuters, and consumers. They link residential areas with business centers, sports arenas, and shopping areas and provide commercial vehicles with the most direct path to move from origin to destination.
Three major issues plague our corridors:
Rapidly Growing Congestion and Safety Problems. The greatest concentration of congestion is typically found along critical metropolitan transportation corridors:41
- Businesses lose approximately $200 billion per year due to freight bottlenecks.
- Drivers annually waste nearly 4 billion hours and more than 2 billion gallons of fuel in traffic jams.
- Beyond the economy and the environment, congestion hurts safety when incident responders are delayed due to traffic and the risk of secondary accidents rises.
Underutilized Capacity. Corridors often have transportation capacity that goes unused in the form of adjacent routes, less-than-full transit, or single-occupant vehicles (SOV), parallel routes, and/or suboptimized transit routes. Also, freeways and arterial roadways have excess capacity in the nonpeak direction of traffic, and rail and bus assets.
The Vision of ICM
Imagine our nation's busiest corridors operating with truly multimodal traveler information that gives travelers actionable choices while en route; active traffic management; responsive and efficient traffic incident management; optimized traffic-signal timing, transit signal priority and managed lanes working together during peak hours for the length of the corridor. This vision is possible and will be achieved as corridors adopt and commit to ICM.
Fragmented System Operations. To date, efforts to reduce congestion have focused on managing transportation networks within corridors independently:
- Transportation assets tend to be managed locally by individual agencies on an asset-by-asset basis.
- Regional optimization strategies are often applied in a "stove-piped" manner rather than in an integrated fashion across a transportation corridor.
- Traveler information is fragmented, focused on specific segments of roadways, and not multimodal. Most traveler information systems cannot yet inform travelers of full origin-to-destination travel options based on current conditions. Travelers are frequently unaware of other, less utilized options, especially when stuck in congestion.
Despite the growth in ITS around the Nation, agencies are still in the process of integrating their systems to provide greater multimodal capabilities. Additionally, agencies need to further integrate their systems across jurisdictions to ensure that individual strategies for optimal flow and capacity within one jurisdiction do not conflict or hamper another jurisdiction's strategies.
The ITS Opportunity
ITS offers two important opportunities:
- The opportunity to take existing transportation and ITS assets within a corridor and integrate them into multimodal systems that allow agencies to collaboratively and dynamically manage and operate their individual assets as a single multimodal network. The graphic below illustrates the opportunities from integrated systems. For instance, while driving in a future ICM corridor, a traveler could be informed in advance of congestion on that route. Integrated systems would provide information on alternative travel options, using real-time data on:
- The status of traffic signals and arterial congestion on parallel routes.
- Transit status, options, and fares; the availability of parking.
- Travel times associated with the congested freeway.
- The opportunity to develop a set of integrated corridor management (ICM) strategies that, when applied, lead to optimal corridor traffic flows and management. Agencies derive ICM strategies by collaboratively modeling their multimodal, multi-jurisdictional network. With the entire corridor's assets incorporated into one model, agencies further apply the AMS approach (analysis, modeling, and simulation). The AMS approach is a new and innovative transportation modeling capability. The AMS approach delivers the ability to model combinations of assets and strategies to explore how integrated strategy combinations may affect a corridor's flow and to see where unused or underutilized capacity exists. The result of the AMS modeling is the creation of the most effective strategies that make the most optimal use of those corridor's major assets.
The graphic below illustrates the process of combining assets and strategies into ICM strategies. Examples of typical transportation assets are listed in the lefthand box. The middle box lists typical strategies that are frequently applied under individual circumstances. The far right box describes some of the new combinations that can be understood and applied as ICM strategies.
Ultimately, the AMS approach will be used by agencies to analyze, model, or simulate multimodal corridors in real-time in order to assist operators in making decisions that provide for the maximum mobility at all times. By incorporating data on the real-time status of transportation and ITS assets (for instance, Is the bus on time or delayed in congestion? What is the real-time demand for use of the highway?), agencies will be able to:
- Dynamically manage and operate their individual assets as a multimodal network of assets.
- Improve coordination of agency-specific operations—such as traffic incident management, active traffic management, work zone management, traffic signal timing, managed lanes, and real-time traveler information and provide maximum mobility at all times.
- Optimize systems to create efficiencies not currently available today, such as:
- Create a balanced, cost-effective, and efficient use of assets and modes, making better use of excess capacity.
- Balance travel demand by identifying and promoting use of alternative routes and travel options in real-time and en route.
- Provide actionable information for travelers in advance of travel conditions and real-time including updates on all transportation options for their trip, nearby transit stations, parking availability, or alternate routes.
- Provide more timely and responsive incident management capabilities.
- Improve reliability, safety, fuel consumption, and emissions along transportation corridors.
The ICM Initiative Approach
At the start of the ICM Initiative in 2005, the integrated corridor management concept faced significant challenges:
- There was little knowledge of how effective ICM strategies would be when applied under real-world conditions such as changes in weather, occurrence of incidents, varying travel demand, variances in mode usage, or basic variations in land use patterns within different jurisdictions and States.
- There were no tools available that could provide the analysis capabilities required for modeling combinations of assets and strategies.
- There were no tools that could provide agencies the visibility they need to understand the impacts of the strategies when applied.
- Decision makers were unwilling to invest in ICM strategies without some knowledge of their benefits and costs.
Faced with these challenges, the ICM Initiative designed a four-phase set of research and demonstration activities that centered on two primary objectives:
- Demonstrating the benefits of ICM strategies. The ICM Initiative has selected eight Pioneer sites located throughout the Nation to demonstrate the ICM concept (see Figure 3.60 to identify the sites). One of the sites was able to provide a set of significant existing archived ITS data as baseline data for laboratory testing of the ICM concept. All of the sites have developed their own ICM Concepts of Operations and Requirements, and are integrating their assets into multimodal networks. Using these integrated networks, the Pioneer sites will generate corridor data and apply the AMS approach to derive the most effective ICM strategies given their existing assets, demographics, and land use patterns.
- Adapting commercial-off-the-shelf modeling software packages to create the AMS approach. The ICM team combined the capabilities of existing transportation planning models including travel demand models, mesoscopic simulation models, and microscopic models to capture the strengths of these analysis tools.42 By integrating these models together, the ICM team was able to identify and address key gaps in current modeling approaches. These innovative enhancements have been been provided back to industry for incorporation into commercial products.
Because the ICM Initiative includes a complex set of iterative and concurrent activities, the next four pages present details on the efforts within each of the four phases. In particular, the third and fourth pages highlight the AMS testing and evaluation activities. The first set of tests took place in a modeling laboratory in 2006. Using archived data, the tests were used to validate that the AMS approach works and to illustrate how the application of ICM strategies can provide significant operational and mobility benefits along a corridor. A second set of AMS tests will use three of the Pioneer sites to evaluate the AMS approach under real-world conditions. These sites were selected in Summer 2008 and, as of the writing of this report, have been preparing their systems and networks for AMS testing.
To integrate corridors for optimized operations, the ICM Pioneer Sites rely upon many ITS Standards to create seamless data exchange. The ITS Standards that are being used and further refined to meet ICM needs are:
- Center-to-Center Communications including:
- XML
- Generic Reference Model
- Common Object Request Broker Architecture (CORBA)
- Data Exchange ASN.1 (DATEX)
- Traffic Signal Systems including:
- Actuated Traffic Controller (ATC)
- Actuated Signal Controller Units
- ATC Cabinets
- ATC Application Programming Interface
- Traffic Signal System Masters, also referred to as Field Management Station
- Signal Control and Prioritization
- Traveler Information including:
- Advanced Traveler Information System (ATIS)
- Traffic Management Data Dictionary (TMDD)
- Message Sets for External TMC Communication (MS/ETMCC)
- International Traveler Information Systems (ITIS) Phrase Lists
- Location Referencing Message Specification (LRMS)
- Field Devices including:
- Transportation Sensor System
- Ramp Meter (RM) Control
- CCTV Camera Control
- Video Switches
- Network Camera Operations
- Dynamic Message Signs (DMS)
- Public Transit Communications Interface Protocols (TCIP) including capabilities for:
- Fare Collection
- Incident Management
- Scheduling/Runcutting
- Passenger Information
- Spatial Representation
- Transit Signal Priority
ICM Initiative Activities
Phase 1: Define ICM strategies and develop the Initiative foundation.
The ICM Initiative began in 2005 with research on the current state of corridor management around the Nation as well as the identification of leading examples of ICM-like practices around the world. This research enabled the development of the first generic Concept of Operations that effectively defines the ICM strategies concept. Efforts also included the formation of a multimodal stakeholder group consisting of representatives from the public and private sectors to assist with the initial feasibility analysis and validation of the ICM approach.
Phase 2: Develop corridor tools and strategies.
The ICM Initiative team also began the investigation into existing modeling techniques in 2005. Major activities included:
- Researching the limitations and gaps in existing transportation models and data. Known gaps include the ability to model strategies in combination with one another; critical data gaps include arterial travel times and speed and transit status information.
- Adaptation of modeling tools to bridge the gaps and create new and different capabilities that allow for modeling strategies in real-time. One critical enhancement included the ability to accommodate the demand for mode and route shifts.
- Development of the AMS approach.
- Validation of the AMS approach through a set of tests and evaluation. Page 120 of this section describes the AMS test and evaluation plans.
- Transfer of the enhanced capabilities to the private sector for commercialization and for use by transportation practitioners.
For testing purposes, the ICM Initiative has defined the following:
- Six operational conditions. An operational condition represents the status of freeway performance. For instance, peak-period represents high demand and off-peak represents low demand. For the AMS tests, freeway operations were represented by combinations of high, medium, and low demand. Tests also included the occurrence of major and minor incidents.
- ICM strategy alternatives. Strategy alternatives are methods used by agencies to effect the flow of the traffic system (either restricting the flow or implementing new timing plans to allow more flow) using ITS (through the use of, for instance, highway traveler information, transit traveler information, ramp metering, HOT lane, or arterial traffic signal coordination). The AMS approach starts with a baseline of zero ITS and compares that to the use of individual strategies (i.e., only ramp metering) and then combinations of these strategies (i.e., ramp metering with arterial traffic signal coordination).
- Performance measures for each operational condition and for each ICM strategy. Performance measures include mobility (How do ICM strategies affect travel time and travel time reliability?), safety (How do ICM strategies affect incident response times and accident rates?), and fuel consumption and emissions (How do ICM strategies affect key environmental measures?).
Phase 3: Corridor Site Development, Analysis, and Demonstration
ICM & Data
In the same way that VII requires detailed data points on vehicle movements to create a greater situational awareness for safety, ICM requires similarly detailed data to gain visibility into system mobility and where unused or underutilized capacity exists within the system.
One critical gap is the data available on arterial roads. Agencies have traditionally taken a local approach to management of arterial streets, relying upon detectors at traffic signals to enable demand-responsive changes to the traffic signals for that intersection. ICM, however, requires a broader understanding of the travel times, queues, volume of vehicles, and occurrence of incidents at a granularity not currently available on arterial roads.
As part of the ICM Initiative efforts, a comparative study will be conducted on the minimum but most effective and cost-effective suite of technologies that can be used to instrument arterial roads. In addition to testing technologies, the ICM Initiative is working with the eight Pioneer sites and other State and local stakeholders to identify their needs for data granularity (detail) and frequency of update. This information will establish the baseline for determining the effectiveness of the suite of arterial technologies.
Concurrent with the development of the tools and strategies, the ICM Initiative solicited interest from sites around the Nation to participate in the demonstration of the AMS approach and application of ICM strategies. Key activities included:
- Selection of eight metropolitan areas ("Pioneer Sites") for development of tailored ICM Concepts of Operations and system requirements, reflective of local conditions, geography, and needs. The eight sites include Dallas, Houston, and San Antonio, Texas; Oakland and San Diego, California; Minneapolis, Minnesota; Montgomery County, Maryland; and Seattle, Washington.
- Selection of the most effective plans for implementation and funding of the demonstration and evaluation of the approaches that appear to offer the greatest potential for improving congestion.
The sites were chosen based on their recognized leadership in applying innovative congestion management strategies. Each site's corridors include assets and characteristics similar to many other corridors across the nation. They differ in geometric, demand, and operational characteristics—all of the sites have implemented real-time signal control on their arterials; many have deployed high occupancy vehicle (HOV) and value pricing strategies; and others have established advanced bus operations that include bus rapid transit services.
Phase 4: Knowledge and Technology Transfer (KTT)
Throughout the ICM Initiative, an iterative process of transferring knowledge and technology to State and local governments and industry has been in place. Key activities include:
Bookmark the ICM Website and Knowledgebase at:
- Transferring the results, strategies, knowledge, Concepts of Operation, and tools to transportation agencies and the public, and promoting implementation of effective ICM systems.
- Development of a web-based ICM Knowledgebase using virtual collaborative technology to encourage peer exchange and present ICM documentation.
- Development and delivery of a newsletter, web-based seminars, workshops, conferences, and other materials such as fact sheets and guidance documents.
AMS Testing and Evaluation
As part of Phases 2 and 3, the Initiative will employ an evolutionary approach to testing and evaluation, building on results as the foundation for the next set of activities. The AMS tests are designed to capture the strengths of the analytical and modeling tools to identify and help address key gaps in current modeling applications. Test results will allow the AMS approach to transition into a robust decision support tool to enable transportation system operators to select the correct strategies in real-time, under real-world conditions and demand. The test plans include evaluating each site's Concepts of Operations and selecting:
|
In 2006, the I-880 corridor in Oakland, California was chosen to provide archived data that encompasses a major freeway, arterial highways, airport and port traffic, and bus and rail transit serving a major concentration of residential, office, industrial, shipping, and warehouse land uses. |
|
In 2008, three of the Pioneer Sites were chosen and are preparing for AMS testing (see textbox below for details). |
|
In 2009, up to three of the eight Pioneer Sites will be selected to implement their ICM system and demonstrate the operations. |
In the summer of 2008, the ICM Initiative began working with three AMS Sites—Dallas, Texas; Minneapolis, Minnesota: and San Diego, California—to model and analyze strategies to be implemented as part of their planned integrated corridor management system. The analysis will follow the AMS approach used on the I-880 test corridor and will be tailored to the assets, data, and strategies to be implemented in each corridor. The analysis should be complete by Fall of 2009.
The assets that these three AMS sites are integrating are illustrated on the next page using icons. San Diego, California is highlighted to further illustrate how the network integration will translate into support for ICM strategies. The San Diego image is a rendering of the planned Rancho Bernardo Transit Center. It provides a bird's-eye view of the opportunity to seamlessly integrate the corridor's freeway, arterial, and transit assets into a true multimodal transportation system. San Diego has developed their ICM Concept of Operations and is in the process of investing in the infrastructure and technology gaps that need to be filled to enable integrated corridor management in the I-15 corridor. The chart below provides examples of the expected benefits for system operators and for travelers, once ICM is implemented.
| ICM Benefits Not Available Today | |
|---|---|
| Travelers | Real-time information on:
|
| System Operators |
|

Research Findings and Important Results
The ICM Initiative validated that the AMS approach works and, in doing so, validated the ICM concept.
The test corridor modeling validates the ICM concept and illustrates that dynamically applying ICM strategies in combination across a corridor has great potential to reduce congestion and improve the overall productivity of the transportation system. The integration of existing models provided transportation professionals with:
- The ability to model, for the first time, integrated corridor management strategies and to understand the most optimal combinations of strategies.
- A new tool and capability to tailor ICM strategies for their regional corridors, in collaboration with their regional partners. The next set of AMS tests will evaluate the capability of the tool for use with real-time data and based on real-time demand.
- New capabilities to model traveler response to travel information, effects of variable pricing and High Occupancy Toll (HOT) lanes, and ability to promote mode shift.
The ICM Initiative was able to model approaches never modeled before.
Using archived data from I-880 in Oakland, California and layering additional test scenarios onto the archived data, the AMS approach measured, for the first time and from a regional, multimodal perspective, strategies such as:
- Traveler response to traveler information.
- Impacts of congestion pricing, tolling, and HOT lanes.
- Mode shift and transit usage.
For instance, the test revealed two important results for the test corridor:
- In the presence of a major incident (i.e., when two freeway lanes are blocked for 45 minutes), 1 to 4 percent of travelers affected by the incident are likely to shift to transit.
- Adding an HOT lane and proactively disseminating highway traveler information are, in combination, consistently the most effective ICM investments in terms of both benefit-cost and net annual benefit.
The ICM Initiative provides insights into the optimization strategies and benefits. The test corridor illustrated some important results (see textbox on following page for more detailed results):
- ICM is most effective under the worst operational conditions including heavy demand and major incidents, which represented approximately 25 percent of all commute days for the test corridor.
- AMS can model benefits across operational conditions that show how the effectiveness of ICM strategies varies under different prevailing conditions. For example, freeway ramp metering that produces positive overall benefits under high travel demand may produce system "dis-benefits" under medium travel demand yet produces benefits when used in combination with other strategies.
- AMS reveals how combinations of different strategies support each other, and therefore can provide a more optimal approach than if used alone; also how certain combinations might work in conflict with one another. For instance, the most significant benefits were derived from dynamic adjustments to the price of the HOT lane in response to changing traffic conditions. In combination with HOT, when the system provided information to direct travelers to transit and other routes, updated the ramp meters, and changed arterial signal timings, the benefits increased significantly by comparison to using each strategy individually.
An ICM needs analysis highlighted that the type, level of detail, and frequency of data is a critical element in managing corridor-wide demand.
Lessons learned include the following:
- To enable the AMS approach to work with real-time data, the data sets need to contain more comprehensive arterial data. The analysis created an initial understanding of the type and frequency of data that will be required to manage a corridor. Some key examples and the frequency of data collection include:
- Transit vehicle location and speed information collected every 30-120 seconds.
- Vehicle passenger information counted at every stop.
- Information on parking lot use every 30-300 seconds.
- For arterials, there is a need for lane level information on vehicle volumes collected every 1 to 5 seconds and reported every 30 to 300 seconds. This includes the need for signal phase data by approach lane and the need for link volumes and average speeds.
- However, there are no easily available solutions except to install a suite of new detector technologies along arterial corridors (see textbox to the side for more detail on the existing situation). As this may prove expensive, new solutions are needed.
AMS Test Results
A set of preliminary AMS tests were run as a first step in a full validation of an AMS approach. It is important to note that the first AMS tests used data from archived sources as well as artificial (or fabricated) data as a means to simply test whether the approach worked. The most important findings from these preliminary AMS test results are:
- That the AMS approach works. Using archived and artificial data, the AMS tests showed the capability of the approach to model strategies in combination with each other and to provide visibility into the synergies and most optimal combinations. The bar graphs below are results from the I-880 tests. They illustrate that the approach can distinguish effects of the strategies alone versus in combination.
- That applied ICM strategies will have an effect on corridor operations, congestion, and management. The I-880 results produced an understanding of the magnitude of shifts that may be possible. These shifts included:
- Shifts to transit use under varying conditions of demand and incident events.
- Shifts in traveler response to traveler information regarding availability of alternate routes or variable pricing of lanes.
Some of the key findings of the first AMS tests are illustrated below.
Figure 3.63 to the right illustrates how the AMS approach can provide visibility into how combinations of different strategies support each other and, therefore, can provide a more optimal approach than if used alone; it also shows how certain combinations might work in conflict with one another. In Figure 3.63, some of the most significant benefits were derived from the dynamic adjustments to the price of the HOT lane in response to changing traffic conditions. In combination with HOT, when the system provided information to encourage travelers to take transit or other others; updated the ramp meters; and changed arterial signal timings, the benefits increased by comparison to using those strategies alone.
Figure 3.64 to the left illustrates how the AMS approach can model benefits across operational conditions. The results show how the effectiveness of ICM strategies varies under different prevailing conditions. For example, freeway ramp metering that produces positive overall benefits under high travel demand may, by comparison, produce system "dis-benefits" under medium travel demand. Yet the same strategy under medium demand may produce benefits if used in combination with other strategies.
The AMS approach will be applied to real-world settings and will be subject to real-time varying demand, variances in demographics and land use patterns, incident events, weather conditions, etc. These next tests will take place in Winter 2009 and are the next step in understanding whether the AMS approach will produce equally as robust test results and whether it can provide decision support to system operators for real-time optimized operations and traveler information.
The following lists some of the current issues with data frequency:
- Freeway data collection times are typically only 1 minute or greater.
- Traffic signal detectors that are used to "sense" the volume of vehicles on each approach to the traffic signal in order to determine the most effective signal phase timing do not offer a mechanism for data collection. Many signal detectors do not even communicate the basic phase efficiency performance data.
- Some arterial systems are able to communicate data, but typically at 15 minute intervals.
- Probe vehicles offer a promising solution for arterial data collection, but may not be as comprehensive as required. Probe vehicle testing is underway with the I-95 Corridor Coalition; results of their evaluation will inform the ICM research efforts.
There has been early adoption of ICM Strategies.
Early ICM tools and institutional arrangements have already been used to help manage corridor congestion resulting from several major incidents in 2007: collapse of the I-35 bridge in Minneapolis and the collapse of a freeway interchange in Oakland, California, and a collision involving a jack-knifed tractor-trailer in Houston. In each of these examples, transportation professionals affirmed the value of ICM in helping them to respond more effectively and to proactively manage congestion impacts. Additionally, other transportation agencies are turning to ICM to develop their own multimodal solutions. Using the generic ICM Concept of Operations and ICM Knowledgebase, agencies are developing their own plans and looking to the ICM Initiative for more technical guidance.
Another important lesson learned is that implementation of ICM is not a "one size fits all" methodology.
- Effective, real-time corridor management requires selective implementation of different ICM strategies, depending on the extent of underlying non-recurrent congestion (due to incidents, weather, or unexpected events) and on the severity of prevailing travel demand. This is illustrated through the development of the eight possible ICM Pioneer Site Concepts of Operations that address a variety of corridor needs and performance measures.
- Similar to other complex ITS multimodal systems integration and deployment projects with a broad range of partners, the success of ICM implementation is dependent upon use of the systems engineering process to ensure that partners start with the problem and not the solution. The process has proved invaluable for the eight ICM Pioneer sites for helping focus partners on first clearly articulating corridor-level needs and then defining requirements. Using the process also minimized the risks.
ICM supports decision makers in their decisions to invest in and implement ICM.
For transportation agencies, ICM:
- Leverages existing investments in ITS by integrating them into more robust, multimodal operational systems.
- Provides dynamic optimization strategies in combination with one another across a corridor in response to varying conditions.
When using the AMS approach before ICM implementation, results:
- Help decision makers identify gaps in infrastructure, assets, and strategies; evaluate ICM strategies; and invest in the best combination of strategies that would minimize congestion and improve safety. Comprehensive modeling before investment increases the likelihood of ICM success, and helps minimize unintended consequences of applying ICM strategies to a corridor.
- Help estimate the benefit resulting from ICM across different transportation modes and traffic control systems. Without being able to predict the effects of ICM strategies in a corridor, agencies may not take the risk of making the institutional and operational changes needed to optimize corridor operations.
Overall, ICM is expected to deliver significant benefits.
These initial results reveal that, when applied in the right combination, ICM strategies will:
- Reduce congestion "hot spots" in the system and improve the overall productivity of the system.
- Reduce travel times, delays, fuel consumption, emissions, and incidents, thereby increasing the reliability and predictability of travel.
- Optimize the management of corridor operations, combining highway, arterial, bus, rail, and public safety systems into a multimodal perspective for operations.
- Provide more robust, integrated traveler information that offers travelers actionable alternatives to more efficiently arrive at their destinations and avoid congestion.
ICM Roadmap
The ICM Initiative is on schedule. As the roadmap in Figure 3.65 below illustrates, Phase 1, preliminary research and guidance for multimodal corridor management, was completed in 2006, and Phases 2, 3, and 4 are well underway. Phase 2-4 overlap and run concurrently.
Next Steps and Final Activities
In 2009, the Department will work with three of the eight ICM pioneer sites to model and analyze their ICM strategies in the context of their corridors. The analysis will allow the Department to test the ICM analysis, modeling and simulation process using the site's existing assets, strategies, and operational data. The one-year effort is intended to help determine, for each site, the combination of ICM strategies that work best under varying situations (high demand vs. low demand; incident versus free-flow conditions). In conjunction with the analysis, in 2009 the ICM initiative will select up to three demonstration sites to implement and test the ICM system in use with transportation corridor operations to evaluate whether analysis results are realized under real-world decision making and operational conditions.
3.2.6 Next Generation 9-1-1 Initiative
The Transportation Problem
The Nation's 9-1-1 system has been an unqualified success for more than 40 years. However, changes in the public's use of technology—the growing market for both wireless and voice-over-internet protocol (VoIP) telephony (e.g., Skype or Vonage) and the increasingly nomadic world they reflect— are contributing to greater expectations for connections than the existing 9-1-1 system can deliver. The spread of highly mobile, dynamic communications requires capabilities that do not exist today for 9-1-1 emergency call centers when people look to connect during emergencies. It is critical that emergency call centers have the ability to:
- Easily connect with a wide range of devices on the market;
- Identify the location of the call; and
- Recognize the technology generating the call in order to route the call to the appropriate responder in a timely manner.
Challenges faced by emergency call centers—known as public safety answering points or PSAPs—prevent easy transmission of data and critical sharing of information that can significantly enhance the decision-making ability, response, and quality of service provided to emergency callers. Technology challenges include:
- Use of an older, analog-based infrastructure and equipment by PSAPs (the overall system architecture has essentially not changed since the first 9-1-1 call was made in 1968); and
- Use of local 9-1-1 networks that cannot:
- Process calls using new communications technologies such as IP access networks.
- Efficiently transfer calls when the volume of callers exceeds the available resources.
The ITS Opportunity
ITS offers innovative technology solutions that address the existing system and technology challenges to enable the existing 9-1-1 system to deliver the next generation of capabilities and services. By capitalizing on recent technology advances, the ITS program will deliver a design for a Next Generation 9-1-1 (NG9-1-1) system that, when implemented, will:
- Enable 9-1-1 calls from any networked device;
- Provide quicker delivery and more accurate information to responders and the public alike. Delivery will incorporate better and more useful forms of information (real-time text, images, video, and other data);
- Establish more flexible, secure, and robust PSAP operations with increased capabilities for sharing data and resources, and more efficient procedures and standards to improve emergency response;
- Enable call access, transfer, and backup among PSAPs and between PSAPs and other authorized emergency
The NG9-1-1 Initiative Approach
The NG9-1-1 Initiative is focused on the research required to produce a design for a next-generation 9-1-1 system. The goal is to design a system that is capable of voice, data, and video transmission from different types of communication devices into PSAPs and on to emergency responder networks. Working closely with a wide range of stakeholders, the Initiative's efforts are focused in two areas: technical/engineering and institutional/ transitional. Specifically, the Initiative is focused on delivering a NG9-1-1 system architecture, or a technological framework, that can accommodate today's stakeholder interests and existing market-based solutions as well as future technological advances. Technical activities centered on:
- Engaging a wide audience of stakeholders required for successful NG9-1-1 design and implementation.
- Developing an NG9-1-1 Concept of Operations to establish the vision.
- Documenting system requirements and developing a system architecture.
- Conducting a proof-of-concept (POC) demonstration.
- Assessing the cost, value, and risk of a next-generation 9-1-1 system and developing a transition plan that will identify and evaluate all non-technical factors (e.g., stakeholders, impacts, benefits) that need consideration for a successful nationwide transition.
Accomplishments to Date
- Developed a next-generation 9-1-1 engineering architecture that allows for connections to a wide range of new technologies.
- Developed emergency call center receiving software and software screens for operators to record information in files that can be easily distributed to and accessed by other stakeholders involved in the emergency response.
- Developed a set of POC test scenarios for two environments:
- Laboratory tests for the most complex aspects of the NG9-1-1 architecture and the new call technologies.
- PSAP tests for demonstrating the ability to receive, process, and send calls. The sites are:
- King County E-911 System, Seattle, Washington
- Montana Public Safety Services Bureau, Helena, Montana
- Rochester, New York Emergency Communications Department, Rochester, New York
- Ramsey County Metropolitan Emergency Services Board, St. Paul, Minnesota
- Indiana Office of the State Treasurer, Indiana Wireless 911 Board, Kosciusko County, Indiana
- Coordinated engagement on standards across the Nation and with other emergency service network providers within North America (Canada and Mexico).
- Tested transmission and receipt of calls under real-world conditions, sending test 9-1-1 calls through PSAPs.
NG9-1-1 Initiative Results to Date
The NG9-1-1 Initiative has produced one of the first studies that comprehensively defines and documents a future vision for the existing 9-1-1 system.
- The public awareness generated by the Initiative has alerted 9-1-1 stakeholders that a fundamental transformation in how 9-1-1 calls are originated, delivered, and handled is underway.
- The NG9-1-1 Initiative facilitated requirements-setting with a large and diverse group of stakeholders whose interests, at times, might conflict.
- The results of the NG9-1-1 effort have helped communities to become more engaged in the issues and challenges that face the existing 9-1-1 system and to discuss and plan for a future system.
The NG9-1-1 architecture has been validated through a set of POC tests. Using seven laboratory test scenarios and eight PSAP test scenarios, tests on the NG9-1-1 prototype system revealed:
- The new design is capable of accommodating calls from a wider range of devices. All five PSAPs were able to receive cellular calls, instant messaging, legacy 9-1-1 calls (wireline), telematics (automatic crash notification), VoIP calls, and live video feeds. The prototype system allowed PSAPs to identify the caller's location and route the call to the appropriate response center.
- The POC included 320 individual tests in laboratories and in PSAP facilities with 280 (87.5 percent) successfully meeting the test criteria. Results include:
- The ability to transmit test telematics data (speed, vehicular rollover status, and crash velocity) was tested successfully. The test system demonstrated the ability to easily and automatically transfer this important data associated with a vehicle crash to the PSAPs.
- The ability to identify the test caller's location was successfully tested for wireline, wireless, and IP-based calls.
- The ability to send and receive voice, video, data, and text (through instant messaging and short message service) was successfully tested, although issues arose with bandwidth and video streaming methods that caused some video-based calls to fail.
POC testing revealed that the NG9-1-1 System provides important new capabilities. For example:
- Tests showed that PSAPs can link with one another during emergencies, unlike in the past when calls would dead-end at the PSAPs, with no way to provide back-up for one another during widespread emergencies such as hurricane evacuations.
- Tests showed that the NG9-1-1 system will have the ability to accommodate streaming video and automatic teleconferencing with interpreting services to better meet needs of the deaf/hearing community during emergencies. However, the tests also revealed that PSAPs will require upgrades and technological improvements to accommodate these services.
The Problem
The Nation's 9-1-1 system has been an unqualified success story for more than 40 years. During this time period, our telecommunications technology has evolved rapidly, providing a nation on the move with the ability to place a call from a wide range of devices and locations. The growing market penetration of both wireless and Voice-over-Internet-Protocol (VoIP) telephony and the increasingly nomadic world they reflect have presented important challenges for the 9-1-1 system. Americans who place calls from mobile devices during emergencies have greater expectations for connections to the 9-1-1 system than the current system can deliver. Because text, data, images, and video are increasingly common in personal communications and vehicle-based safety services, Americans further expect that the 9-1-1 system can accommodate these dynamic communications modes.
What is a PSAP?
PSAP is an acronym for Public Safety Answering Point, an organization in the United States, typically county or city controlled, responsible for answering 9-1-1 calls for emergency assistance from police, fire, and ambulance services.
There are roughly 6,100 primary and secondary PSAPs in the Nation.
However, the older, analog-based infrastructure and equipment used by emergency call centers (known as Public Answering Service Points or PSAPs) has not kept up with new technology capabilities and cannot easily connect with a wide range of devices on the market today. The critical challenges faced by the 9-1-1 system today include:
An Outdated 9-1-1 System. The PSAPs predominantly use older, analogbased infrastructure and equipment; the overall system architecture has essentially not changed since the first 9-1-1 call was made in 1968. As a result, the current system is not designed to accommodate emergency calls from the range of new technologies in common use today including:
- Laptops, Internet Protocol (IP) phones, IP wireless devices, or other devices that deliver audio, data, video message, picture message, and live video.
- Cellular devices that transmit SMS and data and text messaging.
- Third-party call centers that employ telematics (e.g., Automatic Collision Notification), audio, and/or data as part of their client services, such as General Motors' OnStar service.
- IP and Video Relay Services (VRS) that assist the deaf and hard-of-hearing community (text and video).
Additionally, PSAPs have limited capability to identify the location of a call from a mobile device or to recognize the technology generating the call in order to route the call to the appropriate responder in a timely manner.
Limited Emergency-Call-Center Capabilities. Existing emergency call centers are incapable of some critical functions such as:
- The ability to link with one another during emergencies. PSAP calls to one another currently dead-end at the PSAPs with no way to act as back-up for one another when operations in one part of the country become overloaded or shut down due to circumstances such as hurricane evacuations or wildfires.
- The ability to accommodate streaming video and automatic teleconferencing with interpreting services to better meet need of the deaf/hearing community during emergencies.
Limited Call Processing Capabilities. In context of today's expectations existing 9-1-1 software and call taker business processes face critical limitations:
- The original software was not designed to answer or process a variety of multimedia data (e.g., voice, text messages, images, and video) and, in particular, to accommodate how call takers address data received simultaneously from multiple sources.
- There are limited linkages to supplemental or supportive data such as: interactive maps; links to reference data on a particular location, surrounding hazards, or inputs that could change the emergency response or improve responder safety; and decision support on important questions to ask callers to enhance information on the situation.
- Call taker software is not designed to transfer calls when the volume of callers exceeds the available resources.
Institutional Barriers to National Transition. In previous decades, each introduction of a new technology—for instance, wireless/cellular or Voice over Internet Protocol (VoIP)—has required system modifications at the thousands of 9-1-1 systems and PSAPs across the Nation. Not only has this approach been costly, it has meant that changes have not evolved equally in all parts of the country. However, in evaluating the opportunity for transitioning the entire nation to a new system, it is recognized that there are multiple paths to the nationwide implementation of NG9-1-1. Although the NG9-1-1 system is envisioned as an interconnected system of local and regional emergency services networks ("system of systems"), network boundaries of emergency services may vary depending on local requirements and organizational frameworks. Also, the path to consistent, nationwide implementation is highly dependent upon age of the underlying infrastructure, funding, policies, and priorities of the 9-1-1 Authorities. Figure 3.67 provides a graphic illustration of the evolution of technologies and changes to the 9-1-1 system since the 1960s. Mobile and vehicle-based technologies are yet to be fully incorporated into a 21st century 9-1-1 system.
Collectively, these technology and system challenges prevent the easy transmission of data and critical sharing of information that can significantly enhance the decision-making ability, response, and quality of service provided to emergency callers.
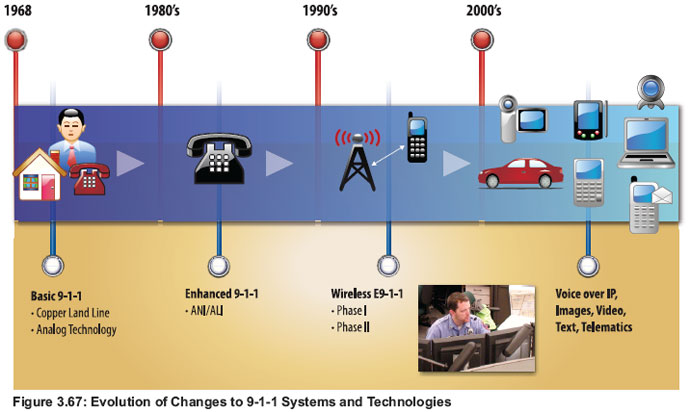
The ITS Opportunity
ITS offers innovative technology solutions to address system and technology challenges to enable the existing 9-1-1 system to deliver the next generation of capabilities and services. By capitalizing on recent technology advances, the ITS Program expects to deliver a next generation 9-1-1 system design (NG9-1-1) that, when implemented, will:
- Enable 9-1-1 calls from any networked device based on the development of a flexible, open, non-proprietary architecture.
- Provide quicker delivery and more accurate information to responders and the public alike. Delivery will incorporate better and more useful forms of information (real-time text, images, video, and other data).
- Establish more flexible, secure, and robust PSAP operations with increased capabilities for sharing of data and resources, and more efficient procedures and standards to improve emergency response.
- Maximize the use of available public capital by facilitating increased coordination and partnerships within the emergency-response community. This will result in operating and maintenance cost savings.
- Enable call access, transfer, and backup among PSAPs and between PSAPs and other authorized emergency organizations that are geographically separated.
- Enable greater interoperability of the network (a system of systems) through the incorporation of industry standards The NG9-1-1 Initiative has coordinated engagement on standards across the Nation and with other emergency services network providers within North America (Canada and Mexico), recognizing the global impacts of routing emergency calls in an IP environment.
For transportation, updating to an NG9-1-1 system is a critical component in enabling 9-1-1 callers to quickly send more accurate and more useful forms of information about traffic incidents and crashes to 9-1-1 emergency call centers. For example, the NG9-1-1 system will be able to:
- Handle a 9-1-1 call from a PDA, or computer.
- Receive automatic crash notification data (on speed, vehicular rollover status, or crash velocity) sent through a thirdparty service provider such as General Motors' OnStar.
- Receive photo images, data sets, and medically relevant data that can be routed to appropriate emergency medical services.
Moreover, NG9-1-1 will provide a tool for sending location-targeted hazard alerts and evacuation guidance to motorists and other mobile device users through reverse messaging.
The NG9-1-1 Initiative Approach
The NG9-1-1 Initiative is focused on the research required to produce a design for a next generation 9-1-1 system. The goal is to provide a system that is capable of providing a wider range of voice, data, and video transmission from different types of communication devices into the PSAPs and onto emergency responder networks.
The Initiative's approach is focused in two areas: technical/engineering and institutional/ transitional. Technical activities center on documenting NG9-1-1 system requirements, developing a system architecture, and demonstrating a proof-ofconcept system. Institutional activities focus an assessment of the cost, value, and risk of a next generation 9-1-1 system and on developing a transition plan that will identify and evaluate all non-technical factors (e.g., stakeholders, impacts, benefits) that need consideration for a successful nationwide transition.
Two important principles bound the scope of the NG9-1-1 Initiative:
The Initiative is specifically focused on a developing an NG9-1-1 system design, or architecture, that can accommodate today's stakeholder interests and existing market-based solutions as well as future technological advances. Nationwide planning and transition activities will be the responsibility of a National 9-1-1 Office established as part of the National Highway Traffic Safety Administration. However, as new technologies can dramatically increase the amount of data available on the status of an emergency, prototyping new call taker software that will assist in the ability to receive and act upon emergency information in an efficient format will also be a part of this Initiative.
- The new NG9-1-1 architecture will be based on non-proprietary and off-the-shelf hardware and software solutions and the associated standards required for greater networking and connection opportunities.
To develop a national NG9-1-1 system architecture, the NG9-1-1 Initiative team will work closely with industry, State and local governments and Authorities, and a diverse group of stakeholders to accomplish a three-phase set of research and demonstration activities, briefly summarized below.
The following list provides an example of only some of the many stakeholder groups that were engaged in defining NG9-1-1 needs and system requirements:
- Public Safety Associations
- Local, County, and State Communications Centers
- Wireline and Wireless Carriers
- Traditional, IT, and VoIP telecommunications service providers.
- Standards Development Organizations
- Equipment manufacturers:
- Public Safety equipment manufacturers
- Wireless handset manufacturers
- PSAP equipment and software vendors
- Location Technology Companies
- Telematics Companies
- Privacy and Consumer Advocacy Organizations
- Research Institutions and Academia
- Professional and Industry Assoc.
- Other N-1-1s (e.g., 511, 211, 311, etc.)
- Poison Control Centers
- Suicide Prevention Hot Lines
- Regulatory Agencies
- Citizens
Phase 1: Engage Stakeholders
Stakeholder involvement is crucial to the system design. Throughout the Initiative, a large audience of stakeholders will have opportunities to provide input and peer-review of project deliverables. The 9-1-1 constituency is a diverse group of entities. The textbox to the left illustrates the multitude and complexity of stakeholder relationships required for successful NG9-1-1 design and implementation. Activities within Phase 1 include:
- Engaging public and private stakeholders essential to the success of implementing the next generation 9-1-1 system.
- Building from established relationships within the public and private sectors in the area of emergency communications and, specifically, the 9-1-1 community.
- Engaging stakeholders in the design and transition plan.
Public-safety services throughout the nation have evolved through the years with different leadership, direction, and priority structures. As a result, no two PSAPs operate in the same manner. Additionally, PSAPs serve very different geographies, citizens and responder groups, and types of calls, and must support the business rules and methods of call processing from one jurisdiction to another. Stakeholder input is thus critical to ensuring that the NG9-1-1 system is highly configurable to support the diverse nature of PSAPs and State and local 9-1-1 authorities.
Phase 2: Establish the Vision.
Phase 2 activities are focused on the development, of a preliminary NG9-1-1 Concept of Operations and user requirements in partnership with key stakeholders. The Concept of Operations communicates the vision of the NG9-1-1 system to stakeholders so that they can be actively engaged in its development and deployment. It is the foundation for development of the NG9-1-1 requirements, and it drives the design of the overall system. A preliminary concept of operations was completed during Phase 2 and has been updated throughout the NG9-1-1 Initiative effort. Additionally, a preliminary requirements analysis was also produced.
Phase 3: Define the Future. Phase 3 is the largest and most complex phase of the NG9-1-1 Initiative, and has four overlapping stages:
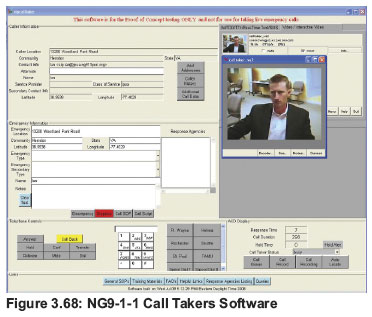
- System Requirements and Consensus-Based Architecture
Stage 1 activities are focused on the development of the final Concept of Operations, the system description and requirements documentation, and an analysis of alternative national system architectures. - Preliminary Transition Analysis
Stage 2 activities result in establishing a foundation for Nationwide transition to NG9-1-1 which includes:- The examination of the costs, value, and risks associated with moving to a next generation environment.
- The identification and analysis of the issues facing government, industry and the general public in planning for NG9-1-1 deployment.
- The development of a preliminary plan for transitioning from today's 9-1-1 system to a national NG9-1-1 system.
- System Design and Demonstration
Stage 3 activities are focused on the demonstration of the NG9-1-1 concept and includes:- Design, development, and implementation of a working NG9-1-1 model that can receive text, images, and video from several different kinds of access networks and communications devices.
- Development of critical software and process components of the NG9-1-1 system to enable a greater range of capabilities (see Figure 3.68) required for:
- Receiving and routing 9-1-1 calls from a wide range of communications devices and services.
- Processing calls, in particular, the capability to handle multi-media calls, and data at the PSAPs.
- Transferring calls and data to other emergency call centers.
- Proof-of-concept testing of the most critical components of the NG9-1-1 architecture. Tests are designed to ensure that the hardware and software functionality meet the requirements established with stakeholder inputs. The test plan included:
- Tests conducted at both at laboratories and at five selected PSAPs.
- Tests that were focused primarily on the critical procedures required to successfully receive and process a 9-1-1 call.
- A set of fifteen test scenarios to ensure that the test system provided the expected functionality.
Prototyping new call taker software presents an important opportunity to assist the call taker in receiving and acting upon emergency information in an efficient format, as new technologies can dramatically increase the amount of data available on the status of an emergency. Importantly, the new NG9-1-1 architecture and software will be based on non-proprietary and off-the-shelf hardware and software solutions and on associated standards required for greater networking and connection opportunities.
The map of the test locations is presented on the following page. The textboxes on pages 134–135 present further information on the test plan and structure of the tests and preliminary insights from the tests.
- Final Transition Plan & Final Architecture
The final tasks of the NG9-1-1 Initiative include activities that will draw from the findings and conclusions of preceding activities, as well as input solicited from stakeholders, to produce a final transition plan that recommends strategies to address cost, value, risk, and deployment issues. In addition to the final NG9-1-1 system architecture, these and related documents will form the basis for State and local agencies to begin development of other components that will form a comprehensive emergency communications system.
Transition to NG9-1-1 is expected to be an evolutionary process, involving technological, economic, and institutional change. In some cases, the path to NG9-1-1 implementation will depend on the underlying infrastructure and state of the PSAP and 9-1-1 Authority. In other cases, the transition to NG9-1-1 may depend on the ability of service networks to deliver NG9-1-1 calls via IP-based infrastructure. A preliminary transition plan has been developed that identifies the potential for multiple approaches to nationwide deployment. The plan describes two possible frameworks for deployment:
- Coordinated, Intergovernmental Approach: Planned and coordinated deployments of NG9-1-1 capabilities that are governed by statewide or regional 9-1-1 Authorities or by informal mechanisms that enable a cooperative deployment.
- Independent, Unilateral Approach: Decentralized deployments by local jurisdictions through independent initiatives.
Most deployments of NG9-1-1 will probably fall between these two extremes. Each approach has advantages that are described further in the plan that is available at: www.its.dot.gov/ng911/pubs/ng911_preliminary_transition.htm. Ultimately, the NG9-1-1 deployment vision implies some degree of leadership and ability to address future needs for funding sources, operational procedures, governance and policy, and upkeep on standards and technology. The NG9-1-1 Initiative end products—the system architecture and system requirements, standards, transition plan, and acquisition tools—will be transitioned to a National 9-1-1 Office to be housed within the National Highway Traffic Safety Administration.
In April 2008, the NG9-1-1 Initiative began developing a temporary NG9-1-1 network. The network is only a prototype and it cannot be compared to the existing 9-1-1 system. The prototype was designed specifically to test whether the NG9-1-1 architecture could, in fact, result in a functioning system with the desired functionality defined by the many stakeholders.
The temporary NG9-1-1 network was comprised of hardware and software components of a future NG9-1-1 system and were deployed to each of the eight test locations. The primary components included:
- A wide range of mobile and IP-based call origination devices (see text box to side). Each type of technology was used to deliver a call to the system during the tests.
- Network devices (routers, switches, firewalls, and servers).
- New call taker software.
- NG9 1 1 databases.
The Booz Allen laboratory served as the origination point for the calls and provided the IP access network; the Texas A&M and Columbia University laboratories provided the NG9-1-1 proof-ofconcept network. Due to the flexibility of the proof-of-concept system design, some devices were able to make calls as part of the test directly from PSAP locations. At no time during the tests were real calls used; nor did the test system interrupt the operations of the 9-1-1 system.
A series of fifteen scenarios were tested to ensure that the prototype system provided the expected functionality. The test scenarios are described in the table below.
| Segment | Test Scenario | Description |
|---|---|---|
| System Operations | Call Authentication | Checks for the appropriate credential information against an authorization list. |
| Recognize Originating Location | Validates the location of the caller. | |
| Recognize Call Type | Identifies classification of calls (e.g. telematics, wireless, silent alarms, etc.). | |
| Route Call to PSAP | Routing of a call to one or more appropriate PSAPs. | |
| Provide Network Bridging Services | Conference and share data as appropriate and beneficial to call treatment, processing, and incident management. | |
| Record Call | Captures call data in real time. | |
| PSAP Operations | Answer Call | Allows a call taker to respond to an indication of an incoming call. |
| Determine and Verify Location of Emergency | Queries caller about the location of the emergency. | |
| Update Mobile Caller's Location Information (if caller is mobile) | Obtains more accurate location information for a mobile caller. | |
| Determine Nature of Emergency | Obtains necessary information to route caller to the proper person/agency. | |
| Identify Appropriate Responding Agency or Service | Identifies the appropriate agencies for incident response. | |
| Obtain Supportive or Supplemental Data post call delivery | Accesses supportive (e.g., Automatic Crash Notification [ACN]) or supplemental data (e.g., medical history, telematics, geospatial) after the call has been delivered to the PSAP. | |
| Establish Conference Call | Establishes conference session with other entities as required or transfer caller. | |
| Initiate Callback | Allows a call taker to attempt to reestablish contact with a caller. | |
| Transfer Call Record | Transfers or forwards call records to authorized entities electronically. |
NG9-1-1 proof-of-concept tests ran through July 2008; final analysis and results are expected in November 2008. Testing occurred in a manner consistent with the Proof-of-Concept Test Plan (the NG9-1-1 test plan can be found under the Publications and Presentations link at: www.its.dot.gov/NG911). Based on basic pass/fail criteria for each test, the NG9-1-1 prototype system was evaluated to determine how it performed in both a functional and operational manner. From a subjective perspective, feedback and input from the end users was recorded to provide for avenues of future study and investigation. Performance data was stored to measure how the NG9-1-1 proof-of-concept system responded; this data will be used to identify opportunities to review and optimize future networks or systems. Preliminary test results are highlighted in the table below.
| High-Level Functional Component | Initial Finding |
|---|---|
| Ability to send and receive voice, video, text (IM, SMS) and data | Successfully Tested. The tests revealed, however, that the ability to locate an SMS-based call is not currently supported by the telecommunications industry—carriers, equipment, or technology. As end users have expectations of SMS capability to access emergency networks, private sector firms can use these results to decide how to invest in upgrades and technologic improvements. |
| Increased deaf/hearingimpaired accessibility | Successfully Tested. The ability to send video from a handheld device is important for the deaf/hearing-impaired community. Tests revealed, however, that streaming video from a mobile device is not currently supported by the carriers or devices. Similar to the SMS tests, industry now has results to consider the upgrades that are required to support video. |
| Caller's location identification | Successfully Tested. A number of different location acquisition and identification processes were utilized that help demonstrate the functional capabilities to locate emergency callers. Other efforts already underway within the community will need to continue to identify best practices and standards for this critical function. |
| Call routing based on caller's location | Successfully Tested. Use of an Emergency Services Routing Proxy (ESRP) and Location to Service Translation (LoST) servers, along with a Business Rules database is a first in a real application environment. The POC results will help other organizations as they implement early next generation-like solutions. |
| Transmitting telematics data (Automatic Crash Notification) including speed, vehicula rollover status, and crash velocity | Successfully Tested. Working with a telematics service provider, the POC was able to demonstrate the ability to easily and automatically transfer important data associated with a vehicle accident. Display of all the data is a concern for end users and efforts underway to leverage a small, distinct subset of the data to perform predictive injury analysis will provide a dramatic benefit for PSAPs and emergency responders to make both quicker and better decisions. |
| IP networking and security in an emergency communications environment | Successfully Tested. Although the use of industry-accepted best practices will be strongly encouraged for any NG9-1-1 system, much work is still needed to ensure the integrity of the network and system. While not included in the POC due to scope limitations, the use of an Identify and Access Management (IdAM) system should be vetted. |
As illustrated below, the NG9-1-1 system and the proof-of-concept tests are receiving recognition from both National and local media.
Research Findings and Important Results
The NG9-1-1 Initiative has produced one of the first studies that defines and documents a comprehensive future vision for the existing 9-1-1 system.
- The public awareness generated by the Initiative has alerted 9-1-1 stakeholders that a fundamental transformation of the way 9-1-1 calls are originated, delivered, and handled is underway.
- The NG9-1-1 Initiative facilitated requirements setting with a large and diverse group of stakeholders whose interests at times might conflict.
- The results of the NG9-1-1 effort have helped communities become more engaged in the issues and challenges that face the existing 9-1-1 system and to discuss and plan for a future system. The NG9-1-1 tests and demonstrations created a sense of urgency and movement within the community to get more people involved and start discussing the issues as a community.
The NG9-1-1 architecture has been validated through a set of proof-of-concept (POC) tests.
Twenty-six professional call takers, dispatchers, and supervisory individuals were trained to assist the NG9-1-1 Initiative team with the POC testing. Using seven laboratory test scenarios and eight PSAP test scenarios, tests on the NG9-1-1 prototype system revealed:
- The new design is capable of accommodating calls from a wider range of devices. All five PSAPs were able to receive cellular calls, instant messaging, legacy 9-1-1 calls (wireline), telematics (automatic crash notification), VoIP calls, and live video feeds. Importantly, the prototype system allowed PSAPs to identify the caller's location and to route the call to the most appropriate response center based on the caller's location.
- The POC included 320 individual tests in the laboratories and the PSAP facilities with 280 (87.5 percent) successfully passing the test criteria. Some examples of results are:
- The ability to transmit test telematics data (speed, vehicular rollover status, and crash velocity) was successfully tested. The test system demonstrated the ability to easily and automatically transfer this important data associated with a vehicle crash to the PSAPs.
- The ability to identify the test caller's location was successfully tested for wireline, wireless, and IP-based calls.
- The ability to send and receive voice, video, data, and text (through instant messaging and short message service) was successfully tested, although issues arose with bandwidth and video streaming methods that caused some video-based calls to fail.
POC testing revealed that the NG9-1-1 System provides important new capabilities.
For example:
- Tests showed that PSAPs can to link with one another during emergencies, unlike in the past when calls would dead-end at the PSAPs with no way to provide back-up for one another during widespread emergencies such as hurricane evacuations.
- Tests showed that the NG9-1-1 system will have the ability to accommodate streaming video and automatic teleconferencing with interpreting services to better meet need of the deaf/hearing community during emergencies. However, the tests also revealed that PSAPs will require upgrades and technological improvements in order to offer these services.
POC testing validated that the PSAP call taker software works.
- The new call taker software was designed to assist in consolidating and presenting emergency information received via new technologies in an efficient format. The proof-of-concept tests revealed that the system is capable of assisting call takers with the greater amount of data; instead of 'data overload', the data was presented in a manner that did not cause undue confusion. Importantly, the orientation to the new software was quickly accomplished, indicating that the call taker software is easy-to-understand and the data displayed are straightforward.
- Including call takers in the testing process provided valuable feedback about the functionality that someday they will come to depend on. Their input regarding needs and difficulties in the early stages helped to identify the current system problems that are addressed by the new technologies.
The NG9-1-1 Initiative POC tests validated that core NG9-1-1 functions and features work.
- Key features of the system were demonstrated to show how they enabled emergency calling from a variety of devices and forwarding caller information to the most appropriate call center. POC testing revealed that the system design, requirements and features accurately reflect the needs of the stakeholder community and bring together industry-accepted best practices for implementing complex IP-based solutions.
- The NG9-1-1 was designed to be an open and accessible system. NG9-1-1 system was developed using industryaccepted best practices for networking and designing an IP-based system, industry-accepted standards, and off-the-shelf hardware and software. The POC validated that the NG9-1-1 system can connect with a wide array of devices and technologies.
The NG9-1-1 system provides new capabilities for stakeholders, while expanding resiliency and redundancy for the public.
- With a transition to an NG9-1-1 system, PSAPs will have the capability to communicate with one another during daily operations and emergencies, unlike today, where call centers typically cannot interoperate with nearby agencies, making it difficult to provide back-up for one another during widespread emergencies such as hurricane evacuations. No longer is a PSAP tied to a specific facility with dedicated telecommunications circuits; NG9-1-1 provides access to systems and networks without regard to geographic boundaries.
- The deaf/hearing impaired community, historically underserved by the 9-1-1 system, relies heavily on texting capabilities for communications.
- The NG9-1-1 system can not only accommodate the receipt of text messages from a range of devices used by the deaf community, but can accommodate streaming video to broaden type of the information that can be sent.
- Stakeholders from this community have provided input and recommendations at multiple points throughout the NG9-1-1 Initiative regarding accessibility needs; they will remain a constant source of feedback as NG9-1-1 solutions are implemented.
The NG9-1-1 Initiative has developed a broad set of resources that will facilitate national transition and inform other 9-1-1 services on how to move to the next generation of capabilities.
Key documents produced throughout the Initiative can be found at: www.its.dot.gov/ng911/ng911_pubs.htm. The list includes:
- Next Generation 9-1-1 System Initiative - Proof of Concept Test Plan
- Preliminary Transition Plan
- NG9-1-1 Transition Issues Report
- Data Acquisition and Analysis Plan
- Proof of Concept Deployment Plan
- Preliminary Analysis of Cost, Value, and Risk
- Human Machine Interface Display Design Document
- NG9-1-1 Architecture Analysis Report
- NG9-1-1 System Description and Requirements Document
- Next Generation 9-1-1 System Initiative—Concept of Operations
NG9-1-1 Roadmap
Final Activities
Remaining tasks are focused on finalizing the proof-of-concept test analysis and using the results of all of the phases to deliver a complete Transition Plan and Final Architecture to guide national implementation. Final activities include:
- The proof-of-concept testing that is part of Phase 3/Stage 3 was begun in June 2008 and completed in September 2008.
- The final transition plan final architecture will be delivered in November 2008 and the end products of the NG9-1-1 Initiative will be transferred to a National 9-1-1 Office within the National Highway Traffic Safety Administration. These end products will form the groundwork for future transition planning and activities that will consider the institutional barriers identified by the NG9-1-1 Initiative. Importantly, the Initiative provides this new National 9-1-1 Office with the information needed to facilitate a successful national transition and an understanding that the NG9-1-1 architecture can, indeed:
- Enable 9-1-1 calls from any networked device.
- Incorporate better and more useful forms of information (real-time text, images, video, and other data).
- Increase PSAP capabilities for the sharing of data and resources.
- Enable call access, transfer, and backup among PSAPs and between PSAPs and other authorized emergency organizations that are geographically separated.
3.2.7 Mobility Services for All Americans Initiative
The Transportation Problem
Human services transportation includes a range of service options designed to meet the needs of transportationdisadvantaged populations including older adults, disabled persons, and those with lower income. Since transportation needs differ across populations and types of human services provided, human services agencies have developed their own transportation programs that are suited to their environment, clients, and community.
These multiple programs often result in fragmented, redundant, and unreliable services with underutilized capacity. This results in expensive, inefficient services that do not meet customer needs and provide poor quality transportation services. Multiple services can be confusing, leaving a customer unsure of who to call or how to access the service that best meets their needs in terms of schedule, distance, or fare structure.
Coordinating these individual programs makes more efficient use of resources because eliminates service duplication and encourages the use and sharing of existing community resources. In communities where coordination is a priority, citizens benefit from more extensive service, lower costs, higher quality of service, easier access to transportation, enhanced traveler information, and improvements in overall mobility. Figure 3.71 illustrates conceptually the complexity of coordination. The graphic on the left represents the fragmented, uncoordinated situation that exists in many communities today; the graphic on the right shows how ITS can streamline services and meet customer needs for service availability, expanded hours, information, accessibility, reliability, and flexibility.
The ITS Opportunity
ITS presents the opportunity to seamlessly connect customers, agencies, and transportation providers—with just one call—and increase the accessibility and mobility for the transportation-disadvantaged and general public. Through the application of ITS, the MSAA Initiative is providing the technological backbone to realize this vision.
The key to effective and efficient coordination is integrating ITS technologies into a physical or virtual Travel Management Coordination Center (TMCC) that networks all parties together and uses ITS technologies that are tested and proven and have demonstrated significant benefits and return on investment, including:
- Fleet scheduling, dispatching, and routing systems;
- Integrated fare payment and management (payment, collection, and processing) systems;
- Better traveler information and trip planning systems, particularly for customers with accessibility challenges; and
- Advanced GIS and demand-response systems to provide door-to-door service.
A successful TMCC provides benefits to:
- Customers with simplified, one-stop access to unified travel support services—one call via any technology to arrange for transportation services.
- Human service agencies with the ability to coordinate transportation needs across service providers and modes, considering fare structures extending customer service across wider geographic areas.
- Transportation Providers with a method for matching schedules and capacity with requests; an ability to efficiently process financial transactions; an opportunity to eliminate redundancies; and tools to ensure security and customer eligibility to use the system
MSAA Initiative Approach
Working collaboratively with the Federal Inter-Agency Coordination Council on Access and Mobility and building on the success of the United We Ride (UWR) Initiative, the MSAA Initiative will:
- Establish a coalition of stakeholders that can act as a bridge between the transportation/ITS and human services communities in order to identify solutions that combine the knowledge and expertise of both.
- Conduct foundational to develop a generic TMCC concept of operations and model for communities to tailor to meet their own needs.
- Develop and field test the TMCC concept at a set of demonstration sites that offer a wide variety of unique operational, institutional, geographic,demographic, and technological characteristics.
- Promote the results of the Initiative across the Nation through outreach, education, and knowledge transfer.
Accomplishments to Date
- The MSAA Initiative has developed a generic TMCC concept of operations that can be used by any jurisdiction to improve its human services transportation coordination.
- Eight sites have been selected that represent a variety of community characteristics. Each site has written a tailored concepts of operations and TMCC system design that reflect local agency and customer needs.
- In Fall 2008, three or fout sites will begin field demonstrations to model the MSAA concept for communities across the Nation. These evaluations will provide insight into MSAA effectiveness, best practices, and lessons learned.
Initiative Results to Date
The eight sites have each developed concepts of operation and system designs that are unique and innovative approaches to coordinating and delivering human services transportation.
- A common and important emphasis for all sites was customer-focused service. Each created a system that provides a one point of access for customers to find information about the transportation services available to them. The MSAA sites refer to this as "o wrong door"—the same information is available via the internet, the 211 telephone service, text messaging, walking in, or a range of other means.
The operational benefits to be gained were important to the sites in their designs:
- Many sites moved toward greater centralization and coordination to enhance service delivery or unify billing.
- Six of the eight sites generated TMCC designs that allow them to serve more customers. Two sites specifically focused their TMCC on services to provide better transportation to jobs.
- Four sites emphasized the role of the transportation providers. The TMCCs were designed to enable more providers, especially small operators, to be involved in human services transportation.
- All sites developed their TMCC with a regional or inter-county approach to coordinating transportation.
The process of engaging local stakeholders in the TMCC system design has already generated local efficiencies for agencies such as:
- Increased staff productivity;
- Improved fleet scheduling, dispatching, and routing;
- Streamlined reporting, billing, and financial transactions;
- Simplified fare payment, collection, and processing;
- Enhanced traveler information and travel management capability with accessibility features; and
- Improved ability to quickly and efficiently address last minute requests and cancellations.
The MSAA Initiative has provided a platform that has effectively raised stakeholder awareness and excitement about coordinating human services transportation:
- Project site meetings attract active participation from State and local government decision-makers, transportation operators, human service agencies, and customers.
- Elected officials are attending meetings and offering the support of their agencies to their MSAA teams.
- Private industry vendors actively participated and responsively contributed their expertise.
The Problem
The delivery of responsive and coordinated transportation services to the Nation's elderly, individuals with disabilities, and disadvantaged populations is a challenge for most transportation agencies and human services organizations. However, unlike many public programs, the challenge is not primarily lack of funding. Rather, it is a lack of coordination with other providers to satisfactorily meet agency and customer needs:
Fragmented service delivery. Customers of human services agencies. For example, Medicaid, Head Start, or the Temporary Assistance for Needy Families Program frequently lack access to some form of transportation that will deliver them to their appointments, jobs, shopping, or everyday destinations. Most of these social programs provide transportation services independently. At the Federal level alone, there are 64 programs that fund transportation services for people in need. According to a 2003 U.S. Government Accountability Office report, Transportation- Disadvantaged Populations,43 29 of these programs collectively spent $2.4 billion in 2001 to provide transportation assistance to disadvantaged populations. Medicaid, a Federal program for medical assistance to low-income individuals and families, spent nearly $1 billion on transportation in 2001.
This lack of coordination hampers agencies' ability to deliver effective transportation services to the people who need them most. The outcome is fragmented, redundant, and unreliable transportation services that result in greater expense, unmet needs, under-utilized capacity, and poor transportation services for users.
What Is a Transportation Broker?
Transportation brokers are matchmakers. They bring together customers needing transportation with providers that have capacity. The match considers time of day of the trip, fare structure, distance, location, and existing schedule of the provider. By seeing the whole picture, brokers can combine a number of requests into one trip, which can significantly improve the efficiency and economics for both providers and customers.
Unmet customer mobility needs. From a user's perspective, a doctor's appointment may currently require a full day of travel by multiple carriers or a long-distance taxi ride. For many clients of the system, a full day of travel can create further problems, the need for child care, an extra day away from a low-wage job that provides little or no paid time off, and the need to purchase meals or other assistance while traveling. While a long taxi ride may be more time-effective for the client, it is an expensive and inefficient means of service provision. Additionally, users involved with multiple organizations, for instance a Veteran working with a workforce agency, might be confused by the multiple services, leaving a customer unsure of who to call or how to access the service that best meets their needs in terms of schedule, distance, or fare structure.
Despite the availability of ITS technologies, their deployment for human services transportation remains sporadic. According to the Department's 2005 report, Advanced Public Transportation Systems Deployment in the United States—Year 2004 Update,44 of more than 500 transit agencies surveyed, nearly 70 percent had low deployment of ITS technologies to coordinate human services transportation. A mere 29 percent reported a medium level of ITS deployment, and only 1.6 percent had a high level. Table 3.8 illustrates these disparities.
| Level of Deployment of ITS Technologies | ITS Technologies for Human Service Transportation | ITS Technologies Supporting Ridership Applications | ||||
|---|---|---|---|---|---|---|
| 78 Large Metro Areas | Other Areas | All Areas | 78 Large Metro Areas | Other Areas | All Areas | |
| High | 2.1% | 1.2% | 1.8% | 25.4% | 6.1% | 13.2% |
| Medium | 32.3% | 26.9% | 28.9% | 48.7% | 43.7% | 45.5% |
| Low | 65.6% | 71.9% | 69.6% | 25.9% | 50.2% | 41.3% |
The ITS Opportunity
What Is Human Service Transportation?
Human services transportation includes a range of transportation service options designed to meet the needs of transportation disadvantaged populations including older adults, disabled persons, and those with lower income. People have different needs and require different services depending on their abilities, their environment, and the options available in their community. Examples include dial-a-ride, using bus tokens or transit passes on fixed-route scheduled services, and accessing taxi vouchers or mileage reimbursement.
What Is Coordinated
Coordinating human services transportation programs makes the most efficient use of limited resources by avoiding duplication caused by overlapping individual program efforts and encouraging the use and sharing of existing community resources. In communities where coordination is made a priority, citizens benefit from more extensive service, lower costs, a higher quality of service, easier access to transportation, enhanced traveler information, and improvements in overall mobility. When appropriately applied, coordination can lead to significant reductions of operating costs (per trip) for transportation providers.
Integrated technologies enable successful human services coordination. ITS brings a proven track record for addressing the key challenges in coordination:
- Institutional coordination. ITS enables the seamless sharing of data and enhance the solid working relationships that many agencies have with other agencies. For instance, ITS can bring together regional stakeholders that span a wide range of jurisdictions and internal operating cultures to enable collaborative decision-making in real time.
- Geographic coordination. ITS provides agencies with an operational capability to serve customers from a cross-jurisdictional or regional perspective. Further, ITS helps overcome the challenge of providing technological support to relatively remote areas.
- Functional and process coordination. The presence of multiple transportation providers and human services agencies make functional and process coordination harder to achieve. ITS allows for the technical integration of functions such as automated client eligibility verification, common billing, fleet management, trip scheduling, and enhanced traveler information. Additionally, ITS integrates existing and multiple technological platforms and associated data standards into one coordinated system.
- Operational coordination. ITS allows for the operational coordination of assets such as buses or vehicle fleets, which currently tend to be mostly agency-specific.
The key to enabling effective and efficient coordination is the integration of ITS technologies into a physical or virtual Travel Management Coordination Center (TMCC) that networks human services agencies with transportation providers and brokers and provides customers with an integrated single point of access for travel planning support and information. A successful TMCC will provide greater benefits for:
- Customers. Customers make one call using the their most convenient technology. There is "no wrong door" as the TMCC can accommodate requests through a wide range of communications media such as cell phones, internet, PDAs, 211 telephone number, walking in, and others.
- Human service agencies. Agencies can significantly improve coordination with each other and with transportation providers to offer greater accessibility to transportation for all customers.
- Transportation providers. Transportation agencies benefit from:
- Efficient processes. With systems for coordinating requests, transportation providers can serve more customers and still utilize existing capacity and/or eliminate redundancies within the same geographic regions. Providers can improve fleet scheduling, dispatching, and routing.
- Streamlined operations. Transportation providers and human services agencies benefit from streamlined reporting, billing, and financial transactions. Customers benefit from simplified fare payment, collection, and processing.
- Improved security. With processes to determine and designate customer eligibility as part of the system, providers are assured that customers are certified and identified as authentic users of the system.
The following pages illustrate the key elements of the MSAA concept and describe how ITS enables TMCCs to address the complexity of today's human services transportation coordination.
Delivering Mobility Services for All Americans— The Travel Management Coordination Center Model
As illustrated in the graphic below, human services transportation coordination is a complex endeavor. The Travel Management Coordination Center (TMCC) is an essential component in delivering coordinated human services transportation management and operations across various social welfare programs and service providers, modes, and geographic areas. The graphic on the left shows the fragmented, uncoordinated situation that exists in many communities today. The graphic on the right offers an illustration of how use of ITS technologies and TMCC implementation can streamline services and better meet customer needs for service availability, information, accessibility, reliability, and flexibility.
The graphic on the right also illustrates that the TMCC model provides the capability to integrate many types of information from multiple sources into one simplified point of access for both customer travel support services and provider coordination. With a one-stop center, customers are empowered to better manage their trips (such as confirming or canceling trips), reducing service providers' workload, and improving system efficiency.
There is no "one-size-fits-all" model of a TMCC— eight MSAA demonstration sites have generated eight unique TMCC configurations. However, certain ITS technologies are common to the design of a successful TMCC, including:
- Fleet scheduling, dispatching, and routing;
- Fare management (payment, collection, and processing);
- Enhanced traveler information and trip planning, particularly for customers with accessibility challenges; and
- Advanced GIS and demand-response systems to provide door-to-door service.
These technologies are tested, proven, and available on the market today.
As the MSAA Initiative proceeds toward implementing and evaluating different TMCC models at three or four sites, the results of these deployment demonstrations are expected to provide:
- The empirical evidence of the significant benefits and return on investment needed by agencies and the public as a basis for the local implementation decisions;
- The technical basis for replicating and scaling the TMCC concept to meet the community's needs;
- Guidance and examples of generating stakeholder participation to reflect local characteristics, needs, environment, and priorities; and
- Technical knowledge and best practices for developing detailed system designs that require minimal customization from both technical (e.g., ITS) and non-technical (e.g., policies and regulations) perspectives.
Common TMCC Concepts
A TMCC can be either a physical or a virtual center that connects human services agencies with transportation agencies, dispatchers, and brokers. A TMCC can be centralized, decentralized, or a hybrid of both approaches. The appropriate design is driven by a host of factors:
TMCC
| Centralized Eligibility Reservation Scheduling Dispatching Fare collection Fleet management Billing Reporting |
Hybrid Some functions centralized Centralized functions for some providers, but not all Some centralized functions subject to individual agency approval |
Decentralized Remote access (functions) Database integration Information clearinghouse |
A TMCC can be either a physical or a virtual center that connects human services agencies with transportation agencies, dispatchers, and brokers. A TMCC can be centralized, decentralized, or a hybrid of both approaches. The appropriate design is driven by a host of factors:
- Customer needs;
- The number and type of local providers and their assets (for instance, the number of vehicles in their fleets);
- The extent of data-sharing and collaborative decision-making that stakeholders want; and
- The existing technologies and systems in place for operations.
The Table 3.9 describes common needs that drive TMCC designs on the left; on the right, the table lists the types of functional components that are required to meet needs.
| Common Needs in TMCC System Design | Common Functional Components of TMCCs |
|---|---|
|
|
The MSAA Approach
The MSAA Initiative builds on the success of the "one call" vision established by the United We Ride Initiative, a Federal national interagency initiative that, together with MSAA, spearheads the drive to better coordinate human services transportation (see textbox below for details). In 2004, the ITS Program launched the MSAA initiative to realize the One Call vision by applying technological solutions to overcome the barriers of accessibility and mobility for the transportation-disadvantaged and to bring greater coordination to human services transportation. Two key goals form the basis for the MSAA research:
- Increase the mobility and accessibility for the transportation-disadvantaged and general public; and
- Achieve more efficient use of community transportation funding resources.
The MSAA approach is to develop and test the concept of a TMCC at eight locations that offer a range of technical, institutional, demographic, and operational features including:
- Geographic boundaries—urban, suburban, small urban, rural.
- Different lead-agency organizations and team members. Some teams have leadership from the transit agency, a local transportation broker agency, the metropolitan planning organization, or a workforce investment board. In constructing the teams, some sites have engaged university transportation research centers and other have incorporated private sector vendors that bring valuable expertise and speed to the design process.
- Different agency roles in human services transportation. Roles include planning, coordinating, providing transportation services, and brokering transportation.
Table 3:10 on pages 150-151 highlights the similarities and differences among the eight sites.
The concept of providing mobility services for all Americans builds on the vision established by the United We Ride Initiative—it should only take one call to arrange a ride.
The strength of the One Call vision is that it simplifies the conversation about how to better coordinate human services transportation. "One call" shifts the focus to the riders. It sets a benchmark and gives all stakeholders a clear goal.
United We Ride is an interagency Federal national initiative that supports States and their localities in developing coordinated human service delivery systems. In addition to State coordination grants, United We Ride provides State and local agencies with a selfassessment tool for transportation coordination and planning, technical assistance, and other resources to help their communities succeed.
United We Ride has established the National vision nation of coordinated human services transportation. The MSAA Initiative provides the technological basis for realizing this vision through the integration of ITS technologies to form TMCC.
More information on United We Ride can be found at:
www.unitedweride.gov/1_ENG_HTML.htm
www.unitedweride.gov/ONEVISIONBrochure_Textfinal.pdf.
To be successful, TMCCs must be replicable, scalable, and easily tailored to meet the needs of local and regional inter-agency service coordination. In addressing these goals, the MSAA Initiative team has structured a program that includes the following efforts:
- Coalition building. Activities are focused on creating a bridge between the transportation, ITS, and human services communities in order to create a suite of solutions that combine the efforts and knowledge of both.
- Foundational research. The MSAA team launched the initiative by integrating knowledge on needs, gaps, barriers, past and current innovations, and emerging opportunities. This foundational research allows for:
- Program resources to be allocated to focus on the "right" targets;
- A baseline to be defined to measure and gauge the initiative's performance and effectiveness;
- The development of an information inventory so that subsequent program activities can build upon existing knowledge and systems; and
- The identification of concurrent activities and initiatives by other agencies and stakeholders so that related efforts can be effectively integrated and/or coordinated.
- TMCC model planning and design. Activities are focused on the design of local community models that demonstrate the technical and institutional feasibility of a coordinated human services transportation system with enhanced accessibility features.
- Model deployment. Activities are focused on developing and field testing the TMCC concept at a set of demonstration sites that offer a wide variety of unique operational, institutional, geographic, and technical characteristics.
- Outreach and technology transfer. Activities are focused on increasing awareness of and promoting the MSAA concept, models, and benefits to the general public, policy-makers, and agencies. Educating human service providers and transportation service providers about the opportunities, potential return on investment, and availability of transportation resources for enhanced accessibility and mobility is a key activity in facilitating deployment for the Nation.
The MSSA Demonstration Sites
The heart of the MSAA Initiative is the development of TMCC designs at eight demonstration sites selected for their ability to demonstrate the technical and institutional feasibility of designing and implementing a coordinated human services transportation system with enhanced accessibility features. The site selection was conducted by a panel of Federal partners including FTA, FHWA, FMCSA, NHTSA within USDOT, the Department of Health and Human Services, the Department of Labor, and the Department of Education. An interagency review panel was considered critical, given the interdisciplinary nature of human services transportation-related issues. The sites are shown on the map in Figure 3.73 on the next page.
The demonstration sites were chosen based on a wide and varied range of technical, institutional, and operational characteristics. They represent a mix of organizations—regional government entities, human services, transit agencies—and a mix of rural, medium-sized, and large cities. It is important to note that the MSAA Initiative awarded three demonstration opportunities to non-traditional transportation agencies—a workforce investment board and a set of metropolitan planning agencies. This diversity in agency type results in additional models that broaden both the demographic and audience scope of transportation coordination, with results anticipated to be of great interest to agencies across the Nation.
Despite the variations, the efforts to generate the sites' Concepts of Operations and TMCC system designs pointed to some commonalities of the successful TMCC model:
- Simplified points of access to unified, customer-based travel support services.
- Coordination of human services transportation management and operations across various social welfare programs and service providers, modes, and geographic areas.
- Use of ITS technologies that are tested and proven.
- Minimal customization required from both technical (e.g., ITS) and non-technical (e.g., policies and regulations) perspectives.
To provide more empirical evidence of success, the ITS Program will select three or four demonstration sites to proceed with TMCC model deployment and evaluation. The evaluation will identify the significant benefits and return on investment from implementing the TMCC concept.
A key criterion in the selection is the ability of and commitment by the selected site to maintain and operate the TMCC beyond the MSAA funding. In addition to a self-evaluation to be performed by the local demonstration communities, the MSAA Initiative will provide a comprehensive independent evaluation to determine the return on investment and measure the overall success of the TMCC in achieving program goals.
Research Findings and Important Results
The MSAA Initiative has developed eight innovative approaches to coordinating and delivering human services transportation.
In developing TMCC concepts of operations and system designs, the sites varied in their visions:
- The major area of emphasis for all sites was customer service. All sites envisioned a system that provides an easy means (e.g., one-stop) for customers to get information about the transportation services available to them.
- Six of the eight sites felt that the TMCC gave them the ability to serve more clients.
- Two sites specifically focused on expanded service to provide better transportation to jobs for those who need it.
- The operational benefits of the TMCC were the second major area of emphasis. Most sites expect to realize efficiencies through, for example, elimination of duplication in paperwork or services. Themes of centralization and coordination were apparent in the responses of sites in terms of enhanced service delivery or unified billing. Only one site said it expected a reduction in costs.
- Four sites emphasized the role of the providers, expecting the TMCC to enable more providers, especially small operators, to be involved in human services transportation.
- One site considered coordinated services as a key component for emergency evacuations.
- All sites saw the TMCC as a means for taking a regional or inter-county approach to coordinating transportation.
The process of engaging local stakeholders in the TMCC system design has generated a higher degree of awareness of ITS within the human services field and has generated some early efficiencies in the delivery of transportation services.
- Some observations from the implementing agencies include:
- Increased staff productivity;
- Integrated point of access for traveler support;
- Improved fleet scheduling, dispatching, and routing;
- Streamlined reporting, billing, and financial transactions;
- Simplified fare payment, collection, and processing;
- Enhanced traveler information and travel management capability with accessibility features; and
- Ability to address last-minute requests and cancellations without significant effort or inefficiencies.
The MSAA Initiative has provided a platform that has effectively raised stakeholder awareness and excitement about the human services-transportation coordination opportunities.
- Project site meetings attract active participation from State and local government decision-makers, transportation operators, human service agencies, and clients.
- Elected officials are attending meetings and offering their support to the MSAA teams.
- Industry vendors actively participate and contribute their expertise.
Table 3.10: MSAA Demonstration Sites
Aiken, South Carolina
Lead agency, agency type: Lower Savannah Council of Governments, MPO
Geographic representation: Small city
Key TMCC elements:
- Single consumer access point
- Traveler information services
- Schedule and trip management
- Real-time trip tracking
- Provider payments and reports
- Data services
- Transportation coordination services
Key stakeholders:
- Transportation providers: Regional Transportation Management Association Members (a coalition of transportation operators and human service providers that offer a variety of specialized transportation services)
- Human services agencies: Social service, employment and training, rehabilitative, senior citizens groups, and other service providers and purchasers
- Governmental agencies: Lower Savannah Council of Governments, South Carolina Department of Transportation
- Institutional partners: Transportation Work Group (a 40-member advisory group that provides technical and operational input and advocacy)
Atlanta, Georgia
Lead agency, agency type: Atlanta Regional Commission, MPO
Geographic representation: Urban and suburban
Key TMCC elements:
- Centralized multimodal traveler
- Information system
- Telephone call center, internet, email system
- Centralized scheduling and dispatching
- Traveler eligibility
- Vehicle tracking system
- Fare payment and management
- Accounting and program management
Key stakeholders:
- Transportation providers: Public and paratransit agencies, human services transportation transit providers, private transportation providers (taxis, vanpools etc.)
- Human service agencies: Senior citizen service groups, Medicaid
- Governmental agencies: Georgia Department of Human Resources, Georgia Department of Community Health, Georgia Department of Labor
Camden, New Jersey
Lead agency, agency type: Camden County Workforce Investment Board, nonprofit organization for local workforce development
Geographic representation: Urban/suburban Key TMCC elements:
- Enhanced customer trip information
- Seamless fare and billing system
- Coordination of provider trip functions
- One-stop call for services
Key stakeholders:
- Transportation providers: New Jersey Transit, South Jersey Transit Authority, SEN-HAN Transit (designated Camden County paratransit provider), NJ Transit Access Link (ADA paratransit), private livery companies
- Human services agencies: Faith-based organizations (churches, Jewish Federation, Catholic Charities, Daycare), Medicaid, Workforce Investment Board, senior citizens groups
- Planning agencies: Delaware Valley Regional Planning Commission and the Transportation Management Association, Cross County Connection
- Institutional partners: Twelve municipalities within Camden County, Winslow Township
Fitchburg, Massachusetts
Lead agency, agency type: Montachusett Regional Transit Authority, transit agency
Geographic representation: Small city
Key TMCC Elements:
- Traveler information system
- Brokerage and booking system
- Vehicle tracking
- Scheduling and dispatching
- Operations management and reporting
- Fare payment and billing management
Key stakeholders:
- Transportation providers: Lowell Regional Transit Authority, Cape Ann Transportation Authority, Private transportation providers
- Human Services agencies: Volunteer agencies, senior citizens groups, specialized service agencies utilizing public transportation, Montachusett Home Care Corporation, MOC Head Start , Guild of St. Agnes Day Care, local Veterans offices
- Government agencies: Massachusetts Executive Office of Health and Human Services- Human Service Transportation office, Massachusetts Department of Social Services, Massachusetts Rehabilitation Commission, Massachusetts Commission for the Blind, New Hampshire DHSS, Commonwealth of Massachusetts, CentralWest Regional Employment Solutions Team
Kent, Ohio
Lead agency, agency type: Portage Area Regional Transportation Authority, transit agency
Geographic representation: Small city
Key TMCC elements:
- Centralized reservations
- Scheduling and dispatching
- Traveler information
- Traveler referrals
Key stakeholders:
- Transportation Providers: Geauga County Transit, Portage Area Regional Transit Authority, Emergency transportation services, specialized service agencies utilizing public transportation (veterans agencies, senior citizen agencies)
- Human services agencies: Advocate agencies (Catholic Charities, United Way, Board of Mental Retardation and Developmental Disabilities, Medicaid)
- Government agencies: Ohio Department of Transportation, Portage County Emergency Management, Geauga County Department of Emergency Services
Louisville, Kentucky
Lead agency, agency type: Transit Authority of River City, transit agency
Geographic representation: Urban and suburban
Key TMCC elements:
- Traveler information
- Eligibility process for subsidized travel
- Scheduling trips
- Monitoring trips
- Fare collections
Key stakeholders:
- Transportation providers: Transit Authority of River City, non-emergency medical transportation, private transportation companies
- Human services agencies: Regional Mobility Council (composed of representatives of human service agencies, transportation providers, public officials, and consumers)
- Government agencies: Kentucky Department of Transportation, Indiana Department of Transportation, Louisville Metro Government,
- Planning agencies: Kentuckiana Regional Planning and Development
Orlando, Florida
Lead agency, agency type: Central Florida Regional Transportation Authority, transit agency
Geographic representation: Urban and suburban
Key TMCC elements:
- Trip booking
- Trip information
- Account information
- Dispatch and scheduling
- Customer-concerns tracking
- Travel training
- Fleet management
Key stakeholders:
- Transportation providers: Central Florida Regional Transit Authority, Lakeland Area Mass Transit District, Polk County Transit Service
- Human services agencies: Social services organizations (mental health care providers, rehabilitation centers, behavioral health care), senior citizens groups, Goodwill Industries
- Government agencies: Florida Department of Transportation, Florida Department of Elder Affairs, Florida Agency for Persons with Disabilities
- Planning agencies: MetroPlan Orlando, Polk County Transportation Planning Organization
Paducah, Kentucky
Lead agency, agency type: Paducah Area Transit System, transit agency
Geographic representation: Rural
Key TMCC elements:
- Telephone-based scheduling and reservation
- Dispatch
- Vehicle tracking
- Referrals
- Live customer service
Key stakeholders:
- Transportation providers: Paducah Area Transit System, Murray—Calloway Transit Authority, Fulton County Transit Authority
- Human services agencies: Volunteer agencies, faith-based organizations, senior citizens groups, Specialized service agencies using public transportation
- Government agencies: Commonwealth of Kentucky Department of Medicaid, Department of Vocational Rehabilitation, Department of Disability, Department of Juvenile Justice, Department of Health
MSAA Roadmap
The MSAA roadmap has shifted slightly since the 2006 Five-Year Program Plan. Findings and results from the early foundation research highlighted the need to better align the Initiative's approach with the MSAA stakeholder requirements. Stakeholders requested that the MSAA Initiative provide additional stakeholder listening sessions, requiring more time up front but generating inputs that resulted in a more robust development of the MSAA generic Concept of Operations. Additionally, the demonstration site partners required more up systems engineering training up front to navigate the complexity of their Concept of Operations and TMCC design and development. This additional work up front has shifted the MSAA completion date from late 2009 into 2010. The additional time has resulted in:
- A more focused, bottoms-up approach that has generated solid working partnerships and dynamic TMCC designs.
- Greater interest and excitement within the local communities and among a broader range of stakeholders than initially expected.
Final Steps
As of June 2008, the following activities are scheduled as part of the final activities of the MSAA Initiative:
Selection of MSAA deployment sites. Seven demonstration sites have submitted design documents along with proposals for implementation, budget, and schedules. The MSAA team will review proposals and recommend three to four sites for implementation; selection is expected to take place in later Fall 2008.
Tracking of non-selected sites. The sites that are not chosen will be tracked regarding their decision to continue to implement on their own. Given the level and types of benefits expected from deployment, the Department anticipates that the non-winning sites will implement their designs within their communities.
MSAA deployment evaluations. Model deployment evaluation will be conducted simultaneously with the chosen MSAA deployments. An independent evaluator will develop detailed evaluations plan for each of the selected sites. Data collection templates to guide local data collection efforts during evaluation are under development.
Outreach and technology transfer to the Nation. Continued stakeholder engagement, technical assistance, and knowledge transfer are critical to the successful deployment of TMCC models across the Nation. The MSAA Initiative is formulating a plan to provide targeted and effective stakeholder outreach. The plan will:
- Identify the wide variety of stakeholders and their needs related to human services transportation and ITS as well as any non-ITS-related stakeholder needs.;
- Prioritize stakeholder needs;
- Identify and leverage existing resources and outreach mechanisms that best respond to stakeholder needs; develop new resources only as needed; and
- Identify ways to measure the overall effectiveness of stakeholder outreach efforts and provide for periodic reviews and updates.
The MSAA outreach plan is structured with three key goals in mind:
- To be able to provide input and guidance to the US DOT for the planning, programming, execution, monitoring, and control of the overall outreach effort;
- To define a common platform for stakeholder outreach in order to be able to coordinate, leverage, and build upon the efforts of the many MSAA partners, institutions, and communities; and
3.3 New Research Initiatives
In addition to its own initiatives, the ITS Program participates in two new Department-level major initiatives aimed at addressing tow of the nation's most overwhelming transportation challenges:
3.3.1 The Congestion Initiative—evaluating how the combination of innovative technologies can have a significant impact on congestion reduction in major urban areas.
3.3.2 The Rural Safety Initiative—evaluating how ITS-based interventions can improve rural safety.
The Transportation Problem
The congestion of America's transportation network poses a major threat to our nation's economic prosperity and quality of life. Whether it takes the form of a clogged highway, an overwhelmed seaport, or a backup on the runway of an overcrowded airport, most American citizens and businesses are familiar with the frustration of gridlock. In 2005, Americans lost an estimated 4.2 billion hours and 2.9 billion gallons of fuel from traffic jams alone. Figure 3.75 illustrates the significant increase in congestion over a twenty-year period from 1983-2003.45
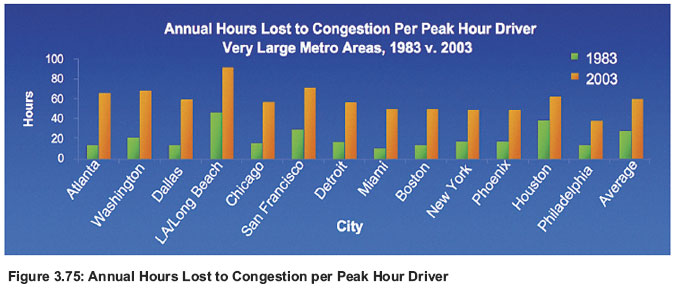
In 2006, the US DOT announced the formation of the National Strategy to Reduce Congestion on America's Transportation Network. Known as the "Congestion Initiative," it serves as a blueprint for Federal, State, and local officials to meet needs associated with congestion in their areas. Major components of the Department's Congestion Initiative include:
- Congestion Relief Programs
- Public-Private Partnerships
- Corridors of the Future
- Implementing Technological and Operational Improvements
- Border Congestion Relief
- Increasing Aviation Capacity
The Congestion Relief component of the Initiative includes two programs—Urban Partnership Agreements (UPAs) and Congestion Reduction Demonstrations (CRDs). These programs are premised on the notion that:
[T]here exist innovative and demonstrated strategies that more efficiently and effectively provide relief to traffic gridlock than current practice. These options include technologies such as congestion pricing and high-speed open road tolling, and the billions of dollars in private capital available for investment in public infrastructure.
Each program includes U.S. cities or regions that will aggressively use four complementary and synergistic strategies, known as the "4Ts": tolling, transit, telecommuting, and technology.
For the ITS Program, the Congestion Initiative offers an important opportunity to test the use of four complementary and synergistic strategies—tolling, transit, telecommuting, and technology (the "4Ts"). While the 4T strategies have been in use in major metropolitan areas, one of the strategies— congestion pricing or variable tolling based on demand—remains a somewhat controversial strategy. As a result, the UPA demonstrations represent a unique opportunity to understand whether urban travelers will find value in congestion pricing and demonstrate a willingness to pay for roadway use in exchange for guaranteed travel times and reduced congestion.
The ITS Opportunity
Advancements in ITS have greatly improved the strategic and technological capabilities related to congestion mitigation and/or avoidance. While the 4Ts have served for years in many of America's metropolitan areas, the primary purpose of the UPA/CRD is to demonstrate the effectiveness of deploying a combination of tolling, transit, telecommuting, and technology strategies for reducing congestion in an urban corridor or area.
The ITS Program's Congestion Initiative Approach
In 2007 and 2008, the Department awarded grants to six metropolitan areas for implementation of congestion reduction strategies under the UPA and CRD programs. The UPA and CRD programs are similar in many respects. The primary difference is in the feasibility and/or timeframe for potential implementation of these strategies. Participating cities are Chicago, Illinois; Los Angeles, California; Miami, Florida; Minneapolis/St. Paul, Minnesota; San Francisco, California; and Seattle, Washington.
The involvement of the ITS Program in the Department's Congestion Initiative is in two primary areas:
- Innovative technology applications
- Evaluation
Innovative Technology Applications. At each site, the ITS element is uniquely defined by the innovative technology components that are fundamental to achieving the goal of congestion reduction. Some of the principle innovative ITS applications include, for example:
- Real-time/congestion pricing
- ITS for transit and arterial traffic management
- Real-time parking management
- Active traffic management
- Real-time multimodal transportation information to travelers.
Evaluation. For evaluating the effectiveness of those strategies, US DOT selected a National Evaluation team, led by Battelle Memorial Institute, in April 2008. By promoting and funding demonstrations of congestion pricing and other strategies aimed at reducing congestion, the Congestion Initiative has taken a bold step in dealing with an important problem facing our metropolitan areas.
The key policy question driving the evaluations is whether the congestion reduction strategies will work. The following tables identify the objectives, the hypotheses, and analytical measures that define the focus of the overall evaluation analysis.
Each evaluation is designed to measure the benefits, impacts, and value of each metropolitan area's approach to congestion reduction. For each site, the following will be developed:
- Evaluation Strategy: The purpose of the evaluation strategy is to reach consensus among the demonstration site partners and US DOT on what should be evaluated and how. Using the national evaluation framework, preliminary hypotheses or questions tailored to the local conditions will be identified along with data requirements, risks, and is sues to be resolved.
- Evaluation Plan: This step documents the finalized hypotheses, measures of effectiveness (MOEs), and needed data, and identifies the detailed test plans that need to be developed. The roles and responsibilities of the demonstration sites' partners and the national evaluation team will be specified, as well as the needed resources and evaluation schedule. The table on the next page identifies the key hypotheses that will be tested for each of the 4Ts.
- Evaluation Test Plans: Each test plan will detail how the test will be conducted, and will identify the number of evaluation personnel, equipment, supplies, procedures, schedule, and resources required to complete the test.
Tolling
Congestion results from insufficient roadway capacity to serve peakhour demand. Such an imbalance stems from inefficient pricing, where the true costs of usage are not reflected in prices paid by the users. Tolling provides an opportunity to offer less congestion for a fee, and technological advances in variable tolling may offer incentives to drivers who are willing to adjust travel times, travel routes, or alternative modes.
Transit
Transit is an important component of a multimodal transportation system, particularly as a peak-hour alternative to the driving. Transit most commonly refers to public transportation, such as buses, ferries, and trains, but may also include rideshare and carpool programs.
Telecommuting
As an alternative to traveling to an office every day, many employers are taking advantage of computer networking and allowing employees to work from an off-site location. Telecommuting has the potential to reduce the number of peak-hour travelers while offering employees flexibility with regard to personal daytime scheduling.
Technology
Virtually all programs within the Congestion Initiative rely on advancements in technology. ITS technologies will support congestion pricing, improved system operations and performance, regional efforts to expand provision of real-time traveler information, improved traffic incident response, improved arterial signal timing, and reduced obtrusiveness of highway construction work zones.
- Data Collection: The evaluation data will be collected according to the methods defined in the test plans. The goal is to collect one year of pre-deployment (or "before") data and one year of post-deployment (or "after") data. The demonstration site is tasked with collecting the data, with the exception of the information on lessons learned, which the national evaluation team will gather.
- Data Analysis: The analysis of the data will be performed according to the approaches defined in the test plans. Some partial analyses may be performed at the start of the pre- and post-deployment periods to assess data quality and fix any data collection problems that might be identified. Where appropriate, a baseline analysis of the "before" data and a second analysis of the "after" data will be performed.
- Report Findings: A report for each site will incorporate the findings for all the analyses performed at the site. Additionally, a national report synthesizing the findings across all the demonstration sites will provide a comparative analysis of the performance of the congestion strategies that can aid policy and resource decisions at the Federal and local levels. By comparing the effectiveness of the congestion reduction strategies across all the demonstration sites, further insight can be gained into what works and why.
| US DOT Objective | Analysis |
|---|---|
| Congestion Reduction |
|
| Performance of the Strategy |
|
| Equity Impacts |
|
| Environmental Impacts |
|
| Impacts to the Movement of Goods |
|
| Business Impacts |
|
| Lessons Learned |
|
| Cost/Benefit |
|
| Hypotheses | Measures of Effectiveness | Data (before-after) | Data Source |
|---|---|---|---|
| Tolling | New HOT lanes will shift trips from the roadway to Bus Rapid Transit (BRT) Full-facility pricing on routes (e.g. Doyle Drive and SR-530) will shift trips from those facilities to transit Broad area pricing (in NYC) will shift recreational vehicle trips from roadways to transit |
|
• Automated passenger counters • Traveler surveys |
| Telecommuting | New HOT lanes will shift trips from the roadway to Bus Rapid Transit (BRT) Employer telecommuting programs will eliminate commute trips Employer transit incentives will shift commute person-trips from private auto to transit |
• Number of employees telecommuting • Employee commute mode split |
• Employee travel survey • Employer transit incentive program enrollment |
| Transit | Expanded BRT service will shift person-trips from private auto to BRT Transit vehicle lane guidance will allow buses to use shoulder lanes, thereby reducing transit travel times and increasing transit mode share |
• Travel times for buses shifted to HOT lanes • Traffic volumes • Bus ridership on routes/runs using HOT lanes |
• Bus vehicle location system data • Vehicle detectors • Automated passenger counters |
| Technology and Operations | Transit signal priority will reduce transit vehicle travel times, thereby increasing transit mode share Enhanced multimodal traveler information will promote mode shift to transit in targeted corridors |
• Transit travel times • Transit vehicle average signal delay • Traffic volumes • Bus ridership • Traveler information available • Traffic volumes • Transit ridership |
• Transit vehicle location system data • Vehicle detectors • Automated passenger counters • Traveler surveys |
The next two pages highlight the proposed ITS approach for each site.
Table 3.13: Congestion Initiative Sites and ITS Deployment Plans
Chicago, IL
• Development of dedicated BRT service along four downtown corridors.
• Pay-for-use charges on City of Chicago on-street loading zones, with prices varying by time of day or level of demand in a manner that both reduces traffic congestion and ensures reasonable availability of commercial loading zone space.
• Implementation of a peak period surcharge on off-street non-residential parking, and establishment of a system for variable-pricing downtown onstreet metered parking.
• The City of Chicago will enter into a long-term concession agreement for the operation, improvement, and maintenance of its metered parking system.
Los Angeles, CA
• Conversion of HOV lanes to dynamically priced HOT lanes on 61 miles of freeway (I-10 and I-110).
• Implementation of a wide range of transit investments to be determined later, which could include such projects as bus fleet acquisitions or park-and-ride facility improvements.
Miami, FL
• Conversion of not less than 21 miles of two HOV lanes in each direction along I-95 from I-395 in Miami to I-595 in Fort Lauderdale into variably priced HOT lanes with simultaneous increase in occupancy requirements from 2+ to 3+ persons.
• Expansion of transit capacity to enhance current express bus services and implement new BRT service within the HOT lanes, east-west on Hollywood/Pines Boulevard in Broward County, and between Broward and Miami-Dade Counties on US 441/SR 7 and SR 817 (University Drive).
• Improvements to the Golden Glades multimodal park-and-ride transit facility in Miami-Dade County.
Minneapolis, MN / Saint Paul, MN
• Expansion of existing HOV lanes on I-35W from Burnsville Parkway to 66th Street into dynamically priced HOT lanes.
• Addition of new dynamically priced HOT lanes on I-35W from 66th to 42nd Street as part of the reconstruction of the Crosstown Commons Section.
• Implementation of a priced dynamic shoulder lane on I-35W in the northbound direction from 42nd Street to downtown Minneapolis.
• Construction of six new or expanded park-and-ride lots.
• Purchase of 26 new buses and plans for operating new and expanded express bus service.
• Construction of two BRT stops/stations on Cedar Avenue.
• Construction of double contraflow bus lanes in downtown Minneapolis on Marquette and 2nd Avenues and improvement of sidewalks, lighting, landscaping, and passenger waiting areas.
• Construction of "Transit Advantage" bus bypass ramp from northbound Highway 77 to Westbound Highway 66.
• Implementation of ITS for transit, including bus arrival times, congestion conditions, parking availability, and transit signal priority.
• Development and implementation of lane guidance system for shoulderrunning buses.
• Installation of ITS technology to facilitate transit and arterial traffic management.
• Increase in the use of Results Only Work Environments and telecommuting throughout the region, including an increase of 500 teleworkers and/or flextime workers in the I-35W corridor.
San Francisco, CA
• Implementation of variable-price on-street and off-street parking in downtown San Francisco.
• Improvements to regional ferry boat service.
• Development of a simplified travel forecasting approach for a Very Small Starts project in the Grand/MacArthur BRT corridor.
• Introduction of integrated mobility accounts for travelers.
• Upgrades to hardware/software in key corridors leading to and throughout downtown San Francisco to improve the movement of traffic and transit vehicles.
• Upgrades to the regional 511 system to provide real-time pricing, parking, and transit information.
• Creation of a VII test bed along Doyle Drive.
• Expansion of the technical and promotional aspects of San Francisco's telecommuting and related alternative commute programs.
Seattle, WA
• Implementation of variable pricing on all through-lanes of SR-520 between I-5 and I-405 and, to the extent necessary to maintain free flow traffic in the through-lanes, on all collectors and distributors for SR-520 between I-5 and I-405.
• Use of advanced technologies to employ "active traffic management" along SR-520 and the LWC.
• Increase in transit capacity along SR-520 by enhancing express bus service and constructing transit improvements, including bus facilities (stops/station/terminals) and expansions to existing park-and-ride lots.
• Improvements to regional ferry boat service.
• Provision of real-time multimodal transportation information to travelers.
• Promotions to increase the use of telecommuting, flexible scheduling, and employer-based alternative commute programs within the region.
The Transportation Problem
In February 2008, the Department launched the Rural Safety Initiative Program (RSIP) to reduce highway fatalities and injuries on the Nation's rural roads. Rural roads carry less than half of America's traffic but account for more than half of the nation's vehicular deaths. According to the latest data from NHTSA's FARS, the fatality rate for rural crashes is more than twice the fatality rate in urban crashes. In 2006, 23,339 people were killed in rural motor vehicle crashes, accounting for 55 percent of all motor vehicle fatalities.46 In 2007, although the fatality rate dropped to 1.37 per 100 million vehicle miles traveled, it remains entirely too high.
The RSIP is designed to create a national focus on rural crashes. Rural crashes are more likely to be at higher speeds than urban crashes; victims of fatal crashes in rural areas are more likely to be unbelted than their urban counterparts; and it often takes first responders longer to arrive at the scene of a rural crash. Outdated roadway design and roadside hazards—such as utility poles, sharp-edged pavement drop-offs, and trees close to the roadway—are also are contributors to the rural crash severity.
The Rural Safety Initiative Approach
The RSIP will help states and communities develop ways to eliminate the risks drivers face on America's rural roads and highlight available solutions and resources. The new endeavor addresses five key goals: safer drivers, better roads, smarter roads, better-trained emergency responders, and improved outreach and partnerships. Approximately $287 million in existing and new funding has been dedicated in support of this effort.
The following summarizes the major components of the Department's Rural Safety Initiative:
• DOT Rural Youth Traffic Safety Competition. School- or community-supported youth organizations are eligible to compete in developing a traffic safety campaign aimed at rural youth. Prize money is to be used to support traffic safety activities or to provide scholarships to acknowledge student leadership. Representatives from the top three teams will win a trip to Washington, D.C. in December 2008 for a special award ceremony at the U.S. DOT.
• University of Minnesota as National Clearinghouse to Improve Rural Road Safety. The University of Minnesota will be home to a new national clearinghouse for information about the best way to make rural roads safer. The clearinghouse is part of a national strategy to renew the focus on safety of the Nation's rural roads.
• RSIP Awards. In August 2008, the Department gave 21 awards to 14 states, three counties, and two parishes to improve safety on rural roads. Twelve awards were made to rural communities with significant safety hazards that have identified high-impact, leading-edge ITS solutions. Of the $14.7 million in total awards, $5.4 million in ITS funds were awarded to eleven sites with known significant safety hazards. The recipients provided data on site crash history, likely causation, and a proposal for implementing specific high-impact, leading-edge ITS solutions (see Table 3.13).
Similar to the Congestion Initiative, the role of the ITS Program will be to work in cooperation with the Department and the awardees to conduct two key activities:
• Demonstrating the innovative application of proven technologies in improving rural safety.
• Evaluating the impact of ITS-based interventions at field test sites across the Nation.
Table 3.13 identifies the partners and locations of the ITS awards and summarizes their proposed leading-edge solutions. For evaluating the projects, the US DOT will select a National Evaluation team in late fall of 2008. Evaluating the projects will involve a combination of evaluation studies that first examine the performance of system components and then the system's impact on safety on local and rural roads. As part of the evaluation, both institutional and technical challenges and lessons learned will be addressed. The lessons learned are critical for successful replication and implementation of similar ITS-technology-based interventions as the US DOT strives to reduce transportation-related fatalities and injuries.
| Rural Safety Initiative Site Partner | Rural Safety Initiative Project |
|---|---|
| Arizona, I-10 | I-10 Severe Weather Warning System • A Dual Use Safety Technology (DUST) Warning System being developed to reduce the loss of life, injury, and property damage on rural I-10 in Cochise County. • System designed to focus on visibility hazards caused by blowing dust on a sixty mile segment of Interstate10 between Bowie and the New Mexico stateline, and unexpected snow and ice in the Texas Canyon area of I-10. |
| California, El Dorado County | El Dorado County: Intersection Safety Using ITS Technologies • Consists of two types of actively illuminated warning signs located on the east and westbound directions of U.S. 50 and a vehicle-detection pavement loop. • System automatically activates signs to graphically advise drivers on east and westbound U.S. 50 of the presence of approaching cross-traffic entering the highway. |
| California, San Joaquin County | San Joaquin County: Coordinated Speed Management in Work Zones • Integrating four components — Education, Engineering, Enforcement, and Emergency Medical Services — to reduce the number of speeding-related crashes on an undivided rural two-lane highway (Highway 12 in Northern California). • Investigating whether the deployment of an Augmented Speed Enforcement (ASE) system will change driver behavior and reduce crash rates. • System is differentiated from Automated Speed Enforcement (ASE) by using real-time information about speed violators to support on road enforcement actions by California Highway Patrol (CHP). |
| Colorado, Freemont County | Freemont County: Speed Information on Approach to Curves on US 50 • Implementing a truck tip-over warning system on U.S. 50, a rural, low-volume roadway with low-speed curves and will warn motorists of their speeds before reaching the curves. • Anticipated that system will reduce vehicle accidents and increase vehicle compliance with the posted speeds approaching the curves. |
| Colorado, Wolf Creek Pass | Speed Management on US 160 Wolf Creek Pass Snow Shed • Developing in-road light-emitting-diode (LED) lighting and dynamic speed messaging signs in advance of the US 160 Wolf Creek Pass snow shed. • In-road LED lighting that illuminates and delineates the roadway centerline and reduce wall impacts and crossover accidents in the snow shed. • Project also includes dynamic speed messaging devices that warn drivers to reduce their travel speed to decrease the likelihood of over-driving the curve in the snow shed resulting, in lane departures. |
| Illinois | Vehicle-Actuated Advanced Warning on Curves • Installing vehicle actuated advanced curve warning LEDs over diamond grade sheeting, doubled up on both sides of the roadway to alert motorists of changing roadway conditions at curves. |
| Iowa | Traffic and Criminal Software Improvements • Developing a web-based version of the Traffic and Criminal Software (TraCS). • TraCS, the Incident Location Tool (ILT) and the Incident Mapping Tool (IMAT) will be modified to make them more easily available to rural law enforcement agencies to help them use crash data locally and submit it to the State. • Goal of system is to electronically transmit and load the data into the State's statewide crash database, so that the local law enforcement agencies are able to print a copy and query their crash data to generate reports and create pin-maps. |
| Kansas, U.S. 75 | Dynamic Message Signs and Road Weather Information System • Implementation of one RWIS, one CCTV, and two portable DMS at the intersection of U.S. 75 and Tribal Road 150; and flashing beacons and queue detection systems at two other locations along U.S. 75. |
| Minnesota | Installation of Dynamic Curve Warning Systems • Implementing a dynamic curve warning system (DCWS) that helps drivers select the appropriate speed when approaching a horizontal curve. • DCWS consists of a warning sign combined with a speed measuring device (e.g., radar) that displays a warning message (e.g., slow down) when vehicles are traveling above a set threshold. • Technologies used to create a DCWS are currently available and the devices have been implemented at various locations. |
| South Carolina, Greenville County | US 25 Greenville County: Decrease Hydroplaning Using Multiple ITS Technologies • Implementing a number of innovative technology-oriented solutions to improve safety and reduce speed-related crashes, wet weather-related crashes, and roadway departure crashes on a two-mile segment of rural US 25 in Greenville County. • System components include overhead variable message signs, video cameras, variable speed limit signs, radar speed detection and pavement sensors. |
| Washington, King County | King County: Advanced-Curve-Warning and Driver-Feedback Signs • Implementing two driver-feedback signs that activate when a vehicle is detected and displays the vehicle's speed at two sites. • Utilizing radar to measure the vehicle's speed. • Flashing when the measured speed is above the advised speed. |
| Wisconsin | Rural Thru-Stop Intersection Crash Prevention • Demonstrating and validating a new Rural Intersection Collision Avoidance System, using cutting-edge sensing, computation, and display technologies to provide real-time warnings to drivers in advance of dangerous conditions. |
3.4 Ongoing ITS Research Programs
SAFETEA-LU provided the Department with direction to continue a set of research and implementation programs related to important priorities for: implementation of traveler and commercial vehicle information systems; longdistance travel planning and corridor management; road weather research; rural communications systems for transportation and economic viability; and the deployment and testing of a sensor-rich transportation system to study the impacts on security, evacuation, and traffic conditions. In response, the ITS JPO and its modal partners structured the following projects that continue important research for the Department:
3.4.1 Deployment of and technical guidance to the National 511 Program in partnership with FHWA.
3.4.2 Deployment of the Commercial Vehicle Information Systems and Networks (CVISN), in partnership with FMCSA (Federal Motor Carrier Safety Administration).
3.4.3 Management and evaluation of the I-95 Corridor Congressional appropriation.
3.4.4 Continued research under the Road Weather Research Program in partnership with FHWA.
3.4.5 The Rural Interstate Corridor Communications Study conducted in partnership with the FHWA.
3.4.6 The Surface Transportation Security and Reliability Information System Model Deployment, also known as iFlorida in partnership with FHWA.
Program Purpose
The National 511 Program was established in 1999 and continued under SAFETEA-LU to further the creation of a network of multijurisdictional, interoperable, uniform, 511 systems that provide up to date, accessible, and relevant transportation information for travelers.
The purpose of the 511 service is to provide important travel information to users via a single, predictable, and easy-to-remember number. 511 is the Federally designated telephone number for traveler information available nationwide.
511 services include:
• Real-time reports on road closures, blockages, roadwork, traffic problems, highway construction, and other road-related issues
• Weather-related road condition reports
• Transit and rideshare information
• Traveler reference materials such as maps, schedules, and traveler information
Prior to establishment of the 511 service, over 300 different travel information telephone numbers existed nationally. In 1999, the Department petitioned the Federal Communications Commission (FCC) for a three-digit number for travel information. In 2000, the FCC designated the 511 number for national traveler information. The intent of the program is to establish 511 nationally using a bottom-up information-sharing approach through a cooperative dialogue among national stakeholder associations. To provide accurate, critical travel information to a broad range of travelers, the 511 service strives to be easily accessible, predictable, and simple to use.
The design and implementation of the 511 service and supporting systems presented initial challenges. To address these issues, the ITS program, in partnership with FHWA and FTA, worked closely with early 511 adopters in States, regions, and cities; with utility companies; and with agencies to find the appropriate strategies. The ITS program offered financial assistance of up to $100,000 to each State to help overcome institutional challenges and convert existing telephone numbers. This assistance program acted as a catalyst for 25 systems to begin service within five years of the FCC designation. The use of the services increased rapidly because of successful marketing and advertising. For example, in September 2005, users made over 1.1 million calls to 511; in April 2006, nearly 50 million calls were made. In March of 2008, over 2.3 million calls were made to the system. Though such trends are encouraging, they underscore a need for swift and continued development and integration of the system on a national and interregional level.
Despite the success of the 511 concept, there are ongoing research challenges. These include issues related to:
• Digital convergence. The 511 system is poised to become the Nation's premier access point for traveler information services. However, it is limited by traditional communications models that seek to serve customers through voice-based content or radio. With the support of the ITS Program and the 511 Deployment Coalition, the system is broadening its scope of services beyond conventional phone calls. This convergence will allow new opportunities for creative public-private business models for 511 branded services and will bring the program to the forefront of 21st-century communication capabilities.
• Content versus ease of use. Transportation agencies are improving their abilities to generate information on the status of the transportation system. However, the phone-user interface is not yet capable of easily providing large amounts of data. 511 deployment must consider how to include elements such as congestion and speed data without overwhelming the caller. The system faces the question of how best to balance informational content with user simplicity.
Subtitle B, Section 1201(a)(1): CONGESTION RELIEF
Section 1201 directs the establishment, in all States, of real-time incident reporting systems and interoperability between State systems. These systems form the foundation, in most cases, for a quality 511 service:
(1) IN GENERAL - The secretary shall establish a real-time system management information program to provide, in all States, the capability to monitor, in real-time, the traffic and travel conditions of the major highways of the United States and to share that information to improve the security of the surface transportation system, to address congestion problems, to support improved response to weather events and surface transportation incidents, and to facilitate national and regional highway traveler information.
(2) PURPOSES - The purposes of the real-time system management information program are to - (A) establish, in all States, a system of basic real-time information for managing and operating the surface transportation system;
(B) identify longer range real-time highway and transit monitoring needs and develop plans and strategies for meeting such needs; and
(C) provide the capability and means to share that data with State and local governments and the traveling public.
Section 5306(b)(3)(B): RESEARCH AND DEVELOPMENT
Section 5306 directs that priority be placed on activities:
(B) ensuring that a national interoperable 5-1-1 system, along with a national traffic information system that includes a user-friendly comprehensive website, is fully implemented for use by travelers throughout the United States by September 30, 2010.
• Interoperability. Similar to the NG9-1-1 Initiative, new technologies such as Voice-Over-Internet Protocol (VoIP) are adding complexity to the call routing for 511 services. For instance, the new IP phones can move to various locations without the "network" knowing the caller's location, making call routing to the proper 511 service virtually impossible. Nationally, the FCC has prioritized addressing this issue through Wireless Enhanced 9-1-1 services. The 511 Deployment Coalition has also initiated conversations with leading VoIP service providers to determine how best to support 511 call routing.
Program Approach
The ITS Program and FHWA continue to partner closely with the 511 Deployment Coalition and other national associations, supporting efforts to unify and encourage growth of the service in State and metropolitan areas. In cooperation with other major initiatives, the program seeks to develop synergies with other research efforts. Two examples are the link to the Clarus system for weather reporting information services and the link with the Road Weather Research Program to provide maintenance data on road treatments.
By providing technical and financial assistance, the ITS Program and FHWA encourage and assist jurisdictions in developing and deploying 511 systems. In addition, the 511 Deployment Coalition published a variety of reports and technical guidance resources to expand on system guidelines for development and issues related to the deployment, planning, enhancement, and evaluation of 511 systems. The following areas of 511 deployment are supported through detailed reference materials:47
• Business models and cost considerations — Guides the development of State 511 systems.
• Transfer of 511 calls to 9-1-1 — Addresses the privacy and legal issues associated with creating a transfer system to 9-1-1 emergency services when required by 511 callers.
• 511 and homeland security — Explores the role that 511 services play in homeland security emergencies, alerts, and emergency response management strategies.
• Consistency guidelines — Defines the interface used to provide information to callers and the ease of access that callers have to specific information once a call is made.
• Regional inter-operations issues —Creates a vision for providing callers with information outside of the region from where they place the call to ensure the transmission of traveler information between metropolitan areas or across state borders in one call.
• Public transportation content on 511 services — To best serve the traveling public, information on public transportation is a basic category of data to include in 511 services.
Program Accomplishments to Date
The 511 system has grown to include forty-three 511 services available to the traveling public that operate in 34 states and two Canadian provinces. Figure 3.76 illustrates 511 deployments that were live in 2008 and those that are expected to go live in 2009. Currently, 511 services are accessible by 56 percent of the U.S. population. With the completion of systems under development, 70 percent of the U.S. population will have access to 511 services in 2009.48
Research shows 511 increases use of traveler information services Research indicates that public demand and use of telephone services for traveler information increase when systems use 511 instead of other numbers. Systems that have converted existing telephone numbers to 511 have experienced a 300- 500 percent increase in call volume.
One study showed that 45 percent of San Francisco area travelers who received information from the area's Travel Advisory Telephone System changed their travel plans, compared to 25 percent of travelers who altered their plans based on television or radio broadcasts.
User benefits include:
• Provides an easy way to obtain travel information anywhere in the country.
• Helps travelers make better decisions on travel routes and modes.
• Promotes safety by directing motorists away from incidents and congestion.
Program Outcomes
The Nation is coming to rely on the 511 system particularly during times of inclement weather. Significant statistics as of May 2008 include:
. Since the initial 511 system launch in 2001, more than 112 million calls have been made nationwide.
. There have been 2,380,004 total calls.
. There are 41 consecutive months with over one million calls and two consecutive months with over four million calls.
. 511 service is available to more than 128 million Americans (47%) and almost one million Canadians (3%).
. Forty-three 511 are services available to the traveling public in 33 states and two Canadian provinces.
. Seventeen 511 systems have websites designed specifically for use with PDAs.
. Thirty states have specific 511 websites.49
. Twenty 511 systems provide transit information.50
. Twelve reports have been published containing guidance on developing, deploying, and enhancing 511 systems.51
. Twenty million calls made to San Francisco Bay area 511, which typically has the highest call volume.
The ITS Program and FHWA continue to support the 511 Deployment Coalition in researching the issues involved in continued deployment and development of a nationwide 511 system. The SAFETEA-LU goal for the ITS Program and its continued support of the 511 system is to ensure deployment of a national traveler information system that provides user-friendly comprehensive websites and telephone services available across the Nation.
Program Purpose
Commercial Vehicle Information Systems and Networks, or CVISN, is a term that refers to a collection of information systems and communications networks owned and operated by governments, motor carriers, and other stakeholders that support commercial vehicle operations (CVO). CVO includes the operations and regulatory activities associated with moving goods and passengers via commercial vehicles.
To effectively facilitate the seamless exchange of critical information in support of efficient CVO (for instance, information on safety, credentials, and tax administration), CVISN provides a framework or "architecture" that assists transportation agencies, motor carrier organizations, and other stakeholders in planning and deploying integrated networks and systems. In SAFETEA-LU, Congress directed the responsibility for the execution the CVISN Program to the Federal Motor Carrier Safety Administration (FMCSA) with the establishment of a new CVISN Deployment Program contained in the Motor Carrier Safety Title.52 SAFETEA-LU provides FMCSA with funding over a-four year period to support CVISN planning and deployment efforts. The ITS Program remains an important partner with FMCSA to ensure that technological advances, updates to the National ITS Architecture, and other research that might impact CVISN are incorporated and leveraged by the CVISN Program.
SEC. 4126. COMMERCIAL VEHICLE INFORMATION SYSTEMS AND NETWORKS DEPLOYMENT
(a) IN GENERAL.—The Secretary shall carry out a commercial vehicle information systems and networks program to—
(1) improve the safety and productivity of commercial vehicles and drivers; and
(2) reduce costs associated with commercial vehicle operations and Federal and State commercial vehicle regulatory requirements.
(b) PURPOSE.—The program shall advance the technological capability and promote the deployment of intelligent transportation system applications for commercial vehicle operations, including commercial vehicle, commercial driver, and carrier-specific information systems and networks.
(c) CORE DEPLOYMENT GRANTS.—
(1) IN GENERAL.—The Secretary shall make grants to eligible States for the core deployment of commercial vehicle information systems and networks.
(2) AMOUNT OF GRANTS.—The maximum aggregate amount the Secretary may grant to a State for the core deployment of commercial vehicle information systems and networks under this subsection and sections 5001(a)(5) and 5001(a)(6) of the Transportation Equity Act for the 21st Century (112 Stat.420) may not exceed $2,500,000.
(d) EXPANDED DEPLOYMENT GRANTS.—
(1) IN GENERAL.—For each fiscal year, from the funds remaining after the Secretary has made grants under subsection (c), the Secretary may make grants to each eligible State, upon request, for the expanded deployment of commercial vehicle information systems and networks.
(2) ELIGIBILITY.—Each State that has completed the core deployment of commercial vehicle information systems and networks in such State is eligible for an expanded deployment grant under this subsection.
(3) AMOUNT OF GRANTS.—Each fiscal year, the Secretary may distribute funds available for expanded deployment grants equally among the eligible States, but not to exceed $1,000,000 per State.
(4) USE OF FUNDS.—A State may use funds from a grant under this subsection only for the expanded deployment of commercial vehicle information systems and networks.
(e) ELIGIBILITY.—To be eligible for a grant under this section, a State—
(1) shall have a commercial vehicle information systems and networks program plan approved by the Secretary that describes the various systems and networks at the State level that need to be refined, revised, upgraded, or built to accomplish deployment of core capabilities;
(2) shall certify to the Secretary that its commercial vehicle information systems and networks deployment activities, including hardware procurement, software and system development, and infrastructure modifications—
(A) are consistent with the national intelligent transportation systems and commercial vehicle information systems and networks architectures and available standards; and
(B) promote interoperability and efficiency to the extent practicable; and
(3) shall agree to execute interoperability tests developed by the Federal Motor Carrier Safety Administration to verify that its systems conform with the national intelligent transportation systems architecture, applicable standards, and protocols for commercial vehicle information systems and networks.
CVISN includes all ITS/CVO information systems and networks. The CVISN Architecture is a document that builds on the National ITS Architecture and adds detail that is required to address and facilitate CVO (see Figure 3.77). This architecture provides a framework that serves as blueprint for stakeholders in the CVO community to:
• Guide development of information and management systems with related standards that allow for community-wide interoperability;
• Describe requirements; and
• Provide implementation guidance for how systems can support operational strategies and new CVO services.
CVISN is an important element in addressing key challenges confronting Federal and State governments and the motor vehicle industry in meeting the demands of freight movement faced by our Nation. These demands include:
• The commercial vehicle industry is growing but has limited resources.
• Governments face the challenge of ensuring the safe and secure movements of goods, coupled with the need to improve the productivity and mobility of the commercial vehicle industry to support key economic sectors and improve customer service. Issues that hamper productivity include:
• State infrastructure and resources needed to conduct enforcement/regulatory activities are "overwhelmed" in many states.
• There is a lack of information-sharing across jurisdictional lines and in some cases among agencies in the same jurisdiction.
• Expected future pressures on the system include53:
• Freight volume that is expected to double by 2035.
• Truck vehicle miles traveled that are forecast to increase 60 percent by 2020.
Use of the CVISN Architecture for planning and deployment enables agencies and the motor carrier industry to integrate systems to share data. Working together in this manner greatly leverages the capability of the individual systems, allowing agencies and firms to accomplish more than they could independently and in a more cost-effective and timely manner.
Program Approach
In 1994, the ITS Program and FMCSA established a National Deployment Strategy for CVISN. During the past fourteen years, the CVISN Program has provided technical assistance, workshops, and tool kits to participating states to aid in their planning for CVISN deployment. Additional grant programs authorized under SAFETEA-LU through FMCSA are providing $100 million in deployment funds to support implementation of CVISN functionality.
There are two levels of CVISN functionality for States and motor carrier firms: Core CVISN and Expanded CVISN. Core CVISN functionality provides specific capabilities in the following three areas:
• Safety information exchange: Provides improved electronic exchange of safety information among roadside and office-based State and Federal systems by facilitating the collection, distribution, and retrieval of motor carrier safety information at the roadside. These data help Federal and State enforcement staff focus scarce resources on high-risk carriers and drivers, which in turn helps to reduce the number of crashes involving commercial vehicles.
• Electronic credentialing: Provides an electronic transaction capability for registration, administration of fuel taxes, permitting, and other functions to allow commercial vehicles that maintain good safety and legal status to bypass roadside inspection and weigh stations, saving time and money for participating carriers, and allowing States to devote more resources toward removing unsafe and noncompliant carriers.
• Electronic screening: Uses advanced technologies to identify trucks as they approach roadside weigh or inspection stations and to allow safe and legal vehicles to bypass such stations without slowing down or stopping. The capability assists in the near-real-time elements of electronic submission, processing, approval, invoicing, payment, issuance of credentials, electronic tax filing and auditing, and participation in clearinghouses for electronic accounting and distribution of registration fee payments among States.
Expanded CVISN leverages the functionality of the Core CVISN systems to provide further capabilities for:
• Driver Information sharing: Partners established, maintained and provided controlled access to snapshots of driver information and use them for enforcement, licensing, hiring, and other processes that require information about drivers. Jurisdictions would improve the access of enforcement agencies and carriers to driver information to better target high-risk drivers. • Enhanced safety information sharing and data quality: Partners would establish measures for data timeliness, accuracy, and integrity, especially for those data elements used in determining safety ratings or making decisions. Partners would regularly check data used in the CVISN process for quality, purge stale data, and correct errors. Federal and State agencies would enhance carriers' ability to review safety-related data in a timely manner.
• Smart roadside: Roadside personnel would have improved, integrated access to data stored in Federal and multistate systems such as the Safety and Fitness Electronic Records (SAFER) System, the Motor Carrier Management Information System (MCMIS), and Commercial Driver's License (CDL) data systems. Jurisdictions also would expand the deployment and capabilities of virtual or remote sites to increase the effectiveness of enforcement.
• Expanded electronic credentialing: Jurisdictions would improve access to current credentials information for authorized stakeholders, reduce complexity and redundancy for users by offering access to multiple credentials from a single source, and increase the kinds of e-credentials that are available, such as oversize/overweight and hazardous materials permits.
Figure 3.78 illustrates the electronic vehicle screening capability that is part of Core CVISN electronic screening capability. It shows information exchanges that occur to receive approval to bypass a weigh station, allowing carriers to save time and money and allowing for more timely delivery of cargo.

To implement CVISN and integrate CVISN capabilities with existing systems, States go through a two-phased process:
• A planning and deployment phase for Core CVISN that establishes:
• An organizational framework among State agencies and motor carriers for cooperative system development; and
• A State CVISN system design that conforms to the CVISN architecture and can evolve to include new technology and capabilities; at this point States are considered Core-compliant.
• A planning and deployment phase for Expanded CVISN that establishes:
• Enhanced and expanded information-sharing and an increase in the safety, security, and productivity of commercial vehicle operations; and
• Improved access to and quality of information collected on commercial drivers, carriers, vehicles, chassis, cargo, inspections, crashes, compliance reviews and citations to assist authorized public and private sector users.
Grants are available to states for both core CVISN deployment ($2.5 million per State) and expanded CVISN deployment ($1 million per State).
FMCSA also supports ongoing activities to measure and evaluate the effectiveness of the CVISN deployments, individually and collectively, and to disseminate the results of these evaluations to all stakeholders. These evaluations and outreach activities are intended to aid the US DOT and participating States in recognizing innovative or successful approaches to CVISN deployment and to present a coherent account of the achievements of CVISN at a national level. Evaluations also help US DOT plan for future deployments and infrastructure investments and apply resources to programs, technologies, and strategies that are performing well.
Program Accomplishments To Date
CVISN grants have effectively moved States forward with their CVISN plans—every State and the District of Columbia have deployed some element of the CVISN Program. As shown in Figure 3.79:
• 20 states have an Expanded CVISN; they have completed their Core CVISN planning and deployment and are engaged in adding on the expanded functionality.
• 25 states and the District of Columbia are in the CVISN Core deployment phase.
• 5 states are in the CVISN Core planning and design phase.
Additional statistics on CVISN deployment include:
• 37 States and 3 Canadian Provinces have deployed electronic screening programs.
• There are 355 e-screening sites in the Nation.
• Over 520,000 commercial vehicle carriers have enrolled in an e-screening program.
• Approximately 30 states have developed a Commercial Vehicle Information Exchange Window (CVIEW) or its equivalent, a State-specific data-exchange system that stores interstate and intrastate carrier and vehicle information.
• At least 23 states are currently sharing credential data with the national Safety and Fitness Electronic Records (SAFER) system, which provides a snapshot to industry professionals and the public sector on a company's identification, size, commodity information, and related safety information. These 23 States administer over 900,000 interstate commercial vehicle registrations. States have deployed electronic credentialing for the International Fuel Tax Agreement (IFTA) and/or International Registration Plan (IRP).
FMCSA provides continued technical assistance and oversight to ensure consistent deployment and to address challenges.
Program Outcomes
CVISN has been deployed successfully at various levels across the United States. Several studies commissioned by the FMCSA have examined the benefits of CVISN deployment. The table below summarizes some of the most common outcomes associated with program operation and shows who receives the benefits. These results represent a mix of safety benefits (i.e., targeted enforcement, improved use of enforcement resources, real-time access to safety and credentialing data) as well as productivity and customer service improvements (i.e., improved turnaround time for permits, improved accuracy on credentials).
| CVISN Benefits Summary | Benefit Applies to | |
|---|---|---|
| Carrier | State | |
| Targeted enforcement focused on high-risk carriers and vehicles | X | X |
| More effective use of roadside enforcement resources | X | |
| Real-time access to online data at fixed inspection facilities and by mobile units | X | X |
| Improved access to credential and safety information from other jurisdictions | X | |
| More efficient and cost effective processing of credential applications | X | X |
| Improved customer service / Ability to receive select credentials 24/7 | X | X |
| Improved accuracy and timeliness in credentials process | X | X |
A National CVISN Evaluation conducted in 2007 produced important insights into how CVISN impacts motor carrier safety and efficiency for both States and carriers. In conjunction with FMCSA planners and state CVISN program managers, five overall goals were set for the evaluation:
(1) Measuring the effects of CVISN technologies on the safety of trucks and the general traveling public, through improved roadside enforcement and administrative processes;
(2) Measuring and analyzing the costs of deploying and operating CVISN technologies in several typical configurations;
(3) Comparing the national costs of deployment versus the benefits realized through improved efficiency, improved safety, and reductions in other costs;
(4) Enabling States to estimate the costs and benefits particular to their CVO setting; and
(5) Documenting and analyzing the attitudes of motor carriers regarding CVISN deployment.
Two important areas of results are worth highlighting:
. The results of statistical modeling employed to estimate the nationwide safety benefits of deploying CVISN technologies in several configurations. The analysis used available historical safety, crash, and inspection data plus field observational data.
. Benefits and lessons learned reported by States.
To understand the effectiveness and potential impact of CVISN on motor carrier crash rates, modeling of several configurations of CVISN was conducted. The safety benefit of CVISN technologies is determined by using a probability model to compare the number of crashes avoided under a baseline scenario (i.e., with pre-CVISN roadside enforcement, strategies, and technology) with the number of crashes avoided under a number of deployment scenarios involving CVISN.54
The report establishes a baseline that determines that current roadside enforcement strategies are responsible for avoiding 3,139 crashes annually, which translates to 0.7 percent of the 441,000 truck-related crashes nationwide. The baseline strategy includes inspectors selecting commercial vehicles for inspection using personal experience and judgment without the aid of most CVISN technologies. From this baseline, the model generated the following results:
. The addition of electronic screening and inspector selection of vehicles based on a carrier's inspection selection system (ISS) score with the baseline strategy provides the potential to avoid an additional 1,004 crashes annually. An ISS system uses historical motor carrier data or, in some cases, lack of any data, to recommend inspection of a vehicle or driver.
. The additional use of high vehicle and driver out-of-service (OOS) violation rates with baseline strategies could avoid 7,795 crashes nationally, 4,656 fewer crashes than the baseline scenario.
. Using high brake-violation or driver OOS rates could result in 15,530 crashes avoided, 12,391 fewer crashes than the baseline scenario.
. The maximum benefit potential is achieved with electronic screening based on infrared screening and a high driver OOS violation rate. Under this configuration, 21,046 crashes are avoided if the top five percent of violators are identified and inspected in conjunction with infrared screening for brakes. About 4.8 percent of the nation's 441,000 annual truck-related crashes could be avoided with the nationwide deployment of CVISN and improved targeting of enforcement resources.
Benefits and Lessons Learned from CVISN Deployment
As part of the National CVISN Evaluation, surveys were conducted with States to understand how they viewed their experiences, lessons learned, and benefits. The responses show an overall favorable opinion on CVISN in participating States while acknowledging that there have been some technical and institutional hurdles to surmount. Examples include:
. With regard to IFTA credentialing, one respondent noted:
The automated renewal process has increased the efficiency of State staff and reduced carrier workload. The web-based application process has made it easier and less time consuming for a carrier to apply, and it has improved data quality.
. When asked if the deployment of CVISN had freed up State employees for other duties, several respondents reported that employees are now able to focus more on functions such as inspections, customer service, data processing and analysis, planning, and training. One respondent said:
Electronic credentialing has reduced the [time required for] data entry by at least 80 percent, and the time for issuing credentials has been reduced from three days to one hour.
. The computer-based technologies of CVISN have increased both the volume and breadth of data available to States in the office and at the roadside. In addition, the transition from previous (legacy) administrative and safety information systems to CVISN systems has brought out problems in data quality and consistency. These likely existed previously but now are much more visible. When asked about the relationship of CVISN to the persistent issue of data quality, one respondent said:
CVISN deployment has highlighted data quality problems and the need to address them. For example: (1) Loading our CVISN database brought to light problems with inconsistencies between US DOT numbers and State account numbers. These problems were addressed to ensure consistency. (2) Reviewing bridge and highway data for use in automated routing highlighted data discrepancies that are now being resolved and spurred an effort to set a new policy for timeliness of data updates.
. With regard to the use of national ITS Standards and the CVISN Architecture intended to govern and unify inter-state information systems and networks, one respondent provided both pros and cons encountered in maintaining consistency with ITS standards:
Consistency has been valuable in some areas and a problem in others. It has been valuable in areas where there is national leadership and a common view on how to accomplish specific goals. It has been problematic where there is less Federal leadership and where States have vastly differing views on how to accomplish specific goals.
Washington State has been a leading adopter of CVISN systems since 2004. The Washington DOT has reported a number of benefits associated with its program, some of which are listed below.
Safety
. Law enforcement is able to concentrate its efforts on high-risk and non-inspected carriers and operators, resulting in more OOS orders for the same number of inspections performed.
. There is increased compliance as a result of improved enforcement.
. An estimated 600 commercial-vehicle-related crashes could be avoided per year with the use of both ISS and electronic screening. With these systems, there will be fewer trucks entering and exiting weigh stations, reducing the risk of crashes caused by these movements.
Simplicity
. Simplified, automated screening and targeting of high-risk operators improves enforcement efficiency.
. Standardized data exchange makes for simpler, more efficient workdays for participating motor carriers, drivers, and regulators.
. Motor carriers can more quickly obtain information from regulatory and enforcement agencies.
Savings
. It is estimated that the operating cost of a commercial vehicle is $1.25 per minute and that an average stop at a weigh station is five minutes. The use of electronic inspection and screening systems can save the industry approximately 79,000 hours of travel time and five million dollars.
. CVISN helps deter tax evasion.
. Automated reporting and record keeping technology reduces costly paperwork for government and motor carriers.
. Carriers that pay their drivers by the hour can save time and money through reduced labor costs from electronic screening at weigh stations.
Program Purpose
The I-95 Corridor Coalition is an alliance of transportation agencies and related organizations from Maine to Florida. The Coalition provides a forum for policy makers and transportation officials to discuss and address transportation management and operations issues of common interest across multiple jurisdictions and modes. The Coalition began in the early 1990's as an informal group of transportation professionals working together to more effectively manage major highway incidents that impacted travel across I-95. In 1993, the Coalition was formally established under the IVHS Corridors program established by ISTEA.
During the 1990s, the Coalition's perspective evolved from a concentration on highways to one that encompasses all modes of travel and focuses on the efficient transfer of people and goods between modes. The extreme congestion and limited capacity to expand I-95 makes Intelligent Transportation Systems (ITS) an essential component to maintaining the regional and economic vitality of the corridor. The Coalition uses "innovative technology, improved coordination and cooperation, system integration, incident management and new approaches to shared communication to provide a seamless and responsive transportation network."55
The Coalition is continually working to create an effective approach to an ever-changing political and technological landscape, with particular emphasis on:
I-95 Corridor Facts
• The Corridor contains 37 percent of the U.S. population in 10 percent of the U.S. land area.
• The Corridor is three times more densely populated than US as whole.
• The Corridor accounts for 35 percent of the National vehicle miles traveled (2001).
• The Corridor carries over 500 billion longdistance trips, annually.
• The Corridor congestion amounts to 1.2 billion hours and $24 billion lost (2001).
• Evolving national priorities: The Coalition seeks to continually expand its perspective as regional and national priorities evolve.
• Inter-jurisdictional coordination: The Coalition accelerates coordinated system management and operations by facilitating deployments of crossjurisdictional and multimodal programs and services.
• Information management: Effective information management is critical to the Coalition's ability to meet the needs of member States and agencies.
The Coalition:
• Provides ITS information regarding:
. System management and operations
. Road conditions for long-distance travelers
. Support for investment decisions
• Encourages information exchange through the adoption of common standards and procedures.
• Research: The Coalition strives to develop applied research to help implement new initiatives and enhance existing operations in the corridor.
(b) INTERSTATE ROUTE 95 CORRIDOR COALITION TRANSPORTATION SYSTEMS MANAGEMENT AND OPERATIONS.—The Secretary shall make grants under this subsection to States to continue intelligent transportation system management and operations in the Interstate Route 95 corridor coalition region initiated under the Intermodal Surface Transportation Efficiency Act of 1991 (Public Law 102-240).
The Coalition is funded by the ITS JPO through an annual set-aside in SAFETEA-LU, Section 5211(b).
Program Approach
The I-95 Corridor Coalition is best described through its website at: www.i95coalition.net. The strength of the Coalition lies in its ability to provide objective analysis in order to address transportation problems in a manner that transcends individual organizations. The Coalition's approach is based on 4Cs—Consensus, Coordination, Cooperation, and Communication:
• Consensus—Coalition decision-making is based on consensus of its members. No member has any more clout than any other. This approach ensures that the Coalition's work continues to meet the needs of its member organizations.
• Coordination—Traffic management, law enforcement, and other incident response personnel assist each other when major incidents occur by sharing information and equipment. They meet regularly to discuss how emergencies can be handled more effectively.
• Cooperation—All Coalition member agencies volunteer their staff time. The value of the work drives further contribution. This model works because of the cooperation among members to keep the Coalition productive and relevant.
• Communication—One of the keys to the Coalition's success is frequent contact between members. This helps develop strong inter-personal relationships that are necessary for consensus, coordination, and cooperation.
Using recommendations from its standing committees, the Coalition establishes an annual work plan for funding projects. Over the past 15 years, the Coalition has commissioned hundreds of applied research projects. In 2008, the Coalition commissioned 17 new and ongoing projects that include travel information dissemination, coordinated operations, intermodal transportation, education and training, commercial vehicle operations, electronic payment services, information systems, and safety.
Three recent and important projects are highlighted below. They illustrate the significance of a coordinated approach to transportation management. The first project highlighted below emphasizes the importance of the Coalition's commitment to the application of innovative new technologies.
• Data Collection and Quality. In December 2007, the I-95 Corridor Coalition launched a ground-breaking initiative, the Vehicle Probe Project. The "vehicle as a probe" concept makes use of GPS and cellular technologies to obtain travel times and road speeds by detecting the vehicle location, speed, and trajectory. The objective of the project is to assess the ability to provide comprehensive and continuous real-time travel information (travel times and speeds) using vehicle probes, to test the quality of the vehicle probe data, and to explore whether vehicle probe data can be a primary source of data for both freeways and arterials as well as multi-state corridor operations. The I-95 contract for this project was awarded in January 2008. As of September 2008, traffic data was being provided for the core area extending through five states from New Jersey through North Carolina. The project also provides the Coalition with an opportunity to evaluate how well a subscription traveler information service business model works for this type of activity.
Member agencies will benefit from the Probe Project by receiving travel times and speeds to support the dissemination of traveler information through 511, and websites, and display of travel times on variable message signs; and deliver of traffic management information during incidents. Coalition members will also be able to use this opportunity to expand travel data coverage within their jurisdictions and on arterial streets and to develop corridor-wide websites that interface with existing traffic management systems. The system will initially cover a network of approximately 1,500 miles of freeway and 1,000 miles of arterial roads. Coalition funding is planned for the first three years of the ten year contract, with supplemental funding to be provided by Coalition members based on the success of the project and its critical role in corridor operations.
The ITS JPO is working closely with the Corridor Coalition to measure the quality and usefulness of the data and to monitor benefits of using vehicles as traffic probes. The results of this project will inform research being done with the FHWA and State and local transportation agencies to better understand data needs for effective system management.
• Commercial Vehicle Operations. Commercial vehicle operations are a critical component of I-95 Corridor operations. The ability to move freight safely and efficiently has an impact on the safety of all corridor travelers as well as an enormous economic impact for the member states throughout the Corridor. With the recognition that the VII concept could play a vital role in addressing commercial vehicle operations, the I-95 Corridor Coalition has structured a project to focus on the integration of commercial vehicle applications into the VII Initiative, the development of safety and mobility applications, and outreach necessary to engage the commercial vehicle industry as active stakeholders. The project will demonstrate the integrated collection and transmission of information among drivers, vehicles, and infrastructure in a real-world, 13-mile test site on the NYS Thruway Authority Spring Valley Corridor. The project is expected to start in Fall of 2008.
• Interactive Transportation Management and First Responder Training System. The Coalition has created an intensive training program that uses three-dimensional, multi-player computer gaming simulation technology and distance-based learning technologies. The training enables practical, scenario-based, interactive, real-time incident management training. It can involve up to 500 responders, trainers, and "victims" simultaneously at a variety of locations. This training will promote performance that is more consistent, encourage coordination and innovation, and provide for better and safer delivery of incident management services. With the completion of the training technology, the Coalition will focus on the delivery of the training with agencies throughout the Corridor. Due to its virtual nature, the training provides emergency responders from a wide variety of agencies with the opportunity to be exposed to best practices, establish expectations of standards for good practice, and allow them to discuss methods and issues with their peers. The graphic on the following page depicts the virtual and interactive qualities of the training.
Program Accomplishments To Date
The I-95 Corridor Coalition's major accomplishments over the last 15 years are:
• The Coalition has grown to 40 full members and several related entities, representing a variety of transportationrelated agencies from Maine to Florida.
• The Coalition has sponsored research in a wide variety of areas of common interest to its membersand in support of ITS deployment (Project details are listed in the I-95 project database at: www.i95coalition.net/i95/Projects/ProjectDatabase/tabid/81/Default.aspx). Projects have focused on:
• Policy and Strategic Planning (17 projects)
• Coordinated Incident Management (42 projects) • Intermodal (45 projects)
• Safety (5 projects)
• Travel Information Services (27 projects)
• Commercial Vehicle Operations (30 projects)
• Electronic Payment Services (12) projects • A wide array of projects from 1993-1997 (39 projects)
• The Coalition has promoted a strong and vital ITS workforce through the development and distribution of learning materials such as "lessons learned" reports and participation in industry conferences. Coalition members have directly benefited from investments in educational programs such as: • The Center for Innovative Training and Education (CITE), an international consortium of universities that is using distance learning technologies to educate professionals on the latest technologies and applications.
• Transportation operations and freight Academies that provide Coalition member agencies and others from around the country opportunities to spend a week or longer, learning about transportation issues.
• On-the-job training and interactive opportunities such as:
. On-line courses on project management and performance measures . TMC Operator's Simulation Training
. Quick Clearance Toolkit and Workshop
. Incident Management Virtual Training
Program Outcomes
. The public has benefitted through improved incident response facilitated by information sharing and personal relationships established during regular Coalition-hosted meetings. This benefit was particularly evident in the aftermath of the 9/11 tragedies. The strong professional relationships developed among Coalition members helped overcome the destruction and overload of the communications systems.
. Coalition support of member implementation of CVISN has improved commercial vehicle safety and productivity. For example, the Coalition sponsored development of software that enables participating states to submit safety and accident information into a national database in real time. Before this innovation, the process took up to nine months. The Coalition has also sponsored projects that build from CVISN to provide the motor carrier industry with web-based portals that allow a single interface for electronic filing of state requirements such as permits; vehicle, driver, and carrier credentials; and payments of fees and taxes.
. Through the execution of the groundbreaking Vehicle Probe Project, the Coalition has demonstrated the first multistate procurement of continuous traffic flow data on an unprecedented scale. This data will ultimately benefit the public through improved traveler information, system management and performance monitoring.
. The Coalition is reducing congestion and delays caused by major incidents and roadway construction by providing travel time information to roadway operations agencies and roadway users well ahead of the incident or activity. Procedures implemented in Florida, Georgia, and North and South Carolina enabled information sharing for six major incidents and 13 other events during the first several months of operation. Such procedures and cooperation could be an important communications vehicle during hurricane season.
. The Coalition's many information exchange forums have helped member agencies focus on the establishment of 511 traveler information programs and the use of common electronic payment methods across modes and applications.
Program Purpose
Adverse weather conditions have a major impact on roadway safety, mobility, and productivity. Bad weather increases travel time by reducing speeds and roadway capacity. Furthermore, weather events can influence productivity by disrupting access to road networks and increasing road operating and maintenance costs.
Although not limited specifically to winter conditions, management and maintenance of roadway conditions during the winter season present some of the greatest challenges and costs. Winter road maintenance accounts for approximately 20 percent of State DOT maintenance budgets. Each year, State and local agencies spend more than $2.3 billion on snow and ice control operations and more than $5 billion to repair infrastructure damage caused by snow and ice. In addition, controlling snow and ice buildup on roadways requires time-critical decisions for maintenance personnel on the types of treatments to use, the timing and rates at which to apply the treatments, and the specific roadway locations. The practices and experiences gained from winter maintenance offer lessons that can be applied during other unfavorable conditions.56
Recognizing that weather has severe impacts on the transportation system, Congress included a requirement in SAFETEA-LU (Section 5308) to establish a Road Weather Research and Development Program.
Section 5308: Road Weather Research and Development Program
(a) ESTABLISHMENT.—The Secretary shall establish a road weather research and development program to—
(1) maximize use of available road weather information and technologies;
(2) expand road weather research and development efforts to enhance roadway safety, capacity, and efficiency while minimizing environmental impacts; and
(3) promote technology transfer of effective road weather scientific and technological advances.
(b) STAKEHOLDER INPUT.—In carrying out this section, the Secretary shall consult with the National Oceanic and Atmospheric Administration, the National Science Foundation, the American Association of State Highway and Transportation Officials, nonprofit organizations, and the private sector.
(c) CONTENTS.—The program established under this section shall solely carry out research and development called for in the National Research Council's report entitled 'A Research Agenda for Improving Road Weather Services'. Such research and development includes—
(1) integrating existing observational networks and data management systems for road weather applications;
(2) improving weather modeling capabilities and forecast tools, such as the road surface and atmospheric interface;
(3) enhancing mechanisms for communicating road weather information to users, such as transportation officials and the public; and
(4) integrating road weather technologies into an information infrastructure.
(d) ACTIVITIES.—In carrying out this section, the Secretary shall— (1) enable efficient technology transfer;
(2) improve education and training of road weather information users, such as State and local transportation officials and private sector transportation contractors; and
(3) coordinate with transportation weather research programs in other modes, such as aviation.
Program Approach
Weather and Transportation Facts
. 24% of annual vehicle crashes—approximately 1,561,000—are weather-related (those crashes that occur in adverse weather or on slick pavement).
. Each year nearly 7,400 people are killed and over 673,000 people are injured as a result of these weather-related crashes.
Source: MDSS Brochure and
www.ops.fhwa.dot.gov/weather/q1_roadimpact.htm
Research conducted by FHWA and AASHTO points to the use of road-weather management systems as an important solution for more cost-efficient operations, a reduction in environmentally harmful procedures, and most importantly, a safer driving environment. To address the need for road-weather management systems, the ITS Program and FHWA established the Road Weather Management Program (RWMP), focusing on four major areas of investment and activities:
• Conducting Research and Development. Efforts are focused on expanding road-weather research and development activities to advance the state of the art. Targeted research and development activities are coordinated with industry, addressing four areas:
• Weather observing
• Transportation and weather modeling
• Road Weather Information Dissemination
• Integrated road-weather technologies
Investments made in these research areas support the goal of nationwide integration of existing networks and databases to establish road-weather management system capabilities that can deliver accurate, route-specific information tailored for surface transportation managers as well as targeted pre-trip and en-route road weather information for travelers. Included in this work is the development of standards, guidelines, and data quality control procedures. In particular, standards create interoperability among existing systems, thereby leveraging the existing investments made by Federal, State, and local transportation and weather agencies and the private sector.
• Coordinating Interactions between the Transportation and Weather Communities. Effective road-weather management requires a multi-disciplinary approach to road-weather challenges. The RWMP partners with organizations such as the National Oceanic and Atmospheric Administration, the Office of the Federal Coordinator for Meteorology, the American Meteorological Society, the National Weather Association, AASHTO, State DOTs, national laboratories, nonprofit organizations, and the private sector. The program brings these key stakeholders together to work cooperatively to define requirements for new technologies and systems that address prevailing needs. RWMP works with the various stakeholders to build upon existing knowledge and practices of the transportation and weather communities in order to expand the approach to and capabilities of roadway maintenance decisions and operations during times of adverse weather.
• Facilitating Outreach, Technology Transfer, and Training. There is a wealth of road-weather information and technologies available today, and some that are soon to emerge on the market with the technology transfer of recent advances to the private sector for commercialization. The RWMP partnership is focused on deploying information, technology tools, and road-weather management strategies within both the transportation and weather communities. The extensive and advanced research performed under the RWMP is turned into practices that benefit the public and private sectors through training events, publications and other highly accessible technical resources. The efforts at technology transfer and training are inclusive of the transportation and weather disciplines in content and seek to engage both communities in learning about each others' requirements and needs.
• Developing Performance Measures. To understand the effectiveness of applying ITS technologies and systems for use during adverse weather conditions, the RWMP is working on developing a set of performance measures for safety, mobility, and efficiency. The RWMP is establishing baseline conditions (little or no ITS use) to compare them against data collected with the use of ITS. The data also supports program evaluation and the analysis of the use of program funding in the three areas described above to assess the relative merits of the RWMP strategies and initiatives as a means of maximizing overall program benefits.
Program Accomplishments to Date
• Research and Development. Accomplishments are categorized into three important activity areas:
1. Coordination with the Clarus Initiative—Clarus is a management system for an integrated surface transportation weather observation data (the Nationwide Surface Transportation Weather Observing and Forecasting System). The system enables public agencies to more accurately assess weather and pavement conditions and impacts on operations. Such information is a key to planning, conducting, and evaluating the effectiveness of activities such as winter road maintenance, weather-responsive traffic management, traveler information dissemination, safety management, transit vehicle dispatching, and flood control. The Road Weather Management Program has leveraged the experiences and best practices learned under the Clarus Initiative to inform the research and development under the RWMP.
2. Weather-Responsive Traffic Management Activities—Although the winter transportation community is well versed in the methodologies for anticipating and proactively addressing adverse weather, other transportation agencies continue to make do with traffic models and strategies that are designed for dry pavement conditions. As seen in recent years with hurricane conditions, these models are inadequate to support effective roadweather management. The concept behind weather-responsive traffic management is to integrate weather data with traveler information systems, travel demand forecasts, and incident response systems into the traffic management decision making process. For example, a TMC might use this more comprehensive weather data to execute weather-responsive strategies such as modifying traffic signal timing or executing variable speed limit strategies during rain storms. Figure 3.80 illustrates six of the key weather-responsive traffic management strategies in place today. In partnership with State and local transportation agencies, RWMP research is focusing on the development of additional strategies.
The program recently developed a selfevaluation tool for State and local agencies. The tool assists agencies in identifying the weather-reporting elements most appropriate for their TMC, using criteria such as land use patterns, typical weather problems, and the typical highway and arterial demand, volumes, and capacity.
3. Completion and Demonstration of the Winter Maintenance Decision Support System (MDSS)—The MDSS is an innovative and important new tool for providing decision support to maintenance managers. MDSS integrates weather forecasts with computerized road maintenance operations to provide detailed predictions on roadway weather conditions and then recommens surface treatments and strategies for the effective management of anti-icing resources. Traditional information systems only provide road weather information. MDSS is the first decision-support tool to translate the road weather information into transportation-based recommendations and actions.
From 2002 to 2007, the MDSS prototype underwent five development cycles and three field demonstrations in Minnesota, Iowa (2002 — 2003, 2003 — 2004), and Colorado (2007 — 2008). Currently, 14 states have joined the MDSS Pooled Fund Study, led by the South Dakota DOT, and are working with a private company to develop and implement an operational MDSS customized for their agencies. Figure 3.81 on the next page illustrates MDSS activities as of November 2008. The new system will provide actual road surface conditions, actual maintenance treatments, past and present weather conditions, weather event and pavement condition predictions, and maintenance treatments, and will take into account resource constraints.
FHWA and the ITS Program have been conducting evaluations of operational MDSS applications being used by the pooled fund states, the Maine DOT, and the City and County of Denver, Colorado. The Maine DOT evaluation is completed and can be found at: www.itsdocs.fhwa.dot.gov/jpodocs/repts_te/14387.htm. Evaluation results for the Colorado assessment are expected in June 2009. Figure 3.82 shows the MDSS system as customized for the Colorado/Denver evaluation. The MDSS scope will be expanded in the near future to become a Maintenance and Operations Decision Support System (MODSS) that supports other weather-related decision-making, such as for summer maintenance and construction.
• Stakeholder Coordination. As of August 2008, ten MDSS stakeholder meetings have been held to discuss public sector activities, cost/benefit studies, user experiences, outreach, and new MDSS products and services. In addition to stakeholder meetings, FHWA offers free MDSS Road Show seminars for State agency managers and field personnel. Twenty-five seminars have been held. In 2008, FHWA also launched an intensive, one-day productdemonstration showcase to introduce State DOTs to MDSS, including presentations by public sector agencies using MDSS and private sector MDSS vendors. Three product demonstration showcases have been held to date. Also, the AASHTO Technology Implementation Group has selected the MDSS as a "focus technology," or a ready-to-use technology that is likely to yield significant benefits to users. AASHTO will champion its deployment through educational brochures and videos for distribution.
• Outreach, Technology Transfer, and Training. A major aspect of the RWMP is to provide leadership in technology transfer, training, and education for the surface transportation weather community. The program accomplishes this through the creation of innovative tools to train state and municipal Departments of Transportation (DOT) and raise awareness among transportation professionals of the program opportunities and capabilities. The following training resources have been developed for these purposes:
• Weather and Road Management. This web-based training course developed by the ITS Program, FHWA, and the Cooperative Program for Operational Meteorology, Education and Training (COMET), is directed at road weather personnel in order to build a bridge to National Weather Service (NWS) products, forecasts, and warnings. The course draws on the availability of ample NWS information to provide guidance on how to best use and interpret NWS forecasts and products to facilitate more efficient road weather operations. The course is available on the COMET website at: www.meted.ucar.edu/dot/.
• User Needs to Migitate Societal Impacts: Road Weather Course. This course is under development. It is a complement to the Weather and Road Management course and is targeted towards NWS forecasters. The goal is to inform forecasters of the needs of the public transportation agencies (e.g., State DOTs) and other traffic management operations responsible for the protection of life and property within transportation systems in an effort to better coordinate NWS operations with traffic management field practices.
• Road Weather Resource Identification (RWRI) Tool. The RWRI Tool is a database that contains roughly 650 road weather management resource documents including research reports, articles, and other publications that assists transportation professionals in locating materials tailored to their needs. The tool offers three different search options for navigating the database and can be found at:
www.ops.fhwa.dot.gov/weather/rwri/registration.htm.
The close working relationship with industry during the development of the MDSS has resulted in the adoption of the new technologies by the private sector. Two companies are working on the development of MDSS systems that can meet State and local transportation agency needs. Both systems incorporate the basic functionality of the Federal prototype and provide enhanced functions and additional types of information.
• Performance Measures and Evaluation. The ITS Program and FHWA are in process of developing a Performance Evaluation Plan. The plan defines assessment activities for both individual projects (such as the MDSS analysis) and for the overall program. To date, the RWMP and its key stakeholders have defined over 100 performance measures that are relevant to gain a comprehensive understanding of the relative merits of each system. These metrics have been grouped into 11 overall criteria. The Program Evaluation Plan will be completed in early 2009 and the next steps to implement the evaluation measures will begin.
Program Outcomes
Although the initial plan for overall program evaluation is not yet complete, a number of individual evaluations have been conducted, primarily on the application and use of the MDSS. Initial results indicate that the benefits outweigh the costs; however, each evaluation is specific to a certain state DOT and its operating costs. Future RWMP studies will address the need to collect and analyze data through methodologies that can allow for broader generalizations about the system. To date, insights include:
. A cost/benefit study performed with the Illinois DOT after one storm in 2007-2008 showed that use of the MDSS resulted in:
• Improved calling out of crews resulted in savings of $20,400 (3 hours @ $6,800/hour).
• Avoidance of 1 unnecessary application of salt resulted in savings of $72,325.
• Improved safety and level of service and a total savings of over $92,000 for the one event.
. A Denver case study of a snow event on March 16, 2008 revealed a significant monetary savings with MDSS due to the more accurate prediction of the event and the ability call in a shift closer to the time of the weather event. The cost savings for the one event included:
• The ability to avoid one overtime shift ($30,000).
• The ability to more accurately predict the weather patterns which led to the avoidance of having to assign a shift to a major residential deployment that did not experience the adverse conditions ($135,000).
• Altogether, the savings totaled $165,000.
. The Western Transportation Institute has been studying costs and benefits in New Hampshire, Colorado, and Minnesota and is finding an 8 to 1 cost benefit ratio when applying MDSS.
. The ITS Program and FHWA have produced and is continuing to produce best practice and lessons learned case studies. In 2006-2007, FHWA produced a "Lessons Learned" Case Study of Portland, Maine. This qualitative assessment identifies some key lessons experienced in applying MDSS57:
• The deployment of an MDSS necessitates organizational change, which takes time.
• Training before and during the adoption of MDSS is recommended.
• Offer the MDSS tool to the road crews that are most comfortable with new technology.
Research Program Purpose
In SAFETEA-LU, Section 5507, Congress directed the Secretary of Transportation to research, in cooperation with the U.S. Department of Commerce, the potential for using interstate highway corridor rights of way (ROW) in mostly rural areas to expand the availability of high-speed telecommunications (HST). The use of interstate highway roadside not only offers a continuous environment for the construction of telecommunications infrastructure, it also provides a potential benefit to States to support existing or planned advanced transportation management technologies in these corridors. The result is the Rural Interstate Corridor Communications Study (see textbox below for legislative requirements).
Initiated in 2006, the study investigated the feasibility and benefits of, as well as the impediments to, installing fiber-optic cables and/or wireless communications infrastructure along interstate ROW. The envisioned result was a high-capacity "backbone" system, which would carry large amounts of data over long distances and offer connection to both transportation operating agencies and rural communities within the corridor.
a. STUDY.—The Secretary, in cooperation with the Secretary of Commerce, State departments of transportation, and other appropriate State, regional, and local officials, shall conduct a study on the feasibility of installing fiber optic cabling and wireless communication infrastructure along multi-State Interstate System route corridors for improved communications services to rural communities along such corridors.
b. CONTENTS OF STUDY.—In conducting the study, the Secretary shall identify—
1. impediments to installation of the infrastructure described in subsection (a) along multi- State Interstate System route corridors and to connecting such infrastructure to the rural communities along such corridors;
2. the effective geographic range of such infrastructure;
3. potential opportunities for the private sector to fund, wholly or partially, the installation of such infrastructure;
4. potential benefits fiber optic cabling and wireless communication infrastructure may provide to rural communities along such corridors, including the effects of the installation of such infrastructure on economic development, deployment of intelligent transportation systems technologies and applications, homeland security precaution and response, and education and health systems in those communities;
5. rural broadband access points for such infrastructure;
6. areas of environmental conflict with such installation;
7. real estate ownership issues relating to such installation;
8. preliminary design for placement of fiber optic cable and wireless towers;
9. monetary value of the rights-of-way necessary for such installation;
SECTION 5507: RURAL INTERSTATE CORRIDOR COMMUNICATIONS STUDY (continued from previous page)
10.applicability and transferability of the benefits of such installation to other rural corridors; and
11.safety and other operational issues associated with the installation and maintenance of fiber optic cabling and wire infrastructure within Interstate System rights-of-way and other publicly owned rights-of-way.
c. CORRIDOR LOCATIONS.—The study required under subsection (a) shall be conducted for corridors along—
1. Interstate Route 90 through rural Wisconsin, southern Minnesota, northern Iowa, and South Dakota;
2. Interstate Route 20 through Alabama, Mississippi, and northern Louisiana;
3. Interstate Route 91 through Vermont, New Hampshire, and Massachusetts; and
4. any other rural corridor the Secretary considers appropriate.
REPORT TO CONGRESS.—Not later than September 30, 2007, the Secretary shall submit to Congress a report on the results of the study, including any recommendations of the Secretary
Research Approach
The study was performed for three 25-mile-wide interstate corridor segments:
• Interstate 90 through rural Wisconsin, southern Minnesota, northern Iowa, and South Dakota
• Interstate 20 through Alabama, Mississippi, and northern Louisiana
• Interstate 91 through Vermont, New Hampshire, and Massachusetts
Because the study was technology-neutral, it included consideration of a fiber-optic system, a wireless system, and a conceptual hybrid system. The study was also competitively neutral, assuming that States would encourage fair and effective competition and private-sector participation.
To determine the feasibility and desirability of the deployment of high speed telecommunications infrastructure in these corridors, there were several factors considered, including Federal and State policies and regulations that enable or inhibit deployment; technical, technological, and engineering needs; the level and characteristics of demand, including current and future social, economic, and demographic patterns in the study areas; potential public benefits; and models for deployment with other agencies and institutions. Additionally, the study looked at the likely costs involved in construction and the potential to defray costs through public-private partnerships or the creation of a broader network of public agencies, communities, and other end users.
This study was unique in that it examined the potential of multistate coalitions to deploy high speed telecommunications backbones along major transportation corridors, creating additional benefits that might not be realized solely through the initiatives of individual States and private sector providers.
Accomplishments To Date
The study is complete and the mandated report with recommendations was transmitted to Congress was in August of 2008.
Research Outcomes
The study documents the following impacts and insights:
. Impact on rural communities: Benefits to rural communities, such as economic development, improved health care, better educational opportunities, and enhanced quality of life, will be realized only if the high speed telecommunications backbone is deployed in such a way that it spurs additional local investment to provide low-cost, "last-mile" connections to end users.58
The study found that the penetration of high speed telecommunications into rural areas had been uneven to date and that there was evidence of a digital divide across geographic, demographic, and socioeconomic boundaries. In 2006, the Government Accountability Office (GAO) found that only 17 percent of households in rural areas were broadband subscribers. In addition to providing individual access to the wealth of information on the Internet, high speed telecommunications access is important for educational institutions and libraries; it also helps in providing rural health care through telemedicine.59
. Impact on transportation agencies: The most direct benefits of a backbone high speed telecommunications installation would be to transportation agencies. Corridor-based high speed telecommunications is an essential component for implementation of ITS, described elsewhere in this plan, but providing high speed telecommunications along the interstate roadway is an expensive proposition. There is a high potential for win-win solutions from partnerships between transportation agencies and private-sector telecommunications entities.
. Technology: The study found that physical and regulatory conditions related to high speed telecommunications were variable and that there is no one-size-fits-all recommendation: no single technology will provide the solution to high speed telecommunications needs in all rural corridors. Fiber-optics, wireless, or a hybrid of the two technologies may be most appropriate, depending on the specific conditions and needs within each corridor.
. Policy constraints: Individual States execute laws and policies that may limit the deployment of a corridor-wide communications backbone, a situation that is likely to persist without Federal law or regulations. Many States have policies limiting or restricting use of interstate corridors for utilities, motivated by concerns about safety within the ROW, liability, and financial risk. In addition, Federal regulations prohibit State and local government from competing with private telecommunications providers.
The team concluded that the Federal government must continue to play an active role if the full benefits of high speed telecommunications deployment are to be realized. Federal leadership is especially critical to establishing a framework that promotes creative approaches to multistate deployment without imposing unnecessary new requirements.
. Role of the private sector: The private sector is critical, for not only providing last-mile connections and potential financial support, but also for maintaining and operating a system. State DOTs, oriented primarily toward capital construction, are not equipped to deploy or maintain telecommunications. Models for managing construction, ownership, operations, and funding include:
• Market-driven: all parties pay full market value for resources.
• Quid pro quo: parties exchange goods or services of equal value.
• Legislation: the private sector is moved to take action due to requirements or incentives.
A substantial national-fiber backbone system already exists between major metropolitan areas due to prior private-sector investments; thus, opportunities for resource-sharing agreements for new fiber capacity are limited. An optimal strategy will rely on public-private partnerships to make use of existing infrastructure and to promote investment in new infrastructure only where it is needed.
. Role of the Federal government. To fully realize the benefits of high speed telecommunications, the Federal government must play an active role in facilitating the development of policies at both the legislative and executive levels. Precedents for such programs exist—for instance, the Rural Development Utilities Program and Universal Service Access Fund. Federal leadership is especially critical to establishing a framework that will promote creativeapproaches to multistate deployment without imposing unnecessary new requirements. The US DOT could also provide technical assistance and/or incentives for States to enter into multistate agreements and public-private partnerships and could facilitate the establishment of uniform guidelines and standards stemming from use of advanced communications technologies in a transportation setting.
. Role of State government. States also have a strong potential interest in high speed telecommunications along interstate corridors. Highway-based high speed telecommunications combined with ITS monitoring capability would enhance State efforts to reduce congestion, to improve homeland security measures, and to use high speed telecommunications for other, non-transportation-related functions. However, States generally do not have resources readily available for major investments in high speed telecommunications. States have the potential to take advantage of the value of their ROW property to the private sector by offering consistent rules of access.
. Role of the ITS Program. Looking toward the future, Vehicle Infrastructure Integration (VII) could establish the need for various forms of communications along interstate highway corridors. The Department is continuing to work with States and other stakeholders to determine whether such an opportunity exists and what appropriate governance models can be applied.
Program Purpose
In March 2003, the Florida Department of Transportation (FDOT) was selected to participate in an innovative model deployment with the ITS Program. The goal was to build a comprehensive, regional information infrastructure (hence the designation "iFlorida") to demonstrate the wide variety of publicsector operations that can be enabled or enhanced by an integrated information system covering a wide area that is densely populated and frequently visited by tourists.
The model deployment tested how a broad network of real-time remote sensors could improve the "situational awareness" of public-sector managers. It provided an opportunity to identify real-world logistical and human factor constraints on the successful operation of such a system.
The objectives of iFlorida were to improve several key areas of transportation management:
• Metropolitan-area traffic management: At key intersections, deploy toll-tag, transponder-based travel-time monitoring; license-plate readers; microloop detectors (for monitoring evacuation traffic); and closed-circuit television. Create an interface with the Florida Highway Patrol Computer Aided Dispatch (FHP CAD) system.
• Statewide traffic management: Integrate new traffic monitoring devices with the existing traffic monitoring site network to generate real-time data for travelers and statewide decision-makers, particularly in relation to hurricane evacuations.
• Evacuation operations: Deploy additional devices and a new statewide 511 system. Establish network connectivity between emergency-operation and transportation-management centers.
• Traveler information operations: Expand 511 beyond a single interstate, create a website, and add dynamic message signs providing real-time information. Make resulting data available to outside entities, such as weather reporters.
• Weather data: Integrate weather data from Road Weather Information System (RWIS) stations and third-party suppliers into traffic management.
• Security operations: Deploy a security monitoring system at two high-priority bridges, create networked video surveillance on a section of I-4 to monitor bus security, assess vulnerability of the District 5 Regional Transportation Management Center, and create an emergency evacuation plan for the Daytona International Speedway.
Program Approach
The iFlorida Model Deployment began in May 2003 with plans for FDOT to complete the design and integration of the infrastructure required to support iFlorida operations in two years. The required infrastructure was extensive, spanned numerous stakeholders. It included many technologies that were new to FDOT District 5 (D5), such as sophisticated TMC operations software, a wireless network deployed along I-4, an interface to FHP CAD data, statewide traffic monitoring, and many others. The iFlorida plans also called for deployment of these technologies in ways that required coordination among more than 20 stakeholders. It was an ambitious plan that would result in dramatically different traffic management operations for FDOT D5 and other transportation stakeholders in the Orlando area. Program Accomplishments
The iFlorida project is complete. The final evaluation report will be delivered in December 2008. A large infrastructure of traffic detection remains in place in Florida and in operational use. In September 2008, FDOT was able to implement the variable speed limit (VSL) strategy because of the project's deployment of variable speed message signs. This strategy is expected to both reduce crashes and delay the onset of congestion.
Unfortunately, the model deployment faced numerous barriers to achieving its full potential. Maintaining all of the newly deployed field hardware proved difficult; significant failures occurred with the arterial toll tag readers, the Statewide Monitoring System, the wireless broadband network, and the bridge security system. But the most significant challenge concerned the integration of all the components through the Condition Reporting System (CRS) software. The CRS software was the traffic management software that was intended to combine data from the iFlorida field equipment and provide tools to manipulate this data and control FDOT traffic management assets such as dynamic message signs (DMS), 511 messages, the traveler information Web site, and the Road Ranger motorist assistance patrol services. The Condition Reporting System (CRS) that was supposed to obtain and transmit sensor data to decision-makers throughout the transportation management system presented a failure within this research program. Because of this software failure, certain aspects of the deployment could not be fully assessed because operators had no access to the newly obtained data.
Program Outcomes
Because of the nature of the iFlorida experience, the deployment, integration, and testing of the iFlorida system provided important lessons learned for the Nation. Lessons learned within each goal area include:
. Metropolitan traffic operations: Deployment of a large number of new instruments required an increase in labor and administration for monitoring equipment and knowledge of regulations that apply to those instruments.
• When interfacing with a highway patrol system, it is important to agree on data entry protocols and practices.
• The effective use of DMS was contingent upon an accurate interface with the CRS. Furthermore, the methodology to create travel times for DMSs requires validation; software developed to automate massages should concentrate on message type and frequency; and a back-up method to manage signs and travel times should be established for cases when automation is unavailable.
• Understanding the regulatory and statutory environment related to speed limits is essential before considering a VSL system. Developing a concept of operations prior to the creation of a VSL system ensures better overall design of the structure.
. Statewide traffic operations: The deployment showed that the trial Statewide Monitoring System was not an improvement in terms of either data produced or cost-effectiveness.
• Use of a preexisting statewide microwave communications network was a cost-effective approach for transmitting information to remote traffic monitoring stations. However, the location of the microwave towers was not the best criterion for selecting statewide monitoring sites.
• The cost of maintaining the Statewide Monitoring System was high, while the demand for data generated by it was low.
• A traffic video produced by the system was in high demand by the State Emergency Operations Center for hurricane evacuation.
• Better traveler information was obtained at less cost by the FHP CAD system.
. Evacuation operations: The impact of the iFlorida deployment on evacuation operations was limited due both to field equipment maintenance challenges and the failure of the CRS software, which has since been replaced. Specific lessons learned from real-time experiences during the deployment were:
• Statewide coverage of traffic conditions is critical to managing an evacuation. The network was too sparse to provide adequate data, and local centers did not have access to consolidated data. This was largely due to the failure of CRS software to provide data to local emergency traffic management organizations.
• Certain evacuation measures take so long to set up that travel-demand estimates are needed 24 hours in advance. For example, contraflow (altering/ reversing usual traffic flow) takes three hours to implement and cannot be deployed at night according to Florida law.
• A distributed approach to evacuation management (e.g., delegation to the counties) is very effective. Information infrastructure is essential to keeping these distributed efforts coordinated.
. Traveler Information operations: These procedures were widespread and included the Central Florida and 511 systems, internet and electronic signs to create a network of traffic monitoring equipment that assisted thousands of people per day. Yet, limitations of the iFlorida operations were identified and the following lessons were learned:
• There is a need for a back-up maintenance plan of the 511 system when supporting equipment or systems fail.
• When changing the menu options available on the 511 system, make allowances for current users to ease the transition, monitor user feedback to inform system improvements, and allow for the customization of a call request.
• Maintain a detailed tracking system of website activity for the most effective analysis of user information and as a means to integrate it into other operating platforms.
. Weather data: Data were successfully acquired from RWIS stations and from a meteorological data supplier, although the CRS software failure prevented transportation decision-makers from using the information to full advantage.
• Microwave tower sites provided cost-effective locations for RWIS stations because utilities were already available and the network could be used to transmit data. However, care must be taken to avoid violating National Weather Service standards when mounting equipment.
• The National Weather Service's Meteorological Assimilation Data Ingest System (MADIS) is a useful interface between RWIS stations and traffic management software. However, the transfer introduces a 15-minute time lag.
. Security operations: The plans for the iFlorida deployment included five projects related to transportation security— a bridge security monitoring system; a broadband wireless, video surveillance equipment deployment on the LYNX transit system to transmit bus security video over broadband wireless systems to the LYNX operations center and the District 5 Regional Transportation Management Center (D5 RTMC); a vulnerability assessment of the D5 RTMC; an emergency evacuation plan for the Daytona International Speedway; and a traffic modeling project to test the effectiveness of alternate routs in case a bridge was destroyed or disabled. Results included the following:
• Although the bridge-video-monitoring system was able to identify potential threats, it was not cost-effective and it was compromised by a high rate of false alarms. In addition, as it relies on human monitoring, it might not alert responders in time to stop a rapid series of events such as those involved in the mounting of an explosive device.
• The bus security system successfully transmitted real-time video from mobile vehicles; however, rapid evolution of wireless technology since the system was developed in 2003 has made the system obsolete.
• The vulnerability assessment improved security at the D5 RTMC by identifying the need for security procedures and for sufficient standoff distances.
• The evacuation plan developed for Daytona International Speedway identified key features to be included in any similar plan.
The traffic modeling project was delayed because the iFlorida data warehouse did not archive sufficient data to support those activities. FDOT plans on completing that activity once a new data warehouse, under development at the time of this writing, is in place.
Despite the challenges that FDOT faced, it demonstrated great flexibility in finding alternative ways to achieve the original vision. When limitations within the automated systems were discovered, FDOT developed ways to continue to support key traffic management capabilities. When the reliability of the arterial toll tag readers was lower than expected, FDOT modified the way messages were presented in the 511 system to reduce the impact of the missing data on 511 messages. When the CRS travel time estimation process proved inaccurate, FDOT deactivated messages that were known to be flawed. Later, it developed standard messages that could be used during uncongested periods and had operators manually create messages when congestion occurred. When the FHP CAD interface failed, a new interface was developed so that RTMC operators could continue to receive data about FHP CAD incidents. After problems with the CRS's ability to manage sign messages were observed, FDOT had RTMC operators periodically review sign messages to ensure that the correct message was being displayed and, later, had RTMC operators manage all sign messages manually. When the CFDW failed to create useful archives of CRS data, FDOT archived copies of many of the raw data streams that were being provided to the CRS.
In November 2006, FDOT moved to the use of SunGuide, a replacement for the CRS. FDOT has installed an existing version of the SunGuide software and configured it to manage recently deployed ITS equipment on and near I-95. The SunGuide software has allowed FDOT to regain the operational advantages that could not be obtained through the CRS.
SunGuide provides more of the functionality that the agency is seeking. Interfaces that were unreliable under CRS (e.g., DMS, FHP CAD) are now working under SunGuide. With critical operations working more reliably, FDOT is focusing on adding new capabilities to their traffic management operations and new features to the 511 system. FDOT is also preparing to implement variable speed limits and to consider integration of weather data into its traffic management operations. Other regional transportation stakeholders are in discussions with FDOT about using SunGuide and gaining access to iFlorida data. FDOT is, as the writing of this report, beginning to realize some of the operational benefits that were expected when the iFlorida Model Deployment began.
This project is a vivid illustration that not all research initiatives are fully successful as originally conceived. However, much can be learned from the difficulties encountered to share with others and inform future research.
• Following sound systems engineering practices is one key for successfully deploying a complex software system like the CRS. It is important to devote a significant amount of time at the beginning of a software development project to ensure that all parties share a mutual vision for how the resulting software should operate.
• Software must be capable of interfacing with subsystems and the nature of the interaction must be well-defined.
• Plan to integrate newly deployed field equipment into existing monitoring and maintenance processes. • Because traffic monitoring equipment will fail, systems that rely on data from this equipment should be designed to work well when these inevitable failures occur.
• Use a staged approach for deploying new systems.
• Traffic monitoring may not be the best approach to obtaining data for statewide traveler information.
• Travel time estimates should be validated before being used for traveler information.
| Previous | | | TOC | | | Next |