
Baselining Current Road Weather Information: Summary Report

FHWA Publication No: FHWA-JPO-09-054
June, 2009
![]() You will need the Adobe Reader to view the PDFs on this page.
You will need the Adobe Reader to view the PDFs on this page.
PDF (4.8 MB)
NOTICE
The U.S. Department of Transportation provides high-quality information to serve Government, industry, and the public in a manner that promotes public understanding. Standards and policies are used to ensure and maximize the quality, objectivity, utility, and integrity of its information. USDOT periodically reviews quality issues and adjusts its programs and processes to ensure continuous quality improvement.
Any opinions, findings and conclusions or recommendations expressed in this publication are those of the author(s) and do not necessarily reflect the views of the USDOT.
Technical Report Documentation Page
|
1. Report No.
FHWA-JPO-09-054 |
2. Government Accession No. |
3. Recipient's Catalog No. EDL #14485 |
||||||||
|
4. Title and Subtitle Baselining Current Road Weather Information: Summary Report |
5. Report Date June 30, 2009 |
|||||||||
| 6. Performing Organization Code | ||||||||||
|
7. Author(s)
Robert Hart and Leon Osborne (Meridian Environmental Technology, Inc.), Steve Conger (Iteris), and John Wiegmann (Booz Allen Hamilton) |
8. Performing Organization Report No. | |||||||||
9. Performing Organization Name and Address
|
10. Work Unit No. (TRAIS) | |||||||||
|
11. Contract or Grant No. DTFH61-06-D-00006; Task Order 2 |
||||||||||
|
12. Sponsoring Agency Name and Address
Research and Innovative Technology Administration U.S. Department of Transportation 1200 New Jersey Avenue, SE Washington, DC 20590 |
13. Type of Report and Period Covered
Summary Report 8/24/07 – 6/30/09 |
|||||||||
| 14. Sponsoring Agency Code | ||||||||||
|
15. Supplementary Notes
Dr. Roemer Alfelor (COTM) |
||||||||||
|
16. Abstract
This report summarizes the findings derived from research on establishing metrics to measure and track the quality and value of road weather information resources as assessed by members of the surface transportation community who use this information routinely in their decision-making process. The objectives were the establishment of a baseline measure of current road weather information, the development of strategies for an ongoing monitoring program, and the exposition of anticipated outcomes derived from a well-defined method for tracking and comparing the character of road weather information resources. The research evaluated the existing sources of road weather information and the methods used by departments of transportation (DOT) to disseminate this information for both internal and external consumption. DOTs acquire road weather information for multiple decision-making or subsequent decision-supporting purposes, and thereby develop a keen sense of the level to which the road weather resource information meets their needs. A set of six attributes was developed to measure the quality and value of road weather. The road weather information resources were separated into product types and basic weather elements representing the discrete packages weather service providers disseminate to the DOTs. The baseline assessment of quality was accomplished through an online survey executed by surface transportation personnel who routinely use road weather information as part of their daily operations. The report details the organization of the data into a quality attribute matrix and discusses the results from the survey. User responses within quality attribute classes illustrate the strengths and weaknesses of specific products and weather elements both by attribute and in comparison to other products and elements. The research team evaluated the results, their implication regarding specific resources, and the user feedback regarding the survey. All of these results were evaluated as a basis for an ongoing quality characterization monitoring program. The research team then evaluated appropriate time intervals for ongoing testing and potential impacts on the monitoring process and proposed a strategy for implementing a regular quality assessment monitoring process. What was learned from the baseline survey project also served as the basis for a projection of anticipated outcomes from an ongoing road weather quality monitoring program. |
||||||||||
|
17. Key Word
Road weather information; baselining road weather information; quality attribute matrix |
18. Distribution Statement | |||||||||
| 19. Security Classif. (of this report) | 20. Security Classif. (of this page) | 21. No. of Pages | 22. Price | |||||||
The Federal Highway Administration Road (FHWA) Weather Management Program recently completed a study to establish a baseline for current road weather information by characterizing the sources and evaluating the quality attributes of road weather parameters used by transportation agencies. This baseline will provide the metrics to compare future changes in user perceived quality of road weather information due to improvements in road weather information products and technology.
This summary report presents the results of the study as well as recommendations for applying the baseline characteristics and monitoring this information over time.
1.0 Relevant Attributes of Road Weather Information
A key objective of the baseline study was to characterize existing weather information and use it as a benchmark for measuring improvements over time. The characterization used attributes deemed important to the users and directly applicable to weather information and associated products. The six quality attributes selected were:
- Accuracy/Precision - "Closeness" between an observed or forecasted condition and the actual condition;
- Completeness - Adequacy of information to fulfill users' requirements;
- Relevance - Fit of the information to the users' needs;
- Currency/Latency - Age of the information;
- Timeliness/Reliability - Consistent and on-time delivery of information; and,
- Ease of Use - Facility to get, interpret, and use the information.
The process to measure changes in attributes required a mechanism to track the changes in quality over time. To establish the baseline attributes, a road weather information Quality Attribute Matrix (QAM) was developed (see Figure 1 for treatment strategies) to permit a systematic collection and organization of attribute data. This matrix must be filled up at appropriate time intervals to permit comparative analysis with the baseline information. The QAM served as the primary survey instrument and analytical tool for this study.
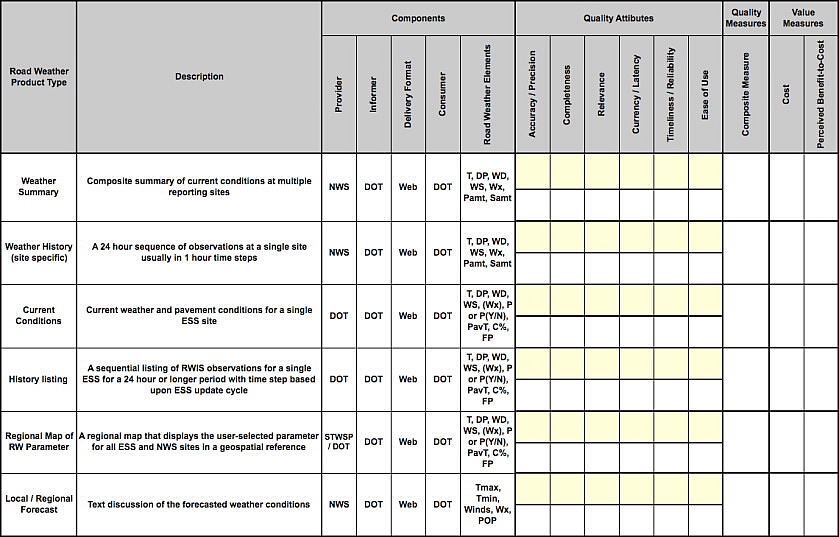
Figure 1. Quality Attribute Matrix (QAM) for characterizing road weather information for Treatment strategies
Figure 1 Definitions:
- Provider: Source of product type
- Informer: Agent delivering product
- Composite Measure: Average of attribute responses weighted by attribute importance
- Cost: Indication of whether the DOT paid the informer for the product or received it at no cost
To complete the QAM, road weather information was classified in two ways: 1) by Product Types and 2) by Road Weather Elements. Product Type describes a packaged collection of road weather information while Road Weather Elements include individual pieces of information that are either contained in a product type or reported individually. Both classes of road weather data are used for surface transportation decision-making and are anticipated to remain actively used in the future. They also represent different users' perspectives on quality.
An electronic survey was conducted to ask the road weather community to evaluate the quality and value of various road weather elements and typical road weather products. This method also determined the level of agreement by the users about the two classes of information.
2.0 Data Requirements and Measurement Scales
Road weather information, either as element or product type, was also characterized according to its use. For road weather, the categories of Treatment, Advisory, and Control describe different transportation agency uses that often require different types and characteristics of road weather information. Among transportation agencies, treatment or maintenance applications most commonly use road weather information to keep the road clear of obstruction (e.g. snow plowing). Control or traffic management applications use road weather information to regulate or optimize traffic flow during bad weather conditions (e.g. speed limits). Advisory strategies use weather information to inform or alert travelers of changing weather-related travel conditions (e.g. Variable Message Sign).
The survey captured user community assessment of road weather characteristics defined within the QAM structure for each of the strategies. It consisted of three sections: (1) general information about the respondents including their experience and awareness of road weather, (2) questions related to individual road weather elements, and (3) questions related to road weather products or packages. A majority of the questions solicited responses using a five-point Likert scale, permitting the creation of a statistical assessment within the QAM. Additional questions were posed with answers requiring specific categorical responses. The survey material also allowed free form responses to every question. These free form responses, while not an addition to the statistical characterization of the quality attributes, provided a means for the road weather information users to add specific comments and insights on the quality of information.
3.0 Current baseline characterization of road weather information
The two classes of road weather information, Product Types and Road Weather Elements, resulted in separate baseline characterizations for each class. A complete and detailed analysis of the resulting QAMs for each class is available in the accompanying full study report. Below is a summary of the findings for selected analyses.
3.1 Baseline Characterization of Road Weather Information Elements
The composite of all survey responses of the Road Weather Element attributes (Table 1) indicates the key variance parameters for each of the six quality attributes and the composite Attribute Average (a simple average of all attribute responses). Within each quality attribute are sub-columns for Advisory strategies (A), Control strategies (C), and Treatment strategies (T). Quality attribute values for the individual Road Weather Elements clustered around the mean or median of 3.8 on a Likert scale, where the minimum value was 1 (very low quality) and the maximum value was 5 (very high quality). Most of the Road Weather Elements showed consistency in their average quality attributes.
| Quality Attributes |
Maximum Value |
Minimum Value |
Mean | Median | Standard Deviation |
|
|---|---|---|---|---|---|---|
| Attribute Average | A | 4.1 | 3.0 | 3.4 | 3.4 | 0.3 |
| C | 4.4 | 2.3 | 3.8 | 3.8 | 0.3 | |
| T | 4.3 | 2.9 | 3.8 | 3.9 | 0.2 | |
| Accuracy / Precision | A | 4.2 | 3.0 | 3.5 | 3.5 | 0.3 |
| C | 4.5 | 2.0 | 3.9 | 4.0 | 0.4 | |
| T | 4.2 | 2.4 | 3.6 | 3.6 | 0.3 | |
| Completeness | A | 4.1 | 2.4 | 3.3 | 3.3 | 0.4 |
| C | 4.3 | 2.5 | 3.5 | 3.5 | 0.3 | |
| T | 4.3 | 2.9 | 4.0 | 4.1 | 0.3 | |
| Relevance | A | 4.3 | 2.8 | 3.2 | 3.2 | 0.4 |
| C | 4.8 | 1.7 | 3.9 | 4.0 | 0.6 | |
| T | 4.6 | 2.8 | 4.1 | 4.2 | 0.4 | |
| Currency / Latency | A | 4.0 | 3.2 | 3.5 | 3.5 | 0.2 |
| C | 4.3 | 2.5 | 3.3 | 3.3 | 0.5 | |
| T | 4.4 | 3.5 | 3.9 | 3.9 | 0.2 | |
| Timeliness / Reliability | A | 4.0 | 2.9 | 3.4 | 3.4 | 0.3 |
| C | 4.8 | 3.0 | 4.2 | 4.3 | 0.4 | |
| T | 4.3 | 3.1 | 3.8 | 3.8 | 0.2 | |
| Ease of Use | A | 4.1 | 4.1 | 3.5 | 3.5 | 0.3 |
| C | 4.8 | 2.3 | 4.0 | 4.0 | 0.5 | |
| T | 5.0 | 2.1 | 3.7 | 3.8 | 0.5 |
The specific road weather elements from the Treatment category showed distinct patterns when ranked by quartiles (Table 2). The ranks in Table 2 are presented adjacent to average quality attribute values for each of the elements. Pavement temperature, road closures, flood watches and warnings, and weather parameters were viewed as the highest quality elements (top quartile). Experience with treatment activities suggests these are trusted elements within a treatment strategy. Meanwhile, cloud cover, chemical concentration, and treatment recommendation received low quality marks (bottom quartile).
Elements in the top and bottom quartiles were consistent across almost all attributes, and will serve as good measures for benchmarking future assessments for the Treatment strategy.
| Road Weather Element |
RANK | Average Composite Attribute Score | ||||||
|---|---|---|---|---|---|---|---|---|
| Average Rank | Accuracy / Precision | Complete ness | Relevance | Currency / Latency | Timeliness / Reliability | Ease of Use | ||
| Pavement temperature | 1 | 1 | 1 | 1 | 6 | 4 | 3 | 4.3 |
| Air temperature | 2 | 2 | 2 | 10 | 1 | 9 | 2 | 4.2 |
| Road closures | 3 | 3 | 25 | 18 | 3 | 31 | 1 | 4.2 |
| Wind gust | 4 | 13 | 5 | 2 | 7 | 5 | 7 | 4.1 |
| Wind speed | 5 | 14 | 6 | 3 | 8 | 6 | 8 | 4.1 |
| Dew point temperature | 6 | 5 | 14 | 26 | 2 | 10 | 14 | 4.1 |
| Wind direction | 7 | 6 | 15 | 22 | 13 | 12 | 9 | 4.0 |
| Flood watches/warnings | 8 | 11 | 4 | 37 | 17 | 2 | 5 | 4.0 |
| Relative humidity | 9 | 8 | 10 | 17 | 10 | 11 | 15 | 4.0 |
| Precipitation type | 10 | 10 | 7 | 6 | 18 | 30 | 12 | 4.0 |
| Minimum Air Temperature | 11 | 15 | 12 | 33 | 11 | 32 | 6 | 4.0 |
| Snow accumulation | 12 | 26 | 23 | 8 | 14 | 28 | 16 | 3.9 |
| Maximum Air Temperature | 13 | 16 | 13 | 36 | 12 | 33 | 13 | 3.9 |
| Type of precipitation or Y/N precipitation indicator | 14 | 18 | 36 | 14 | 9 | 13 | 19 | 3.9 |
| Precipitation end time | 15 | 38 | 9 | 16 | 22 | 15 | 17 | 3.9 |
| Flood potential | 16 | 29 | 31 | 38 | 4 | 1 | 22 | 3.9 |
| Rain amount or liquid equivalent amount | 17 | 24 | 18 | 21 | 32 | 17 | 23 | 3.9 |
| Rain accumulation | 18 | 25 | 20 | 23 | 33 | 14 | 21 | 3.9 |
| Probability of precipitation | 19 | 12 | 11 | 32 | 25 | 21 | 28 | 3.9 |
| Snow rate | 20 | 37 | 22 | 12 | 30 | 41 | 4 | 3.9 |
| Type of weather & precipitation | 21 | 18 | 27 | 4 | 20 | 34 | 31 | 3.9 |
| Type of weather condition | 22 | 9 | 26 | 24 | 23 | 35 | 32 | 3.9 |
| Precipitation start time | 23 | 32 | 21 | 7 | 28 | 27 | 25 | 3.8 |
| Probability of precipitation types | 24 | 19 | 8 | 35 | 26 | 22 | 29 | 3.8 |
| Type of Weather | 25 | 20 | 28 | 13 | 21 | 25 | 33 | 3.8 |
| Estimated amount of precipitation in ranges | 26 | 33 | 39 | 25 | 24 | 16 | 10 | 3.8 |
| Snow Amount | 27 | 30 | 32 | 9 | 29 | 38 | 18 | 3.8 |
| Road conditions by highway segment | 28 | 7 | 16 | 5 | 43 | 18 | 40 | 3.8 |
| Winter advisories/watches/warnings | 29 | 4 | 3 | 20 | 35 | 44 | 34 | 3.8 |
| Visibility | 30 | 40 | 19 | 19 | 31 | 19 | 26 | 3.8 |
| Wind advisories/watches/warnings | 31 | 17 | 17 | 30 | 34 | 39 | 30 | 3.8 |
| Probability of deck and road frost | 32 | 27 | 24 | 27 | 40 | 37 | 27 | 3.8 |
| Pavement condition | 33 | 35 | 35 | 34 | 16 | 29 | 20 | 3.8 |
| Rain rate | 34 | 43 | 33 | 31 | 27 | 26 | 24 | 3.8 |
| Percent probability of deck and road frost | 35 | 31 | 34 | 11 | 19 | 36 | 36 | 3.8 |
| Freeze point temperature | 36 | 42 | 37 | 15 | 15 | 7 | 39 | 3.7 |
| Treatment recommendation | 37 | 41 | 40 | 29 | 37 | 3 | 37 | 3.7 |
| Severe thunderstorm watches/warnings | 38 | 23 | 29 | 28 | 36 | 40 | 38 | 3.7 |
| Flood stage | 39 | 28 | 30 | 41 | 38 | 20 | 35 | 3.6 |
| Dense fog advisories | 40 | 36 | 41 | 39 | 44 | 23 | 11 | 3.6 |
| River stage | 41 | 34 | 42 | 42 | 5 | 24 | 43 | 3.5 |
| Cloud cover | 42 | 21 | 43 | 40 | 41 | 42 | 41 | 3.4 |
| Flow rate | 43 | 39 | 38 | 44 | 39 | 8 | 42 | 3.4 |
| Chemical concentration | 44 | 44 | 44 | 43 | 42 | 43 | 44 | 2.9 |
The inconsistency of second and third quartile rankings for each strategy indicates that each "average quality" element has its own unique rating characteristic. These quality "fingerprints" imply unique environmental factors influencing the users' perspective and represent markers for change in future baseline investigations.
Similar attribute rankings and the computed average of all attribute responses for the Advisory and Control strategies are shown in Table 3 and Table 4. The elements selected for analyses within these strategies differed from the Treatment strategy; however, key elements in the top and bottom quartiles of the two additional tables demonstrate a similar consistency across all attributes; whereas, elements falling in quartiles 2 and 3 were more inconsistent.
| Road Weather Element |
RANK | Average Composite Attribute Score | ||||||
|---|---|---|---|---|---|---|---|---|
| Attribute Average | Accuracy / Precision | Complete ness | Relevance | Currency / Latency | Timeliness / Reliability | Ease of Use | ||
| Road closures | 1 | 1 | 1 | 1 | 1 | 1 | 1 | 4.1 |
| Road conditions by highway segment | 2 | 2 | 2 | 2 | 3 | 4 | 2 | 3.7 |
| Visibility | 3 | 4 | 3 | 3 | 2 | 5 | 3 | 3.6 |
| Minimum air temperature | 4 | 3 | 7 | 4 | 5 | 6 | 6 | 3.5 |
| Flood watches/warnings | 5 | 6 | 8 | 9 | 6 | 2 | 7 | 3.5 |
| Dense fog advisories | 6 | 7 | 12 | 5 | 7 | 7 | 4 | 3.5 |
| Maximum air temperature | 7 | 8 | 10 | 7 | 4 | 3 | 9 | 3.4 |
| Wind speed | 8 | 11 | 5 | 6 | 8 | 9 | 5 | 3.4 |
| Winter advisories/watches/warnings | 9 | 9 | 9 | 10 | 9 | 8 | 8 | 3.4 |
| Severe thunderstorm watches/warnings | 10 | 10 | 6 | 11 | 12 | 11 | 13 | 3.3 |
| Wind direction | 11 | 14 | 11 | 8 | 10 | 12 | 11 | 3.3 |
| Type of weather | 12 | 5 | 4 | 12 | 15 | 14 | 12 | 3.2 |
| Estimated amount of precipitation in ranges | 13 | 13 | 14 | 13 | 14 | 10 | 10 | 3.2 |
| Wind advisories/watches/warnings | 14 | 12 | 13 | 15 | 13 | 15 | 14 | 3.1 |
| Probability of precipitation | 15 | 15 | 15 | 14 | 11 | 13 | 15 | 3.0 |
| Road Weather Element |
RANK | Average Composite Attribute Score | ||||||
|---|---|---|---|---|---|---|---|---|
| Attribute Average | Accuracy / Precision | Completeness | Relevance | Currency / Latency | Timeliness / Reliability | Ease of Use | ||
| View of the road | 1 | 6 | 13 | 1 | 1 | 1 | 1 | 4.4 |
| View of the weather | 2 | 11 | 14 | 2 | 2 | 2 | 2 | 4.3 |
| Severe thunderstorm watches/warnings | 3 | 1 | 2 | 11 | 3 | 21 | 16 | 4.1 |
| Road closures | 4 | 3 | 1 | 12 | 9 | 22 | 4 | 4.1 |
| Dense fog advisories | 5 | 4 | 6 | 5 | 19 | 3 | 5 | 4.0 |
| View of the traffic | 6 | 23 | 24 | 3 | 7 | 4 | 11 | 4.0 |
| Wind direction | 7 | 7 | 15 | 13 | 8 | 5 | 12 | 4.0 |
| Wind gust | 8 | 8 | 16 | 14 | 9 | 6 | 13 | 4.0 |
| Wind speed | 9 | 9 | 17 | 15 | 10 | 7 | 14 | 4.0 |
| Air temperature | 10 | 10 | 5 | 21 | 20 | 8 | 3 | 4.0 |
| Wind advisories/watches/warnings | 11 | 5 | 18 | 16 | 4 | 23 | 27 | 3.9 |
| Pavement condition | 12 | 12 | 7 | 6 | 27 | 10 | 6 | 3.9 |
| Road conditions by highway segment | 13 | 13 | 3 | 17 | 21 | 11 | 17 | 3.9 |
| Flood watches/warnings | 14 | 30 | 4 | 25 | 5 | 24 | 18 | 3.9 |
| Winter advisories/watches/warnings | 15 | 2 | 19 | 7 | 6 | 29 | 28 | 3.9 |
| Probability of precipitation types | 16 | 24 | 8 | 8 | 12 | 25 | 19 | 3.9 |
| Pavement temperature | 17 | 14 | 25 | 10 | 22 | 18 | 15 | 3.8 |
| Percent probability of deck and road frost | 18 | 15 | 20 | 18 | 23 | 12 | 7 | 3.8 |
| Probability of precipitation | 19 | 16 | 21 | 9 | 13 | 26 | 20 | 3.8 |
| Snow accumulation | 20 | 28 | 9 | 19 | 24 | 13 | 21 | 3.8 |
| Visibility | 21 | 27 | 22 | 4 | 28 | 14 | 22 | 3.8 |
| Type of weather | 22 | 17 | 10 | 26 | 29 | 27 | 8 | 3.7 |
| Type of weather & precipitation | 23 | 18 | 11 | 27 | 30 | 28 | 9 | 3.7 |
| Relative humidity | 24 | 19 | 26 | 29 | 14 | 9 | 23 | 3.7 |
| Rain accumulation | 25 | 25 | 27 | 22 | 15 | 19 | 25 | 3.7 |
| Snow rate | 26 | 31 | 23 | 20 | 25 | 15 | 24 | 3.7 |
| Dew point temperature | 27 | 20 | 12 | 30 | 31 | 16 | 10 | 3.7 |
| Rain rate | 28 | 29 | 28 | 23 | 16 | 20 | 26 | 3.7 |
| Minimum air temperature | 29 | 21 | 30 | 28 | 17 | 17 | 29 | 3.6 |
| Estimated amount of precipitation in ranges | 30 | 26 | 29 | 24 | 18 | 30 | 31 | 3.5 |
| Maximum air temperature | 31 | 22 | 31 | 31 | 26 | 31 | 30 | 3.3 |
| Cloud cover | 32 | 32 | 32 | 32 | 32 | 32 | 32 | 2.3 |
A side-by-side comparison of the rankings and the related attribute average score from the three strategies (Table 5) shows some consistency across strategies, but the differences between the results from the different strategies are more noticeable. This likely is related to the differences in responsibilities associated with the implementation of the different road weather management strategies.
| Road Weather Element | Treatment | Control | Advisory | |||
|---|---|---|---|---|---|---|
| Rank | Score | Rank | Score | Rank | Score | |
| Pavement temperature | 1 | 4.3 | 17 | 3.8 | ||
| Air temperature | 2 | 4.2 | 10 | 4.0 | ||
| Road closures | 3 | 4.2 | 4 | 4.1 | 1 | 4.1 |
| Wind gust | 4 | 4.1 | 8 | 4.0 | ||
| Wind speed | 5 | 4.1 | 9 | 4.0 | 8 | 3.4 |
| Dew point temperature | 6 | 4.1 | 27 | 3.7 | ||
| Wind direction | 7 | 4.0 | 7 | 4.0 | 11 | 3.3 |
| Flood watches/warnings | 8 | 4.0 | 14 | 3.9 | 5 | 3.5 |
| Relative humidity | 9 | 4.0 | 24 | 3.7 | ||
| Precipitation type | 10 | 4.0 | ||||
| Minimum Air Temperature | 11 | 4.0 | 29 | 3.6 | 4 | 3.5 |
| Snow accumulation | 12 | 3.9 | 20 | 3.8 | ||
| Maximum Air Temperature | 13 | 3.9 | 31 | 3.3 | 7 | 3.4 |
| Type of precipitation or Y/N precipitation indicator | 14 | 3.9 | ||||
| Precipitation end time | 15 | 3.9 | ||||
| Flood potential | 16 | 3.9 | ||||
| Rain amount or liquid equivalent amount | 17 | 3.9 | ||||
| Rain accumulation | 18 | 3.9 | 25 | 3.7 | ||
| Probability of precipitation | 19 | 3.9 | 19 | 3.8 | 15 | 3.0 |
| Snow rate | 20 | 3.9 | 26 | 3.7 | ||
| Type of weather & precipitation | 21 | 3.9 | 23 | 3.7 | ||
| Type of weather condition | 22 | 3.9 | ||||
| Precipitation start time | 23 | 3.8 | ||||
| Probability of precipitation types | 24 | 3.8 | 16 | 3.9 | ||
| Type of Weather | 25 | 3.8 | 22 | 3.7 | 12 | 3.2 |
| Estimated amount of precipitation in ranges | 26 | 3.8 | 30 | 3.5 | 13 | 3.2 |
| Snow Amount | 27 | 3.8 | ||||
| Road conditions by highway segment | 28 | 3.8 | 13 | 3.9 | 2 | 3.7 |
| Winter advisories/watches/warnings | 29 | 3.8 | 15 | 3.9 | 9 | 3.4 |
| Visibility | 30 | 3.8 | 21 | 3.8 | 3 | 3.6 |
| Wind advisories/watches/warnings | 31 | 3.8 | 11 | 3.9 | 14 | 3.1 |
| Probability of deck and road frost | 32 | 3.8 | ||||
| Pavement condition | 33 | 3.8 | 12 | 3.9 | ||
| Rain rate | 34 | 3.8 | 28 | 3.7 | ||
| Percent probability of deck and road frost | 35 | 3.8 | 18 | 3.8 | ||
| Freeze point temperature | 36 | 3.7 | ||||
| Treatment recommendation | 37 | 3.7 | ||||
| Severe thunderstorm watches/warnings | 38 | 3.7 | 3 | 4.1 | 10 | 3.3 |
| Flood stage | 39 | 3.6 | ||||
| Dense fog advisories | 40 | 3.6 | 5 | 4.0 | 6 | 3.5 |
| River stage | 41 | 3.5 | ||||
| Cloud cover | 42 | 3.4 | 32 | 2.3 | ||
| Flow rate | 43 | 3.4 | ||||
| Chemical concentration | 44 | 2.9 | ||||
3.2 Baseline Characterization of Road Weather Information Products
The Product Type QAM quality attribute averages (Table 6) are slightly higher than those of the Element survey, and indicate a "high" quality rating for all management strategies. This suggests a general acceptance for the quality of the information products, and the incorporation of road weather elements within the product type packages tends to create a higher quality or more acceptable product.
The QAM composite measurement values and ranking of attributes for the Treatment strategy (Table 7) show the same consistency in the highest and lowest quartiles as seen in the element analysis. One noticeable inconsistency occurs in the Currency/Latency and Ease of Use rankings between Product Types, which suggest further assessment and monitoring are needed over time. The low ranking of Currency/Latency for the Road Condition Report product type may indicate users see an issue with the methodology of transferring road condition reports from the field to the user's display. Also, the low ranking of Ease of Use for the Weather History product type indicates the site-specific data presentation mode causes users problems and may be an area for improvement.
| Quality Attributes |
Maximum Value |
Minimum Value |
Mean | Median | Standard Deviation |
|
|---|---|---|---|---|---|---|
| Composite Measure | A | 4.6 | 3.9 | 4.2 | 4.1 | 0.3 |
| C | 4.3 | 3.2 | 3.8 | 3.8 | 0.5 | |
| T | 4.5 | 3.4 | 3.9 | 3.9 | 0.4 | |
| Accuracy / Precision | A | 4.5 | 3.9 | 4.2 | 4.1 | 0.3 |
| C | 4.5 | 3.0 | 4.0 | 4.0 | 0.6 | |
| T | 4.3 | 3.0 | 3.8 | 4.0 | 0.4 | |
| Completeness | A | 4.5 | 3.9 | 4.1 | 3.9 | 0.3 |
| C | 4.8 | 3.0 | 3.6 | 3.3 | 0.7 | |
| T | 4.5 | 3.0 | 3.8 | 3.8 | 0.4 | |
| Relevance | A | 4.5 | 3.9 | 4.1 | 4.1 | 0.3 |
| C | 4.3 | 3.0 | 3.7 | 3.8 | 0.5 | |
| T | 4.5 | 3.0 | 3.9 | 3.9 | 0.4 | |
| Currency / Latency | A | 4.8 | 3.6 | 4.1 | 4.1 | 0.5 |
| C | 4.5 | 3.0 | 3.6 | 3.7 | 0.7 | |
| T | 4.7 | 3.0 | 3.8 | 3.8 | 0.5 | |
| Timeliness / Reliability | A | 4.8 | 3.9 | 4.2 | 4.0 | 0.4 |
| C | 4.0 | 3.0 | 3.5 | 3.7 | 0.5 | |
| T | 4.8 | 3.3 | 4.0 | 4.1 | 0.4 | |
| Ease of Use | A | 4.8 | 3.8 | 4.2 | 4.2 | 0.4 |
| C | 4.3 | 3.3 | 4.0 | 4.0 | 0.4 | |
| T | 4.4 | 3.6 | 4.0 | 4.1 | 0.3 |
| Road Weather Product Type |
RANK | Average Composite Attribute Score | ||||||
|---|---|---|---|---|---|---|---|---|
| Composite Measure | Accuracy / Precision | Complete ness | Relevance | Currency / Latency | Timeliness / Reliability | Ease of Use | ||
| MDSS | 1 | 6 | 1 | 1 | 1 | 1 | 5 | 4.3 |
| Pavement Forecast | 2 | 5 | 4 | 2 | 5 | 4 | 1 | 4.2 |
| History Listing | 3 | 3 | 2 | 4 | 4 | 6 | 4 | 4.2 |
| Regional Map of Road Weather Parameter | 4 | 1 | 3 | 5 | 3 | 3 | 2 | 4.1 |
| Current Conditions | 5 | 2 | 5 | 3 | 2 | 2 | 3 | 4.1 |
| Weather Summary | 6 | 8 | 8 | 7 | 8 | 7 | 7 | 4.1 |
| Road Condition Report | 7 | 7 | 7 | 6 | 10 | 9 | 6 | 4.0 |
| Weather History (Site Specific) | 8 | 4 | 6 | 9 | 6 | 5 | 13 | 4.0 |
| Watches and Warnings | 9 | 9 | 10 | 8 | 7 | 10 | 9 | 4.0 |
| Flood Warning | 10 | 10 | 9 | 10 | 9 | 11 | 12 | 4.0 |
| Local / Regional Forecast | 11 | 11 | 11 | 12 | 11 | 12 | 11 | 4.0 |
| Road Weather Alert | 12 | 12 | 12 | 11 | 12 | 13 | 8 | 3.9 |
| Verbal Forecast | 13 | 13 | 13 | 13 | 13 | 8 | 10 | 3.9 |
The attribute rankings and the composite measure scores for the Control and Advisory strategies (Table 8 and Table 9) show similar relationships as those in the Treatment strategy.
| Road Weather Product Type |
RANK | Average Composite Attribute Score | ||||||
|---|---|---|---|---|---|---|---|---|
| Composite Measure | Accuracy / Precision | Complete ness | Relevance | Currency / Latency | Timeliness / Reliability | Ease of Use | ||
| Camera Images | 1 | 1 | 1 | 3 | 1 | 1 | 2 | 4.3 |
| Road Condition Report | 2 | 2 | 2 | 1 | 3 | 3 | 1 | 4.3 |
| Watches and Warnings | 3 | 3 | 4 | 2 | 2 | 2 | 3 | 3.8 |
| Zone Forecasts | 4 | 4 | 3 | 4 | 4 | 4 | 5 | 3.3 |
| Pavement Forecast | 5 | 5 | 5 | 5 | 5 | 5 | 4 | 3.2 |
| RANK | Average Composite Attribute Score | |||||||
|---|---|---|---|---|---|---|---|---|
| Road Weather |
Composite Measure | Accuracy / Precision | Completeness | Relevance | Currency / Latency | Timeliness / Reliability | Ease of Use | |
| Route Specific Forecast | 1 | 1 | 1 | 1 | 1 | 1 | 1 | 4.6 |
| Road Condition Report | 2 | 2 | 2 | 2 | 2 | 3 | 3 | 4.2 |
| Watches and Warnings | 3 | 3 | 3 | 3 | 3 | 2 | 2 | 4.1 |
| Zone Forecast | 4 | 4 | 4 | 4 | 4 | 4 | 4 | 3.9 |
4.0 Ongoing Quality Characterization Monitoring
The future use of enhanced road weather information depends on the quality of the information as expressed by the six quality attribute measures defined in the baseline characterization. Improved quality of road weather information is expected to result in expanded and enhanced utilization of this information.
Developing user confidence in road weather information requires quality assurance. How well this confidence is achieved will depend on the changes in road weather information quality attributes. Ongoing monitoring will provide a road weather community "report card" and indicate needed improvements.
4.1 Performance Analysis Time Interval Requirements
Improvements in the quality of road weather information over the past half century generally have been derived from gradual technological advances and rapid transitions in one or more of the technological support mechanisms. Gradual changes may be attributed to ongoing improvements in instrumentation, and the continual steady improvement in forecast accuracy. However, road weather has also benefited from the introduction of significant changes in the road weather information support structure that has accelerated and/or greatly altered the use of road weather information.
One measure for the rate of occurrence of advancements in the road weather community is the frequency of major new road weather initiatives. Typically, one of these federal and/or academic research and development initiatives (e.g., MDSS) concludes approximately every four years, following a development period ranging from two to six years.
Often, improvements in road weather information are the result of advances in the road weather service provider community. These improvements are induced from various factors including market competitiveness resulting in quality improvement in road weather products, more stringent quality requirements within DOT contract language with road weather service providers, and improved technology utilization by the road weather service providers and the DOTs in applying quality monitoring to raw and derived road weather information. Realization of growth in road weather technologies from road weather service providers is generally at the time scale of the procurement of road weather services that range from one to three years.
Finally, the interval of change in road weather utilization involves the human factors involving the user community. The upswing in recent years in road weather emphasis at the federal and state level has no doubt resulted in a greater awareness of road weather management in the road weather user community. This has resulted in an annual increase in the sophistication of the user base, particularly in winter maintenance.
Figure 2 illustrates the above features associated with the uptake of technology, and the growth of road weather information use where the vertical axis depicts the variability in the timing associated with each feature. The red, horizontal, dashed line represents an average period across the three measures. This average of approximately two years across these initiatives represents a reasonable period for performing a re-characterization of road information quality.
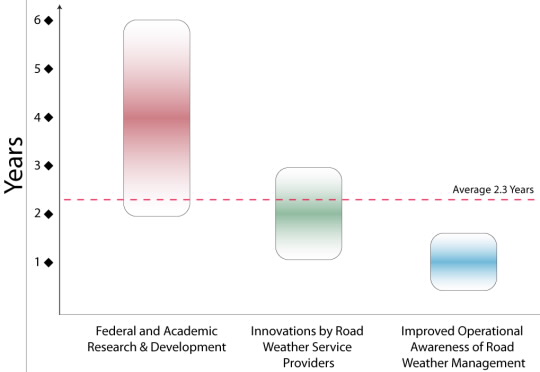
Figure 2. Average duration of road weather technology initiatives and the recommended frequency for characterizing road weather information
4.2 Method for Ongoing Road Weather Quality Characterization
Measuring future variations in the quality characteristics of road weather information will require establishing methods acceptable to the road weather community. Acceptable methods will share various fundamental protocol and data gathering requirements:
- Protocols that are open and documented;
- Protocols that are repeatable;
- Protocols that provide objective statistical measures;
- Data are representative of the current road weather state of the practice;
- Data have minimal human bias; and,
- Data are appropriate to a long-term longitudinal study of quality characteristics.
A challenging issue in implementing a method for ongoing characterization of road weather information is ensuring a consistent involvement of transportation agency individuals knowledgeable of road weather information quality attributes.
The recommended elements for the ongoing road weather characterization are:
- A sampling methodology using a well-defined questionnaire;
- A stakeholder community sample taken at two-year intervals for each of the road weather management strategy areas of Advisory, Control, and Treatment;
- Characterization results that reside in a long-lived relational database; and,
- A database that is openly accessible by the road weather community.
5.0 Strategies for Implementation of a Monitoring Process
It is recommended that, in addition to oversight for the monitoring process, the Federal Highway Administration (FHWA) Road Weather Management Program also assume the responsibility for establishing a road weather information quality attribute database. After reviewing and revising previously used questionnaires, a set of questionnaires should be developed and applied during the federal fiscal year 2010. Subsequent questionnaires and database updates should occur every two years for a period of no less than ten years.
The protocol used in the implementation of the monitoring process should be presented for open discussion at appropriate road weather community stakeholder meetings. Further, a state of the quality of road weather information findings summary report should be prepared and distributed at the aforementioned meetings, as well as through an electronic distribution to the road weather community as a whole.
6.0 Anticipated Outcomes from Ongoing Monitoring
Although the present quality levels within the road weather community are considered to be toward the high end of the quality value scale, there exists considerable room for improvement. This is particularly true for the quality assessments in the Control and Treatment management areas.
A forward looking premise is that changes in quality will result in improved data quality and measurable variation, and over time element and product attributes of road weather information use will improve. The following are anticipated outcomes of the ongoing monitoring of quality characteristics:
- Improved Road Weather Observations;
- Improved Traveler Advisory Content with Road Weather Information;
- Improved Winter Maintenance Tactical Response to Snow and Ice Conditions;
- Improved Responsiveness by Traffic Managers on Placing Weather-Related Traffic Controls;
- Higher Quality Road Weather Products Provided by the Road Weather Service Provider Community;
- Greater Confidence by Transportation Personnel in Road Weather Products and Services;
- Incentives for Improvement of Instrumentation or Processing to Address Elements Perceived as Low Quality Resources; and,
- Continuing System Improvement for Road Weather Information Products.