
Baselining Current Road Weather Information

Final Report
FHWA Publication No.: FHWA-JPO-09-055
June 2009
![]() You will need the Adobe Reader to view the PDFs on this page.
You will need the Adobe Reader to view the PDFs on this page.
PDF (4.8 MB)
Notice
The US Department of Transportation provides high-quality information to serve Government, industry, and the public in a manner that promotes public understanding. Standards and policies are used to ensure and maximize the quality, objectivity, utility, and integrity of its information. The USDOT periodically reviews quality issues and adjusts its programs and processes to ensure continuous quality improvement.
|
1. Report No.
FHWA-JPO-09-055 |
2. Government Accession No. |
3. Recipient's Catalog No.
EDL No. 14486 |
||||||||
|
4. Title and Subtitle
Baselining Current Road Weather Information: Final Report |
5. Report Date
June 10, 2009 |
|||||||||
| 6. Performing Organization Code | ||||||||||
|
7. Author(s)
Robert Hart and Leon Osborne (Meridian Environmental Technology, Inc.) and Steve Conger (Iteris, Inc.) |
8. Performing Organization Report No. | |||||||||
9. Performing Organization Name and Address
|
10. Work Unit No. (TRAIS) | |||||||||
|
11. Contract or Grant No.
DTFH61-06-D-00006; Task Order 2 |
||||||||||
|
12. Sponsoring Agency Name and Address
Research and Innovative Technology Administration |
13. Type of Report and Period Covered
Final Report, 8/24/07 - 6/30/09 |
|||||||||
|
14. Sponsoring Agency Code
HOIT |
||||||||||
|
15. Supplementary Notes
Dr. Roemer Alfelor (COTM) |
||||||||||
|
16. Abstract
This final report contains research findings on the characterization of the quality and value of road weather information resources used by members of the surface transportation community in their decision-making process. The objectives of the project were to identify current road weather information resources, develop a process to measure the quality of road weather information, and establish a baseline metric of the existing resources, and the recommendation of a strategy for an ongoing monitoring program. The project evaluated the existing sources of road weather information and the methods used by departments of transportation (DOT) to use this information for both internal and external applications. The analysis of weather service provider sources, road weather products, and DOT uses of the data permitted the research team to define six quality attributes that could be used to measure DOT users' perception of road weather data quality and value. The road weather information that DOTs receive/use were separated into product type packages and the basic weather elements within the resource deliverables. The baseline assessment of quality was accomplished through an online survey. DOT personnel who use road weather information routinely as part of their daily operations participated in the survey. The report details the organization of the survey responses into a quality attribute matrix and then analyzes the results of the survey. The report addresses variable user responses within and amongst quality attribute classes that illustrate the strengths and weaknesses of specific products and weather elements. The resulting measures from the survey serve to establish quality markers and point out road weather products or elements that could benefit from improvement. The technique chosen to characterize the quality of existing road weather information for this study was evaluated as the project evolved to assess its viability for an ongoing quality characterization monitoring program. The team also looked at appropriate time intervals for regular quality assessment, and evaluated the potential impacts of issues that occurred during the quality characterization process. The report evaluates these factors and proposes a strategy for implementing a regular quality assessment monitoring program. Finally, the research report projects the team's anticipated outcomes from an ongoing road weather quality monitoring program. |
||||||||||
|
17. Key Word
Road weather information; baselining road weather information; quality attribute matrix |
18. Distribution Statement | |||||||||
| 19. Security Classif. (of this report) | 20. Security Classif. (of this page) |
21. No. of Pages
90 |
22. Price | |||||||
Introduction
This report represents the culmination of a study to baseline the quality and availability of road weather information within the US as of early 2008. The study was performed to fulfill research requirements established by the FHWA Road Weather Management Program. The research was done by Booz Allen Hamilton (BAH) and its subcontractors Meridian Environmental Technology, Inc., Iteris, Inc., and the Surface Transportation Weather Research Center at the University of North Dakota. The primary tasks of the study consisted of:
- Identifying the published sources and content of available road weather information;
- Determining the discrete road weather components a department of transportation (DOT) uses to support decision making;
- Selecting quality descriptors used to establish a reproducible measure of quality of the road weather components;
- Querying state DOT stakeholders and end users' opinions regarding road weather quality;
- Synthesis of stakeholder and end users' responses into a quality snapshot; and,
- Recommendation of future quality change monitoring efforts
Objectives
The overall objective of this study was to characterize the availability and quality of road weather information to serve as a baseline for future comparisons of enhanced road weather information enabled by the Clarus system and other advanced road weather management technologies. The study also focused on the content and usefulness of road weather information.
One primary objective was to provide clear and useful measures of the quality of current road weather information sources in a method effective for continued use to capture changes in the perceived quality of the information. The study provides a catalog and characterization of the pre-Clarus road weather information state of practice and recommends strategies to monitor change.
A key element of this study is a review of how change may be reflected through the intrinsic characteristics of road weather information. Fundamental to this is defining a quantifiable measure of road weather information quality such that future change is measurable, and the introduction of Clarus-enabled road weather information does not alter the character of the information or require new metrics.
Working Assumptions
While overall this was not considered to be a particularly high-risk project, there were some potential constraints associated with results of the project.
- The success of stakeholder inputs depended upon the openness of stakeholders' feedback to the information developed in this project. It also relied upon stakeholders' perception of the quality and value of road weather information product types. Where relevant, particular insight gained by the study team regarding user input and the unique relationships involved in assessing quality are included in the discussion.
The potential Quality Attributes were predefined and provided by FHWA Road Weather Management Team. The final Attributes and their definitions were developed iteratively between the BAH and Road Weather Management teams until there was consensus.
Study Tasks
The Baselining Current Road Weather Information study scope of work was organized by tasks. These tasks are summarized in the following synopsis.
Task 1 Project Management
The BAH team developed a Project Management Plan (PMP) that served as a road map for the project. The progress toward meeting the milestones within the PMP was monitored through monthly progress reports and routine conference calls between the research team and the COTM.
Task 2 Research and Characterize Available Road Weather Information
The research team identified existing road weather data and information sources and evaluated quality attributes that enable the assessment of the current state of the practice. This was accomplished through a scan of existing source road weather information and the characterization of the content within these sources. The scan incorporated active feedback from industry and government stakeholders familiar with road weather information or actively use the information in their daily operations. The primary task was divided into two sub-tasks.
Task 2.1 Scan Road Weather Information Sources
The BAH team characterized the existing road weather information state of the practice by:
- Identifying the full spectrum of road weather observations and forecasts available from public and private providers;
- Listing the communications methods utilized to disseminate road weather observations and forecast information; and,
- Identifying the quality attributes employed by DOT agencies to evaluate the quality of each of the identified sources of road weather information.
The results from a detailed scan of providers and DOT users of road weather information were compiled in two tables, one describing the providers and the content each provider supplied and the second listing each State DOT and their respective advanced traveler information resources. The results were submitted to the FHWA in an interim report.
Task 2.2 Characterize Road Weather Information
The execution of the baseline road weather information survey and data analysis was accomplished in this sub-task. The final baseline results reflected a series of steps necessary to design the measurement instrument, collect stakeholder input, and analyze the stakeholder feedback. Key stages in the process were:
- The establishment of quality attributes that define the construct of road weather information quality;
- The selection of a method to create a quality measure that permitted the formation of a baseline metric and a mechanism for future assessment of quality;
- The formation of a summary matrix to consolidate information about the road weather resource components;
- The development and subsequent execution of an online survey to collect stakeholder feedback;
- The consolidation and organization of the survey results in a spreadsheet format to support further analysis of the results;
- Analysis and cross comparisons of the survey results; and,
- Summarization of the results in the Quality Attribute Matrix and related tables.
The processes, the logic behind the chosen methods, and the results were presented in an interim report on the Characterization of Road Weather Information.
Task 3 Recommend Tracking and Comparison Procedures
The results of Task 2 yielded an extensive set of information on the character of road weather. Task 2.2 had provided a baseline measure that could be used for comparison; however, the execution and analysis of the survey results yielded considerable insight into the interrelationships between the product types and elements and the users different assessment of quality across the six attribute categories. Task 3 synthesized the results and formulated recommendations regarding what were deemed the appropriate procedures for a potential ongoing quality assessment program based upon the lessons learned in the baseline study. Specific accomplishments included:
- The establishment of the parameters, quality metrics, and survey mechanism to assess the quality of road weather information;
- The recommendation of an ongoing monitoring and collection method; and,
- The recommendation of an appropriate time interval to execute analyses of road weather information quality.
The results from the study were summarized in a final executive report distributed to a group of DOT individuals who actively use road weather information in their operations. The group included DOT personnel from 40 states with operational responsibilities covering maintenance, traffic operations, and those responsible to issue advisory and control messages. This group responded to a short survey regarding the results of the survey and the need to continue the evaluation as an ongoing program.
Task 4 Recommend Tracking and Comparison Procedures
Task 4 encompassed the preparation and submittal of this final report, a two-page flyer, and the organization of materials for PowerPoint presentations. The results and recommendations were presented at the Transportation Research Board's and American Meteorological Society's annual meetings, and the materials are available for Clarus and related surface transportation meetings.
Study Produced Reports
The study produced several interim reports addressing specific activities or sub tasks. These included:
- Project Management Plan
- Road Weather Information Sources (Task 2.1)
- Characterization of Road Weather Information (Task 2.2)
- Recommendations for Tracking and Comparing the Characterization of Road Weather (Task 3)
- Baselining Current Road Weather Information: Summary Report (Task 3)
Study Contributions
This study provides a comprehensive evaluation of road weather information. Road weather information encompasses weather, road surface conditions, flooding, camera images, or advisory messages that affect transportation related activities. Road weather information is typically separated into discrete elements for exchange from weather service providers to the ultimate end users. These discrete road weather elements are consolidated and/or reformulated into new products by public and private weather service providers, and then delivered to transportation users in packages of information (products). These packages are collectively called product types, and they have evolved by mutual agreement between the provider sources and the end user transportation community.
Relevance to Clarus
According to the Clarus Initiative web site,
Clarus is a Federal Highways Administration research and development initiative to demonstrate and evaluate the value of "Anytime, Anywhere Road Weather Information" that is provided as an integral part of the road weather support packages delivered to the spectrum of transportation users and operators. The goal of the initiative is to create a robust data assimilation, quality checking, and data dissemination system that can provide near real-time atmospheric and pavement observations from the collective state's investments in road weather information system (RWIS) environmental sensor stations (ESS) as well as mobile observations from Automated Vehicle Location (AVL) equipped trucks.
Transportation system operators and weather service providers utilize the basic elements from the road weather sources. These data processing organizations include entities responsible for gathering the raw road weather observations, adding value to observations by generating derived information from the observations, and using the raw information to generate decision-making guidance. Figure 1 illustrates the processes involved in the transfer of raw road weather information from its sources through the primary service providers to the eventual end users.
Transportation system operators and users responsible for decisions impacted by weather benefit from the resulting road weather information. The transfer or transition of raw road weather data from its raw format to a form that end users may use to support their own decision process is often a complex process that incorporates a number of transformations or reorganizations of the original data sources. Thus, there are a number of intermediate steps in the road weather data delivery process that either formulate the data as new parameters or recompose the raw information into a more readily usable format.
A source may be a starting place where data are observed or generated, such as ESS observations, numerical weather model output, or maintenance vehicle treatment actions. A source may also be reformatted data or new resources derived from multiple data elements to create new services (e.g., forecasts, watches/warnings, advisory messages). Modified data formats are designed to meet the specific needs of the decision-maker consumer.
The flow of information in Figure 1 emphasizes the role Clarus plays in the transfer process. The points where the road weather data reaches the end users are denoted with circles and represent Road Weather Baseline Quality Assessment Points. Points where assumptions must be made by the intermediate data users about the quality of the data are also highlighted. These are the points in the flow where data quality has a fundamental influence on the quality of the road weather information reaching the end user; that is, the use by a weather service provider assumes the data is of acceptable or high enough quality to pass the data or create a reformatted product. The confidence of the intermediate users directly relate to their assumptions about the data quality at these points.
The process of Baselining Current Road Weather Information actually occurs at the bottom of the diagram in Figure 1 where the open red circles exist. The raw weather and pavement observations are input values at the top of the diagram. Essentially all of the raw data is modified or reconfigured before users gain access to the data from Secondary Sources. The Intermediary Sources are primarily the recipients of the raw data and these sources become the primary providers of the road weather information that is being evaluated in this study. How these Intermediary Sources package and deliver the raw road weather data significantly impacts the way end users evaluate the quality of road weather information. This fundamental construct influences many factors in the establishment and interpretation of the road weather information baseline process discussed in the remainder of this report.
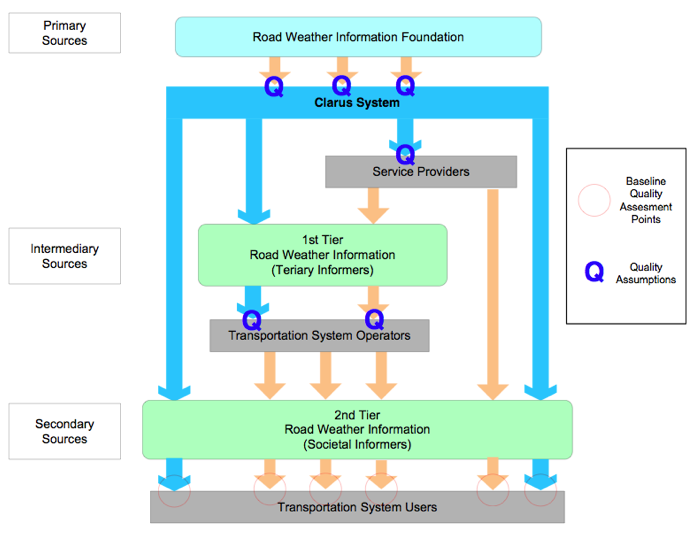
Figure 1. Illustration of the processes involved in the transfer of raw road weather data, value added data, and decision guidance to users.
Definitions Figure 1
The term source has dual meanings that are applicable in this study. A source can be a starting place or foundation; it can also be an informer or spokesperson. The starting places of road weather information are the roadside weather, pavement conditions, and traffic observations along with forecasting guidance from other origins. This we term the primary source. Another source of road weather information is the method or technology used as an informer to the traveler or driver such as 511, DMS, HAR, etc. We term this the secondary source. Weather service providers serve as intermediary sources to transportation system operators by creating road weather forecasts and decision support.
Identification of Weather Service and Road Weather Service Providers
An important objective of this project was to identify the road weather data and information sources available within the road weather community. Task 2.1 of the study involved the identification of current stakeholders in the weather enterprise, and the isolation of those entities in the weather enterprise that provide products and services supporting the road weather community. This effort involved the canvassing of available publicly listed information sources to prepare a comprehensive list of weather providers.
An initial comprehensive list of weather service providers was filtered to remove weather providers demonstrating a marginal relationship to the weather provider enterprise and/or had no relevance to the road weather user community. In the scan of providers, 192 weather service providers were identified with only 14 classified as road weather service providers. The list of 14 disregards companies who provide only instrumentation products, no forecasting or information services, and those companies that employ their own meteorologists to provide forecasting and weather consulting for internal use only. This constitutes 7.3% of the entire weather service provider community. All providers are listed and classified in Appendix A.
The road weather information user community was considered to include two general categories of users. The first was the road transportation agencies that provide direct support to the transportation infrastructure and support for the traveling public through the use of road weather products and services. This group primarily included state transportation divisions such as maintenance organizations and traffic management. The second road weather information user community was focused on those entities that provide direct support for travelers.
Using these definitions of the road weather information user community, a comprehensive scan was made to identify the information provided to each and to collect basic characterization information.
The research team performed a review of literature from TRB, state department of transportation studies, and university research reports. Particular benefit was gained in a review of a study completed for the Utah Department of Transportation (UDOT) by the Western Transportation Institute (WTI) (i.e. "Evaluation of the UDOT Weather Operations/RWIS Program: Phase I", published July 2007). In the UDOT study, a survey of road weather service providers was conducted by WTI that provided significant content relevant to the present scanning activity. The literature review of previous and/or ongoing FHWA RWMP projects yielded a limited amount of information. The dominant source of information was acquired through direct review of state agencies and the services they acquire and/or use.
In the scanning of road weather content utilized by transportation agencies, a particular focus was directed to the availability and use of road weather observations. This information was primarily focused on ESS data collected and utilized by state agencies. Additional services scanned include the road weather forecast information; for example, pavement conditions, pavement temperature, precipitation timing, etc. Besides road weather observations and forecasts, the sources and types of non-road weather observations and forecasts used by transportation agencies were collected. This information most often includes the use of weather radar, weather satellite, surface observations, and related resources that are often used in road weather decision-making.
For the scan of road weather services available to the traveling public, considerable effort was expended to review public web pages and the direct use of advanced traveler information system services provided by telephone; for example, 511 and other agency provided toll and toll-free telephone numbers.
The consolidation of the scan information is provided in Appendix B. For this effort, the elements of ESS data that were generally consistent across the agencies were not included in the tables to reduce the size of the tables. This was deemed prudent as all state departments of transportation utilize these data at varying levels except for the Mississippi Department of Transportation (DOT). The ESS content found to be generally uniform is provided in Appendix C.
Road Weather Information Characterization
An objective of the Baselining study was the determination of the perception of the end users towards the quality and value of the road weather information. In Task 2.2 of the study, the instrument developed to assess this receptivity and organize the results was the Quality Attribute Matrix (QAM).
Product Types, Elements, and Quality Attributes
The QAM assessment tool was developed around Product Types (packages of information representing the discrete resources that have evolved in the transfer of weather content from the meteorological community to the end user transportation community) that decision makers receive from various weather service providers (public and private). These "standard" packages typically contain observed or forecasted values for a number of distinct weather parameters. Transportation users normally need information on a number of discrete weather elements, and they generally understand which weather support packages contain the elements desired.
An additional effort in the baseline development process was the assessment of the quality of the discrete weather elements or weather representations derived from the raw elements (e.g., watches and warnings are considered a road weather element in this study even though it is a resource derived from several raw observed and forecasted meteorological elements). The intent of the "element approach" was the desire to ascertain the relative quality of the various basic weather parameters (reported, forecasted, or derived) used by transportation users to support their subsequent decision support needs. The Element approach fuses information resources from different time scales into one evaluation of the quality of the specific parameter. The Product Types and discrete Elements are listed in Table 1.
Table 1. Product Type and Element Categories Used in the Survey
| Road Weather Information | |
|---|---|
| Product Types | Elements |
| Camera Images | Precipitation start time |
| Current Conditions | Pavement temperature |
| Flood Warning | Probability of deck and road frost |
| History Listing | Percent probability of deck and road frost |
| Local / Regional Forecast | Probability of precipitation |
| MDSS | Pavement condition |
| Pavement Forecast | Dew point temperature |
| Regional Map of Road Weather Parameter | Flow rate |
| Road Condition Report | Cloud cover |
| Road Weather Alert | Freeze point temperature |
| Route Specific Forecast | Air temperature |
| Verbal Forecast | Chemical concentration |
| Watches and Warnings | Dense fog advisories |
| Weather History (Site Specific) | Flood potential |
| Weather Summary | Maximum Air Temperature |
| Zone Forecast | Precipitation type |
| Minimum Air Temperature | |
| Flood watches/warnings | |
| Flood stage | |
| Estimated amount of precipitation in ranges | |
| Probability of precipitation types | |
| Precipitation end time | |
| Rain accumulation | |
| Rain amount or liquid equivalent amount | |
| Rain rate | |
| Relative humidity | |
| River stage | |
| Road closures | |
| Road conditions by highway segment | |
| Severe thunderstorm watches/warnings | |
| Snow accumulation | |
| Snow Amount | |
| Snow rate | |
| Treatment recommendation | |
| Type of precipitation or Y/N precipitation indicator | |
| Type of Weather | |
| Type of weather & precipitation | |
| Type of weather condition | |
| Visibility | |
| Wind advisories/watches/warnings | |
| Wind direction | |
| Wind gust | |
| Wind speed | |
| Winter advisories/watches/warnings | |
The Product Type QAM provides a framework for the evaluation of product quality and value, as viewed from the end user's perspective. It includes a summary of the following attributes for each of the Product types:
- Accuracy/precision assessed by the user;
- The completeness of the information;
- The currency/latency of the information (relative to when they are received by the user);
- Relevance to user's needs;
- Timeliness of the information and reliable delivery of the required information; and,
- Ease of use of the information to be accessed and applied to the required situation, including the visual effectiveness of the data presentation.
The format of QAM is presented in Appendix D. The specific definitions of the heading columns include:
- Road Weather Information Class: Type of weather information: W = weather information only; RW = weather and pavement condition information
- Road Weather Information Type: Name given to the product type
- Description: Information contained in the product type
- Provider: The source of the product type: NWS = National Weather Service; DOT = Department of Transportation; STWSP = surface transportation weather service provider
- Informer: Agent delivering the product
- Delivery format: Mechanism for transferring the product to the end user
- Consumer: The end user
- Road Weather Elements: The weather or pavement condition elements in the product type
- CC = cloud cover
- Cond = representation of the snow, ice, water, and deicer layer on the road
- C% = percentage of chemical
- DP = dew point temperature
- FP = freeze point temperature of road surface layer
- P = precipitation type
- Pamt = liquid precipitation accumulation
- PavT = pavement surface temperature
- POP = probability of precipitation
- Prate = intensity of liquid precipitation
- P(Y/N) = precipitation type as YES or NO
- RC = road condition reported by the DOT
- Samt = snow accumulation
- Srate = intensity of snowfall
- T = temperature
- Tmax = maximum temperature
- Tmin = minimum temperature
- TR = treatment recommendation
- WD = wind direction
- Wgust = wind gust
- Winds = a textual combination of wind speed, wind direction, and gusts
- WS = wind speed
- Wx = type of present weather or precipitation type
- %Frost = probability of frost conditions
- Quality Attributes: Described in previous paragraph
- Composite Measure: A weighted average of all quality attribute responses
- Scan Reference: Source of the quality attribute data in the QAM
- Cost: Users' perceived cost of acquiring the data: 1 = cost to agency; 0 = free
- Perceived Benefit to Cost: 1= great benefit; 0 = no benefit
A slightly modified version of the QAM was created for the Element quality assessment.
The questions that would provide the information for the QAM were consolidated into a Quality Attribute survey instrument that addressed both the quality of road weather packages and the quality of the discrete weather elements.
The goals of the survey instrument were to sample users according to their use of weather information in particular road weather management strategy actions (i.e., advisory, control, and treatment). The survey was divided into three sections. The first section collected general information on the respondent for use in survey analysis, and to gain an understanding of the respondent's experience and awareness of road weather. The second section contained questions related to individual road weather elements. Finally, the third section contained questions related to road weather packages or weather product types.
The majority of the questions solicited responses using a five-point Likert scale to permit a numerical evaluation of user responses. Additional questions were asked with answers requiring specific categorical responses.
The study team feels that mental assessment of quality is done on a continuous spectrum ranging from no-quality to a maximum perceived quality. In the Baseline survey, it was assumed that all respondents in the sample were in a position to assess quality. People have difficulty transforming their mental impression of quality into the specific point on the continuum of possible quality values, but they can express their comprehension of quality in discrete categories that best represent the segment of the entire range that covers their assessed quality rank. Because people rebel against test queries offering too many options, the Likert categories were set to five to capture quality measure responses. To represent the discrete segment responses to the quality continuum, the research team opted to use common variance statistics. The transformation of discrete response values to a continuous representation is a common practice of variance statistics. The details of the data transformation can be found in the "Characterization of Road Information" report.
A commercial web-survey tool was employed to apply the survey instrument. This tool permitted respondents to skip questions that were not applicable to their experience. The survey instrument included a capability to provide a free form response to every question. Additionally, there were separate surveys for respondents in each of the three road weather management responsibility areas. The separate surveys were necessary due to the variability in road weather utilization across the advisory, control and treatment management strategies. While this resulted in a fracturing of the overall respondent pool, it was deemed necessary to better qualify the road weather characteristics in terms of the end user's responsibilities.
The acquisition of input from the DOT end user community was done in two ways: phone interviews and the survey instrument. The project team contacted individuals in each of the road weather management strategy areas (Advisory, Control, and Treatment) in thirty-five (35) state Departments of Transportation to identify their willingness to participate in the QAM development. An awareness of varying types of road weather conditions across differing geographical areas was considered in identifying these DOTs. This resulted in a diverse geographical distribution of DOTs in the survey efforts (Figure 2A). Of the original list of DOTs agreeing to complete the survey, twenty-six (26) DOTs completed the survey (Figure 2B).
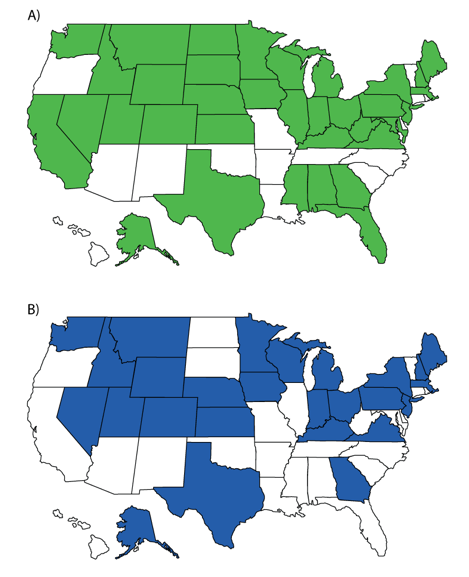
Figure 2. Map A indicates contacted states; Map B indicates participating states
In the development of the QAM for Product Types, the term 'Importance' was used in two different ways in the analysis: one associated with the quality attribute survey and the other dealing with the perceived worth of the individual elements that are contained within a given product. To differentiate the two meanings in this report, the former were called Attribute Importance and the latter named Element Importance. Attribute Importance reflects a critical character of a user's quality response. This ensures quality responses for attributes that are very important to the user in the evaluation of that particular product type receive greater weighting in the overall quality rating of that product type. The Element Importance delineated which of the elements within the product type were of greatest value to the respondent. The QAM facilitated the entry of the quality and attribute importance responses for each Attribute/Product Type pair. The Quality and Attribute Importance averages for a given Product Type were placed on separate rows. The number of responses incorporated in the quality and attribute importance averages were added as the third row within each quality attribute cell. In the QAM results for Product Types in Appendix D, the values in the light yellow/cream-colored cells are the Quality results for a given Product Type. The numbers in cells directly below that row with no fill are the attribute importance computations. These attribute importance average values are above the number of survey responses for the quality attributes for that product type. The scale for both of the Quality and Attribute Importance computations were Likert scale values that ranged from 1 (very low) to 5 (very high). Appendix E contains the QAM results for Elements. The number of survey responses in the Element QAM is in the columns to the right of the attribute section rather than in the stacked format used in the Product Type QAM.
Quality Attribute Analysis - General Findings and Conclusions
An important conclusion from the quality attribute analyses and comparisons of the quality attribute average rankings across the three road weather management strategies is that each management strategy brings varying road weather expertise and focus by the personnel engaged in these activities. Whether this difference is accounted for by the road weather experience level of the respondent, or whether the result is dependent upon operational successes and/or challenges experienced in the past by the respondent relative to road weather situations involving the various road weather elements, the assessment of quality of road weather information is a human factors issue that is not completely measurable from the responses to a survey instrument. Follow-up interviews with several respondents provided little clarification of the above issue and this factor suggests a future area of investigation that should be considered.
Highlighting a number of the general findings in this study provides an important pathway for consideration of how to apply the baseline characteristics of road weather information for applications to improve the quality of road weather information and for future applications of the baseline data in follow-on evaluations. The results of quality assessment process should provide transportation agencies, environmental sensor manufacturers, and road weather service providers important information to support quality improvements in road weather information.
The results derived from this study provide valuable insights into the processes used by users in ascribing quality measures to the road weather information in the user's decision-making process. In general, the characterization of road weather quality attributes indicates that the road weather information received to support treatment, advisory, and control road weather management strategies is relevant and reasonably complete but the accuracy or precision of the information received could be improved. A summary of several significant findings extracted from the results in the QAM is listed in Table 2.
Table 2. Summary of General QAM Findings
| Characterization of Road Weather Information General Findings |
|---|
| The higher quality averages for the Relevance attribute and lower quality averages for the Accuracy/Precision attribute indicate that users see many of the road weather elements as relevant to their operational decisions but not as accurate or precise as they would like. |
| The Ease of Use (EOU) attribute had the highest variance of all of the attributes indicating that users assess some elements as very easy to use and others as complex. The elements that received high EOU quality scores were primarily raw weather parameters and the elements that received low marks were predominantly derived road weather elements or "abstract" road weather parameters (chemical concentration, freeze point temperature, road conditions by segment). It was surprising to see elements such as severe thunderstorm watches/warnings and treatment recommendations at the bottom of the EOU list. |
| Often users perceive that some road weather product types do provide quality information; however, for their purposes these product types do not support their operational requirements and the attribute importance ranking is lower than the average. This results in a lower composite measure ranking for that product type. |
| Quality of road weather information appears to be biased by the worth of a particular road weather element resulting in a potential misrepresentation of the overall ranking of the quality of the road weather element. |
| For a number of road weather elements there is an inverse relationship between quality of an element and the importance of the element ranked within the product type section of the survey. |
| The quality attributes that tend to drive down the average quality values of several road weather elements are Accuracy/Precision and Ease of Use. |
| Differences between user expectations and quality performance may relate to issues associated with the specific element such as the measurement characteristics of instrumentation, the inadequacy of science to generate accurate forecasts, and the presentation of road weather elements in a format that are abstract or difficult to interpret. |
| Human factors have a significant influence on the manner by which users respond to the quality of road weather information. Techniques are needed to mitigate or at least minimize the effect of personal valuations of road weather information. |
| While the road weather characterization indicates a positive average quality for most road weather elements, the details of the individual quality attributes for each element provides guidance on aspects where the quality may be improved. |
The results, within constraints identified earlier relative to human factors, are expected to be repeatable in the future. The information provided in this report represents a reasonable assessment of the current state-of-the-practice, and the details found in the individual quality attributes for each road weather element indicate opportunities for improvement in the observation, processing, and delivery of road weather elements and for improvements in the generation of derived road weather products. It is expected that while a variation in individual quality attributes is to be expected in future surveys, the aggregation of the quality attributes are expected to provide a consistent comparative measure of road weather quality over time.
Current baseline characterization of road weather information
The two classes of road weather information, Product Types and Road Weather Elements, resulted in separate baseline characterizations for each class. A complete and detailed analysis of the resulting QAMs for each class is available in the accompanying full study report. Below is a summary of the findings for selected analyses.
Baseline Characterization of Road Weather Information Elements
The composite of all survey responses of the Road Weather Element attributes (Table 3) indicates the key variance parameters for each of the six quality attributes. These values were derived from the Element QAM shown in Appendix E. Within each quality attribute are sub-columns for Advisory strategies (A), Control strategies (C), and Treatment strategies (T). Quality attribute values for the individual Road Weather Elements clustered around the mean or median of 3.8 on a Likert scale, where the minimum value was 1 (very low quality) and the maximum value was 5 (very high quality). Most of the Road Weather Elements showed consistency in their average quality attributes.
Table 3. Aggregate quality attribute statistics for the Road Weather Elements as evaluated by road weather management strategy classification.
The road weather management strategies are denoted by: Advisory (A), Control (C), and Treatment (T).
| Quality Attributes |
Maximum Value |
Minimum Value |
Mean | Median | Standard Deviation |
|
|---|---|---|---|---|---|---|
| Composite Measure | A | 4.1 | 3.0 | 3.4 | 3.4 | 0.3 |
| C | 4.4 | 2.3 | 3.8 | 3.8 | 0.3 | |
| T | 4.3 | 2.9 | 3.8 | 3.9 | 0.2 | |
| Accuracy / Precision | A | 4.2 | 3.0 | 3.5 | 3.5 | 0.3 |
| C | 4.5 | 2.0 | 3.9 | 4.0 | 0.4 | |
| T | 4.2 | 2.4 | 3.6 | 3.6 | 0.3 | |
| Completeness | A | 4.1 | 2.4 | 3.3 | 3.3 | 0.4 |
| C | 4.3 | 2.5 | 3.5 | 3.5 | 0.3 | |
| T | 4.3 | 2.9 | 4.0 | 4.1 | 0.3 | |
| Relevance | A | 4.3 | 2.8 | 3.2 | 3.2 | 0.4 |
| C | 4.8 | 1.7 | 3.9 | 4.0 | 0.6 | |
| T | 4.6 | 2.8 | 4.1 | 4.2 | 0.4 | |
| Currency / Latency | A | 4.0 | 3.2 | 3.5 | 3.5 | 0.2 |
| C | 4.3 | 2.5 | 3.3 | 3.3 | 0.5 | |
| T | 4.4 | 3.5 | 3.9 | 3.9 | 0.2 | |
| Timeliness / Reliability | A | 4.0 | 2.9 | 3.4 | 3.4 | 0.3 |
| C | 4.8 | 3.0 | 4.2 | 4.3 | 0.4 | |
| T | 4.3 | 3.1 | 3.8 | 3.8 | 0.2 | |
| Ease of Use | A | 4.1 | 4.1 | 3.5 | 3.5 | 0.3 |
| C | 4.8 | 2.3 | 4.0 | 4.0 | 0.5 | |
| T | 5.0 | 2.1 | 3.7 | 3.8 | 0.5 |
Relationships between Elements and quality attribute responses proved difficult using the raw quality attribute values, so the attribute average values were placed in descending order for each quality attribute category and the rankings were color coded into quartiles. The specific road weather elements from the Treatment category showed distinct patterns when ranked by these quartiles (Table 4). Pavement temperature, road closures, flood watches and warnings, and weather parameters were viewed as the highest quality elements (top quartile). Experience with treatment activities suggests these are trusted elements within a treatment strategy. Meanwhile, cloud cover, chemical concentration, and treatment recommendation received low quality marks (bottom quartile).
Elements in the top and bottom quartiles were consistent across almost all attributes, and will serve as good measures for benchmarking future assessments for the Treatment strategy.
Table 4. Treatment attribute rankings for Road Weather Elements listed in colors by quartiles; 1st quartile (green), 2nd quartile (blue), 3rd quartile (yellow), and 4th quartile (orange).
| Road Weather Element |
RANK |
Average Composite Attribute Score | ||||||
|---|---|---|---|---|---|---|---|---|
| Average Rank | Accuracy / Precision | Completeness | Relevance | Currency / Latency | Timeliness / Reliability | Ease of Use | ||
| Pavement temperature | 1 | 1 | 1 | 1 | 6 | 4 | 3 | 4.3 |
| Air temperature | 2 | 2 | 2 | 10 | 1 | 9 | 2 | 4.2 |
| Road closures | 3 | 3 | 25 | 18 | 3 | 31 | 1 | 4.2 |
| Wind gust | 4 | 13 | 5 | 2 | 7 | 5 | 7 | 4.1 |
| Wind speed | 5 | 14 | 6 | 3 | 8 | 6 | 8 | 4.1 |
| Dew point temperature | 6 | 5 | 14 | 26 | 2 | 10 | 14 | 4.1 |
| Wind direction | 7 | 6 | 15 | 22 | 13 | 12 | 9 | 4.0 |
| Flood watches/warnings | 8 | 11 | 4 | 37 | 17 | 2 | 5 | 4.0 |
| Relative humidity | 9 | 8 | 10 | 17 | 10 | 11 | 15 | 4.0 |
| Precipitation type | 10 | 10 | 7 | 6 | 18 | 30 | 12 | 4.0 |
| Minimum Air Temperature | 11 | 15 | 12 | 33 | 11 | 32 | 6 | 4.0 |
| Snow accumulation | 12 | 26 | 23 | 8 | 14 | 28 | 16 | 3.9 |
| Maximum Air Temperature | 13 | 16 | 13 | 36 | 12 | 33 | 13 | 3.9 |
| Type of precipitation or Y/N precipitation indicator | 14 | 18 | 36 | 14 | 9 | 13 | 19 | 3.9 |
| Precipitation end time | 15 | 38 | 9 | 16 | 22 | 15 | 17 | 3.9 |
| Flood potential | 16 | 29 | 31 | 38 | 4 | 1 | 22 | 3.9 |
| Rain amount or liquid equivalent amount | 17 | 24 | 18 | 21 | 32 | 17 | 23 | 3.9 |
| Rain accumulation | 18 | 25 | 20 | 23 | 33 | 14 | 21 | 3.9 |
| Probability of precipitation | 19 | 12 | 11 | 32 | 25 | 21 | 28 | 3.9 |
| Snow rate | 20 | 37 | 22 | 12 | 30 | 41 | 4 | 3.9 |
| Type of weather & precipitation | 21 | 18 | 27 | 4 | 20 | 34 | 31 | 3.9 |
| Type of weather condition | 22 | 9 | 26 | 24 | 23 | 35 | 32 | 3.9 |
| Precipitation start time | 23 | 32 | 21 | 7 | 28 | 27 | 25 | 3.8 |
| Probability of precipitation types | 24 | 19 | 8 | 35 | 26 | 22 | 29 | 3.8 |
| Type of Weather | 25 | 20 | 28 | 13 | 21 | 25 | 33 | 3.8 |
| Estimated amount of precipitation in ranges | 26 | 33 | 39 | 25 | 24 | 16 | 10 | 3.8 |
| Snow Amount | 27 | 30 | 32 | 9 | 29 | 38 | 18 | 3.8 |
| Road conditions by highway segment | 28 | 7 | 16 | 5 | 43 | 18 | 40 | 3.8 |
| Winter advisories/watches/warnings | 29 | 4 | 3 | 20 | 35 | 44 | 34 | 3.8 |
| Visibility | 30 | 40 | 19 | 19 | 31 | 19 | 26 | 3.8 |
| Wind advisories/watches/warnings | 31 | 17 | 17 | 30 | 34 | 39 | 30 | 3.8 |
| Probability of deck and road frost | 32 | 27 | 24 | 27 | 40 | 37 | 27 | 3.8 |
| Pavement condition | 33 | 35 | 35 | 34 | 16 | 29 | 20 | 3.8 |
| Rain rate | 34 | 43 | 33 | 31 | 27 | 26 | 24 | 3.8 |
| Percent probability of deck and road frost | 35 | 31 | 34 | 11 | 19 | 36 | 36 | 3.8 |
| Freeze point temperature | 36 | 42 | 37 | 15 | 15 | 7 | 39 | 3.7 |
| Treatment recommendation | 37 | 41 | 40 | 29 | 37 | 3 | 37 | 3.7 |
| Severe thunderstorm watches/warnings | 38 | 23 | 29 | 28 | 36 | 40 | 38 | 3.7 |
| Flood stage | 39 | 28 | 30 | 41 | 38 | 20 | 35 | 3.6 |
| Dense fog advisories | 40 | 36 | 41 | 39 | 44 | 23 | 11 | 3.6 |
| River stage | 41 | 34 | 42 | 42 | 5 | 24 | 43 | 3.5 |
| Cloud cover | 42 | 21 | 43 | 40 | 41 | 42 | 41 | 3.4 |
| Flow rate | 43 | 39 | 38 | 44 | 39 | 8 | 42 | 3.4 |
| Chemical concentration | 44 | 44 | 44 | 43 | 42 | 43 | 44 | 2.9 |
The inconsistency of second and third quartile rankings for each strategy indicates that each "average quality" element has its own unique rating characteristic. These quality "fingerprints" imply unique environmental factors influencing the users' perspective and represent markers for change in future baseline investigations.
Similar attribute rankings for the Control and Advisory strategies are shown in Tables 5 and 6. The elements selected for analyses within these strategies differed from the Treatment strategy; however, key elements in the top and bottom quartiles of the two additional tables demonstrate a similar consistency across all attributes; whereas, elements falling in quartiles 2 and 3 were more inconsistent.
Table 5. Control attribute rankings for road weather elements listed in colors by quartiles; 1st quartile (green), 2nd quartile (blue), 3rd quartile (yellow), and 4th quartile (orange).
| Road Weather Element |
RANK |
Average Composite Attribute Score | ||||||
|---|---|---|---|---|---|---|---|---|
| Attribute Average | Accuracy / Precision | Completeness | Relevance | Currency / Latency | Timeliness / Reliability | Ease of Use | ||
| View of the road | 1 | 6 | 13 | 1 | 1 | 1 | 1 | 4.4 |
| View of the weather | 2 | 11 | 14 | 2 | 2 | 2 | 2 | 4.3 |
| Severe thunderstorm watches/warnings | 3 | 1 | 2 | 11 | 3 | 21 | 16 | 4.1 |
| Road closures | 4 | 3 | 1 | 12 | 9 | 22 | 4 | 4.1 |
| Dense fog advisories | 5 | 4 | 6 | 5 | 19 | 3 | 5 | 4.0 |
| View of the traffic | 6 | 23 | 24 | 3 | 7 | 4 | 11 | 4.0 |
| Wind direction | 7 | 7 | 15 | 13 | 8 | 5 | 12 | 4.0 |
| Wind gust | 8 | 8 | 16 | 14 | 9 | 6 | 13 | 4.0 |
| Wind speed | 9 | 9 | 17 | 15 | 10 | 7 | 14 | 4.0 |
| Air temperature | 10 | 10 | 5 | 21 | 20 | 8 | 3 | 4.0 |
| Wind advisories/watches/warnings | 11 | 5 | 18 | 16 | 4 | 23 | 27 | 3.9 |
| Pavement condition | 12 | 12 | 7 | 6 | 27 | 10 | 6 | 3.9 |
| Road conditions by highway segment | 13 | 13 | 3 | 17 | 21 | 11 | 17 | 3.9 |
| Flood watches/warnings | 14 | 30 | 4 | 25 | 5 | 24 | 18 | 3.9 |
| Winter advisories/watches/warnings | 15 | 2 | 19 | 7 | 6 | 29 | 28 | 3.9 |
| Probability of precipitation types | 16 | 24 | 8 | 8 | 12 | 25 | 19 | 3.9 |
| Pavement temperature | 17 | 14 | 25 | 10 | 22 | 18 | 15 | 3.8 |
| Percent probability of deck and road frost | 18 | 15 | 20 | 18 | 23 | 12 | 7 | 3.8 |
| Probability of precipitation | 19 | 16 | 21 | 9 | 13 | 26 | 20 | 3.8 |
| Snow accumulation | 20 | 28 | 9 | 19 | 24 | 13 | 21 | 3.8 |
| Visibility | 21 | 27 | 22 | 4 | 28 | 14 | 22 | 3.8 |
| Type of weather | 22 | 17 | 10 | 26 | 29 | 27 | 8 | 3.7 |
| Type of weather & precipitation | 23 | 18 | 11 | 27 | 30 | 28 | 9 | 3.7 |
| Relative humidity | 24 | 19 | 26 | 29 | 14 | 9 | 23 | 3.7 |
| Rain accumulation | 25 | 25 | 27 | 22 | 15 | 19 | 25 | 3.7 |
| Snow rate | 26 | 31 | 23 | 20 | 25 | 15 | 24 | 3.7 |
| Dew point temperature | 27 | 20 | 12 | 30 | 31 | 16 | 10 | 3.7 |
| Rain rate | 28 | 29 | 28 | 23 | 16 | 20 | 26 | 3.7 |
| Minimum air temperature | 29 | 21 | 30 | 28 | 17 | 17 | 29 | 3.6 |
| Estimated amount of precipitation in ranges | 30 | 26 | 29 | 24 | 18 | 30 | 31 | 3.5 |
| Maximum air temperature | 31 | 22 | 31 | 31 | 26 | 31 | 30 | 3.3 |
| Cloud cover | 32 | 32 | 32 | 32 | 32 | 32 | 32 | 2.3 |
Table 6. Advisory attribute rankings for Road Weather Elements listed in colors by quartiles; 1st quartile (green), 2nd quartile (blue), 3rd quartile (yellow), and 4th quartile (orange).
| Road Weather Element |
RANK |
Average Composite Attribute Score | ||||||
|---|---|---|---|---|---|---|---|---|
| Attribute Average | Accuracy / Precision | Completeness | Relevance | Currency / Latency | Timeliness / Reliability | Ease of Use | ||
| Road closures | 1 | 1 | 1 | 1 | 1 | 1 | 1 | 4.1 |
| Road conditions by highway segment | 2 | 2 | 2 | 2 | 3 | 4 | 2 | 3.7 |
| Visibility | 3 | 4 | 3 | 3 | 2 | 5 | 3 | 3.6 |
| Minimum air temperature | 4 | 3 | 7 | 4 | 5 | 6 | 6 | 3.5 |
| Flood watches/warnings | 5 | 6 | 8 | 9 | 6 | 2 | 7 | 3.5 |
| Dense fog advisories | 6 | 7 | 12 | 5 | 7 | 7 | 4 | 3.5 |
| Maximum air temperature | 7 | 8 | 10 | 7 | 4 | 3 | 9 | 3.4 |
| Wind speed | 8 | 11 | 5 | 6 | 8 | 9 | 5 | 3.4 |
| Winter advisories/watches/warnings | 9 | 9 | 9 | 10 | 9 | 8 | 8 | 3.4 |
| Severe thunderstorm watches/warnings | 10 | 10 | 6 | 11 | 12 | 11 | 13 | 3.3 |
| Wind direction | 11 | 14 | 11 | 8 | 10 | 12 | 11 | 3.3 |
| Type of weather | 12 | 5 | 4 | 12 | 15 | 14 | 12 | 3.2 |
| Estimated amount of precipitation in ranges | 13 | 13 | 14 | 13 | 14 | 10 | 10 | 3.2 |
| Wind advisories/watches/warnings | 14 | 12 | 13 | 15 | 13 | 15 | 14 | 3.1 |
| Probability of precipitation | 15 | 15 | 15 | 14 | 11 | 13 | 15 | 3.0 |
A side-by-side comparison of the rankings from the three strategies (Table 7) shows some consistency across strategies, but the differences between the results from the different strategies are more noticeable. This is likely related to the differences in responsibilities associated with the implementation of the different road weather management strategies.
Table 7. Comparison of average quality attribute rankings of individual Road Weather Elements between treatment, control, and advisory road weather management strategies; 1st quartile (green), 2nd quartile (blue), 3rd quartile (yellow), and 4th quartile (orange).
| ROAD WEATHER ELEMENT | Treatment | Control | Advisory | |||
|---|---|---|---|---|---|---|
| Rank | Score | Rank | Score | Rank | Score | |
| Pavement temperature | 1 | 4.3 | 17 | 3.8 | ||
| Air temperature | 2 | 4.2 | 10 | 4.0 | ||
| Road closures | 3 | 4.2 | 4 | 4.1 | 1 | 4.1 |
| Wind gust | 4 | 4.1 | 8 | 4.0 | ||
| Wind speed | 5 | 4.1 | 9 | 4.0 | 8 | 3.4 |
| Dew point temperature | 6 | 4.1 | 27 | 3.7 | ||
| Wind direction | 7 | 4.0 | 7 | 4.0 | 11 | 3.3 |
| Flood watches/warnings | 8 | 4.0 | 14 | 3.9 | 5 | 3.5 |
| Relative humidity | 9 | 4.0 | 24 | 3.7 | ||
| Precipitation type | 10 | 4.0 | ||||
| Minimum Air Temperature | 11 | 4.0 | 29 | 3.6 | 4 | 3.5 |
| Snow accumulation | 12 | 3.9 | 20 | 3.8 | ||
| Maximum Air Temperature | 13 | 3.9 | 31 | 3.3 | 7 | 3.4 |
| Type of precipitation or Y/N precipitation indicator | 14 | 3.9 | ||||
| Precipitation end time | 15 | 3.9 | ||||
| Flood potential | 16 | 3.9 | ||||
| Rain amount or liquid equivalent amount | 17 | 3.9 | ||||
| Rain accumulation | 18 | 3.9 | 25 | 3.7 | ||
| Probability of precipitation | 19 | 3.9 | 19 | 3.8 | 15 | 3.0 |
| Snow rate | 20 | 3.9 | 26 | 3.7 | ||
| Type of weather & precipitation | 21 | 3.9 | 23 | 3.7 | ||
| Type of weather condition | 22 | 3.9 | ||||
| Precipitation start time | 23 | 3.8 | ||||
| Probability of precipitation types | 24 | 3.8 | 16 | 3.9 | ||
| Type of Weather | 25 | 3.8 | 22 | 3.7 | 12 | 3.2 |
| Estimated amount of precipitation in ranges | 26 | 3.8 | 30 | 3.5 | 13 | 3.2 |
| Snow Amount | 27 | 3.8 | ||||
| Road conditions by highway segment | 28 | 3.8 | 13 | 3.9 | 2 | 3.7 |
| Winter advisories/watches/warnings | 29 | 3.8 | 15 | 3.9 | 9 | 3.4 |
| Visibility | 30 | 3.8 | 21 | 3.8 | 3 | 3.6 |
| Wind advisories/watches/warnings | 31 | 3.8 | 11 | 3.9 | 14 | 3.1 |
| Probability of deck and road frost | 32 | 3.8 | ||||
| Pavement condition | 33 | 3.8 | 12 | 3.9 | ||
| Rain rate | 34 | 3.8 | 28 | 3.7 | ||
| Percent probability of deck and road frost | 35 | 3.8 | 18 | 3.8 | ||
| Freeze point temperature | 36 | 3.7 | ||||
| Treatment recommendation | 37 | 3.7 | ||||
| Severe thunderstorm watches/warnings | 38 | 3.7 | 3 | 4.1 | 10 | 3.3 |
| Flood stage | 39 | 3.6 | ||||
| Dense fog advisories | 40 | 3.6 | 5 | 4.0 | 6 | 3.5 |
| River stage | 41 | 3.5 | ||||
| Cloud cover | 42 | 3.4 | 32 | 2.3 | ||
| Flow rate | 43 | 3.4 | ||||
| Chemical concentration | 44 | 2.9 | ||||
Baseline Characterization of Road Weather Information Products
The Product Type QAM quality attribute averages (Table 8) are slightly higher than those from the Element survey. These values were derived from the Product Type QAM shown in Appendix D. The averages indicate a "high" quality rating for all management strategies and suggest a general acceptance for the quality of the information products. The incorporation of road weather elements within the product type packages seems to create a higher quality or more acceptable resource.
The QAM composite measure attribute rankings for the Treatment strategy (Table 9) show the same consistency in the highest and lowest quartiles as seen in the element analysis. One noticeable inconsistency occurs in the Currency/Latency and Ease of Use rankings between Product Types, which suggests further assessment and monitoring are needed over time. The low ranking of Currency/Latency for the Road Condition Report product type may indicate users see an issue with the methodology of transferring road condition reports from the field to the users. Also, the low ranking of Ease of Use for the Weather History product type indicates the site-specific data presentation mode causes users problems and may be an area for improvement.
Table 8. Aggregate quality attribute statistics for the Road Weather Product Types as evaluated by road weather management strategy classification.
The road weather management strategies are denoted by: Advisory (A), Control (C), and Treatment (T).
| Quality Attributes |
Maximum Value |
Minimum Value |
Mean | Median | Standard Deviation |
|
|---|---|---|---|---|---|---|
| Composite Measure | A | 4.6 | 3.9 | 4.2 | 4.1 | 0.3 |
| C | 4.3 | 3.2 | 3.8 | 3.8 | 0.5 | |
| T | 4.5 | 3.4 | 3.9 | 3.9 | 0.4 | |
| Accuracy / Precision | A | 4.5 | 3.9 | 4.2 | 4.1 | 0.3 |
| C | 4.5 | 3.0 | 4.0 | 4.0 | 0.6 | |
| T | 4.3 | 3.0 | 3.8 | 4.0 | 0.4 | |
| Completeness | A | 4.5 | 3.9 | 4.1 | 3.9 | 0.3 |
| C | 4.8 | 3.0 | 3.6 | 3.3 | 0.7 | |
| T | 4.5 | 3.0 | 3.8 | 3.8 | 0.4 | |
| Relevance | A | 4.5 | 3.9 | 4.1 | 4.1 | 0.3 |
| C | 4.3 | 3.0 | 3.7 | 3.8 | 0.5 | |
| T | 4.5 | 3.0 | 3.9 | 3.9 | 0.4 | |
| Currency / Latency | A | 4.8 | 3.6 | 4.1 | 4.1 | 0.5 |
| C | 4.5 | 3.0 | 3.6 | 3.7 | 0.7 | |
| T | 4.7 | 3.0 | 3.8 | 3.8 | 0.5 | |
| Timeliness / Reliability | A | 4.8 | 3.9 | 4.2 | 4.0 | 0.4 |
| C | 4.0 | 3.0 | 3.5 | 3.7 | 0.5 | |
| T | 4.8 | 3.3 | 4.0 | 4.1 | 0.4 | |
| Ease of Use | A | 4.8 | 3.8 | 4.2 | 4.2 | 0.4 |
| C | 4.3 | 3.3 | 4.0 | 4.0 | 0.4 | |
| T | 4.4 | 3.6 | 4.0 | 4.1 | 0.3 |
Table 9. Treatment attribute rankings for Road Weather Products listed in colors by quartiles; 1st quartile (green), 2nd quartile (blue), 3rd quartile (yellow), and 4th quartile (orange). Red denotes lowest rank determined.
| Road Weather Product Type |
RANK |
Average Composite Attribute Score | ||||||
|---|---|---|---|---|---|---|---|---|
| Composite Measure | Accuracy / Precision | Completeness | Relevance | Currency / Latency | Timeliness / Reliability | Ease of Use | ||
| MDSS | 1 | 6 | 1 | 1 | 1 | 1 | 5 | 4.3 |
| Pavement Forecast | 2 | 5 | 4 | 2 | 5 | 4 | 1 | 4.2 |
| History Listing | 3 | 3 | 2 | 4 | 4 | 6 | 4 | 4.2 |
| Regional Map of Road Weather Parameter | 4 | 1 | 3 | 5 | 3 | 3 | 2 | 4.1 |
| Current Conditions | 5 | 2 | 5 | 3 | 2 | 2 | 3 | 4.1 |
| Weather Summary | 6 | 8 | 8 | 7 | 8 | 7 | 7 | 4.1 |
| Road Condition Report | 7 | 7 | 7 | 6 | 10 | 9 | 6 | 4.0 |
| Weather History (Site Specific) | 8 | 4 | 6 | 9 | 6 | 5 | 13 | 4.0 |
| Watches and Warnings | 9 | 9 | 10 | 8 | 7 | 10 | 9 | 4.0 |
| Flood Warning | 10 | 10 | 9 | 10 | 9 | 11 | 12 | 4.0 |
| Local / Regional Forecast | 11 | 11 | 11 | 12 | 11 | 12 | 11 | 4.0 |
| Road Weather Alert | 12 | 12 | 12 | 11 | 12 | 13 | 8 | 3.9 |
| Verbal Forecast | 13 | 13 | 13 | 13 | 13 | 8 | 10 | 3.9 |
The attribute rankings for the Control and Advisory strategies (Tables 10 and 11) show similar relationships as those for the Treatment strategy.
Table 10. Control attribute rankings for Road Weather Products listed in colors by quartiles; 1st quartile (green), 2nd quartile (blue), 3rd quartile (yellow), and 4th quartile (orange). Red shading denotes lowest ranking.
| Road Weather Product Type |
RANK | Average Composite Attribute Score | ||||||
|---|---|---|---|---|---|---|---|---|
| Composite Measure | Accuracy / Precision | Completeness | Relevance | Currency / Latency | Timeliness / Reliability | Ease of Use | ||
| Camera Images | 1 | 1 | 1 | 3 | 1 | 1 | 2 | 4.3 |
| Road Condition Report | 2 | 2 | 2 | 1 | 3 | 3 | 1 | 4.3 |
| Watches and Warnings | 3 | 3 | 4 | 2 | 2 | 2 | 3 | 3.8 |
| Zone Forecasts | 4 | 4 | 3 | 4 | 4 | 4 | 5 | 3.3 |
| Pavement Forecast | 5 | 5 | 5 | 5 | 5 | 5 | 4 | 3.2 |
Table 11. Advisory attribute rankings for Road Weather Products listed in colors by quartiles; 1st quartile (green), 2nd quartile (blue), 3rd quartile (yellow), and 4th quartile (orange).
| RANK | Average Composite Attribute Score | |||||||
|---|---|---|---|---|---|---|---|---|
| Road Weather Product Type |
Composite Measure | Accuracy / Precision | Completeness | Relevance | Currency / Latency | Timeliness / Reliability | Ease of Use | |
| Route Specific Forecast | 1 | 1 | 1 | 1 | 1 | 1 | 1 | 4.6 |
| Road Condition Report | 2 | 2 | 2 | 2 | 2 | 3 | 3 | 4.2 |
| Watches and Warnings | 3 | 3 | 3 | 3 | 3 | 2 | 2 | 4.1 |
| Zone Forecast | 4 | 4 | 4 | 4 | 4 | 4 | 4 | 3.9 |
Task 3 Quality Analysis Tracking and Comparison Recommendations
The results of Task 3 provide a recommendation for future pathway toward the application of the baseline characteristics, and recommends strategies to monitor change. A key element of this study is the determination of how changes in users' perception of road weather information may be reflected through the valuation of its quality attributes. Future applications of road weather information performance measures will need to be accomplished in a manner that provides a clear understanding of the state of practice and best practices. Fundamental to this is defining what constitutes an improvement in quality over time. Parameters for each of the quality measures must be such that their change is measurable and the introduction of Clarus or other advances in technology do not alter their character or require new metrics.
For information users, the best assessment of quality will come from transportation agencies who use the data for their decision-making and provide the data to the traveling public. Present limitations in quality of certain road weather elements, as noted in this baseline study, have resulted in reservation and likely reduction in the use of these road weather information types among transportation agencies. A prime example of this is the low assessment of quality of chemical concentration information and the reduced emphasis being placed by some transportation maintenance agencies in using this data to make decisions, or in some situations the continued collection of the chemical concentration sensor data.
Developing confidence in road weather information of all types requires assurance of the quality of the basic data. Present observational data programs such as the NOAA MADIS (Meteorological Assimilation and Data Ingest System) project and the Federal Highway Administration (FHWA) Road Weather Management Program's Clarus Initiative are working to establish mechanisms to support improved quality checking of weather and road weather data. Where members of the road weather service provider community do not have a quality assurance program in place, it will be important that such programs be implemented to provide confidence that the products and services they provide are meeting expected industry levels of performance. Further, the availability of quality check flags to transportation agencies maintaining their own road weather observation systems will require that these agencies incorporate methods to apply these quality check flags to their calibration and maintenance programs supporting their road weather observation systems.
How well these activities are adopted and implemented will largely determine the change that will occur in the quality characteristics of road weather information. The ongoing monitoring of road weather information quality will provide a road weather community "report card" on the state of the quality of road weather information and where improvements can yet be made. Performing ongoing quality monitoring of road weather information will not be a simple process and will require a commitment within the community and leadership by the federal government.
Various issues will need to be addressed to determine the most appropriate strategy for implementing an ongoing quality monitoring process. First, given the level of work required to complete the analysis and the need to appropriately identify real change that is taking place, it will be important to establish an appropriate time interval required to compare the present baseline characteristics of road weather information to future quality states. Next, it will be important to establish appropriate protocols to follow such that the methodologies are repeatable and provide real comparisons that are not diluted or distorted by changing technologies. Finally, it is necessary to understand the risks and caveats associated with performing such monitoring and setting appropriate expectations for monitoring the change in road weather information quality character. Each of these issues is discussed further in the following sections.
Performance Analysis Time Interval Requirements
The perception of road weather quality is dependent upon technological advances that:
- Modify/enhance the measurement of the raw road weather elements;
- Create new road weather measurement or display tools;
- Improve the methods employed to transfer the data from source to the end user; or,
- Create unique solutions to present road weather data to the end user.
The improvement in the quality of road weather information over the past century has generally been derived from both gradual technological advances and rapid transitions in one or more of the technological support mechanisms. Gradual changes may be attributed to the ongoing improvements in instrumentation and the continual steady improvement in weather and road weather forecast accuracy. However, road weather has also benefited from the introduction of significant changes in the road weather information support structure. Some examples include the advent of numerical weather prediction in the 1950s, weather radar imagery following World War II, the development of Road Weather Information Systems (RWIS) (especially with the introduction of pavement temperature) in the mid-70s, the explosion of personal computing and cellular communications in the 1990s, and Advanced Traveler Information Systems (511) around 2000. The influence of each of these significant infrastructure modifications occurred over a period of years and the transition from introduction through growth to maturation went through a characteristic sigmoid curve integration into our societal infrastructure similar to the common model of business development. Government programs (such as the expansion of the weather radar network) took place relatively quickly whereas systems that were integrated through a procurement process extended over a longer period of time. The RWIS program within state DOTs, for example, started its growth cycle in the early 1980s and moved into its maturity phase around 2000. Thus, the user's perception of road weather information is influenced by a broad spectrum of factors and the rate at which each influence modifies the assessment of quality tends to vary over time.
The road weather community has been in one of these significant technological growth periods during the past decade and a half (Figure 3). Much of this growth is attributable to a greater level of detail in road weather information products resulting from improved collection of weather and road weather data. The growth also came as a result of greater awareness within the surface transportation community of the benefits of road weather information to support road weather management strategies. However, the growth is not uniform across the nation nor is it linear in time. Rather, the advances have occurred in a somewhat stepwise progression with the benefits realized from these advances diffusing to DOTs and the traveling public in a similar stepwise manner. Thus, the specification of appropriate timing to capture quality variability in road weather information must be carefully considered. An interval that is too short could potentially show little to no growth from one characterization period to the next. This could lead to a perception of insufficient progress and have negative consequences on enthusiasm for continued development of new advancements in road weather information. An interval that is too great between performance analyses, while ensuring that the piecewise growth would be captured in the characterization relative to the baseline, could fail to demonstrate to DOT and federal funding sources that adequate progress is being made.
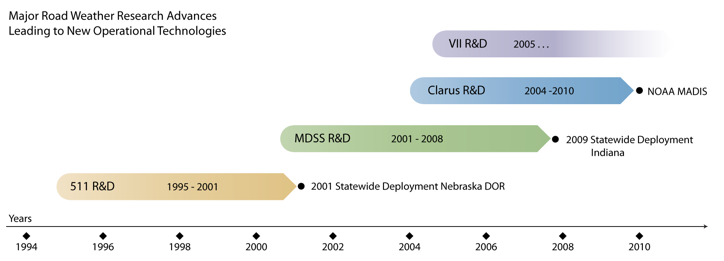
Figure 3. Growth of road weather technology over time
Using the frequency of major technological road weather initiatives as one measure for the frequency of advancement (Figure 3); these initiatives typically extend for a period of time ranging from two to six years with an average completion of a new initiative approximately every four years. With an added assumption that at the end of these initiatives the technology will be assimilated into operational decision-making and procedures in the road weather community, an appropriate performance analysis time interval based upon these initiatives would be between every two to six years.
Improvements in road weather information are also largely dependent upon the improvements within the road weather service provider community. These improvements are induced from various factors including, but not limited to, market competitiveness resulting in quality improvement in road weather products, more stringent quality requirements within DOT contract language with road weather service providers, and improved technology utilization by the road weather service providers and the DOTs in applying quality monitoring to raw and derived road weather information. While the latter may be strongly influenced by the aforementioned research and development road weather initiatives, they may also come from local DOT operational and private sector initiatives. The time scale for these benefits are likely realized at the time scale of the procurement of road weather services from one to three years.
The final factor to be considered in establishing a time interval for conducting performance analyses is associated with the human factor aspect of road weather information utilization. Although no definitive study has been conducted to date to document the growth in knowledge and user sophistication regarding road weather information utilization, the dramatic upswing in road weather emphasis at both the federal and state level has no doubt resulted in a greater awareness of road weather management within the road weather user community. This has resulted in a non-linear increase in sophistication of the user base, particularly within winter maintenance. Thus, this represents an opportunity for a more frequent characterization of road weather performance on approximately an annual schedule due to the growth in user recognition of quality attributes within road weather information and a proactive emphasis to support improved quality within the road weather information.
Figure 4 provides a synthesis of the aforementioned features associated with the uptake of technology and the growth of road weather information utilization where the vertical structure depicts the variability in the timing associated with each feature. As shown in this figure, a reasonable period for performing a re-characterization of road information quality is approximately once every two years (denoted as the red dashed line in Figure 4). This is not significantly different from present efforts to capture the utilization of intelligent transportation system (ITS) technologies, presently being done every other year as part of the ITS Deployment Statistics assessment.
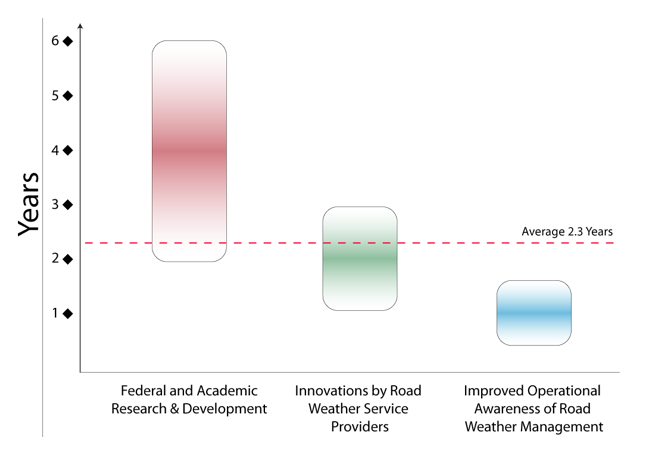
Figure 4. Frequency of road weather technology initiatives and growth showing also the recommended frequency for re-characterization of road weather information quality
Method for Ongoing Road Weather Information Quality Characterization
Measuring future variations in the quality characteristics of road weather information will require establishing evaluation methods that are acceptable to the road weather stakeholder community. This will involve the commitment and participation by transportation agencies and the awareness and support by the road weather service providers. Acceptable methods will share various fundamental protocol and data gathering requirements:
- Protocols that are open and documented;
- Protocols that are repeatable;
- Protocols that provide objective statistical measures;
- Data that are representative of the current road weather state of the practice;
- Data that have minimal human bias; and,
- Data that are appropriate to a long-term longitudinal study of quality characteristics.
Open protocols provide for scrutiny of the methods by the entire community and do not restrict their accessibility as a result of proprietary licenses or regulations. This openness is crucial to provide fairness in the quality characterization process and permits an opportunity for all stakeholders of the quality monitoring process to understand and comment on the methods being used. The protocols should be documented and discussed in a public forum that encourages feedback on the processes being used. The publishing of the protocol provides a formal means of enhancing the likelihood that the protocol will be applied in a similar manner in the future. This repeatability of the measurement process is central to the meaningfulness of the monitoring results by providing comparative process that relates similar aspects at different times in a consistent and equal manner. Finally, an open and repeatable protocol must also have an unbiased method of managing and reducing the study data such that it provides a measure of change in the quality characterization. The use of statistical measures provides an effective means of aggregating similar data for comparison with previous and future data. Optimally, the protocol would be applied to a sufficiently large sample size to permit robust statistical significance testing. However, the limited size of the road weather community likely precludes anything but the use of bulk statistics for the foreseeable future.
The single most likely challenging issue in implementing a method for ongoing characterization of road weather information is ensuring that human factors are a minimal factor in the assessment of quality. Methods to perform a totally objective measure of quality would require either a significant limitation to the types of road weather elements and product types in the ongoing monitoring or they would present tremendous institutional issues in implementing the methods across a sufficient number of transportation agencies to provide meaningful measures. Thus, the method to perform ongoing monitoring of road weather information will inherently require the participation of a transportation agency individual knowledgeable of that agency's road weather information quality attributes. The presence of an individual within the ongoing monitoring program injects a further requirement that the method associated with a measurement not be too cumbersome to apply. Results and feedback from the current baseline activities indicate that responsiveness to questions on road weather information quality is a function of the amount of time required to respond and the detail involved in providing the quality attribute data.
The resulting recommendation of a method to perform ongoing monitoring of the quality characteristics of road weather information is the use of a well-defined questionnaire. The method explicitly used to characterize a baseline of road weather information quality proved fundamentally sound but some adjustments may be warranted.
Using lessons learned from the present study, it is recommended that the existing method, with appropriate modifications, become a formalized FHWA data collection procedure. This should become similar in design and application to the USDOT Research and Innovative Technology Administration's (RITA) ITS Deployment Statistics database currently in place. A surface transportation weather section already exists within the ITS Deployment Statistics database; however, none of the present questions in the surface transportation weather survey deals explicitly with the quality of the road weather information in use by the transportation agency. The presence of a long-lived relational database should be established from the resulting road weather information quality surveys.
The present baseline information should serve as the foundation for the database. Subsequent entries into the database at a frequency of every two years will permit the desired longitudinal development of a road weather information quality attribute database for use in defining change vectors either individually by road weather element and/or product type or in an aggregation across all road information types. This database should be openly accessible to the road weather community for use in local quality monitoring evaluations and to support research studies into the promulgation of quality awareness within the community. The initial implementation should initially contain all or part of the road weather elements and product types used in the present baseline activities (Table 12 and Table 13) with the possibility of further expansion of the database as required in time.
Table 12. Road weather elements recommended for future longitudinal quality attribute monitoring
| ROAD WEATHER ELEMENT |
|---|
| WEATHER CONDITIONS |
| Air temperature |
| Relative humidity |
| Dew point temperature |
| Wind direction |
| Wind speed |
| Wind gust |
| Visibility |
| Type of weather |
| Precipitation type |
| Rain rate |
| Snow rate |
| Cloud cover |
| Precipitation start time |
| Precipitation end time |
| Probability of precipitation |
| Probability of precipitation by types |
| Rain accumulation or liquid equivalent |
| Snow accumulation |
| Maximum air temperature |
| Minimum air temperature |
| PAVEMENT CONDITIONS |
| Pavement temperature |
| Pavement condition |
| Chemical concentration |
| Freeze point temperature |
| Road conditions |
| Probability of road or deck frost |
| Treatment recommendation |
| HYDROLOGY |
| River stage |
| Flood stage |
| Flow rate |
| Flood potential |
| ADVISORY MESSAGES |
| Flood watches and warnings |
| Winter advisories/watches/warnings |
| Wind advisories/watches/warnings |
| Severe thunderstorm watches/warnings |
| Dense fog advisories |
| Road closures |
| TRAFFIC |
| View of the road |
| View of the traffic |
| View of the weather |
Table 13. Road weather product types recommended for future longitudinal quality attribute monitoring
| ROAD WEATHER PRODUCT TYPE |
|---|
| WEATHER |
| Weather summary |
| Weather history |
| Local/regional forecast |
| Zone forecast |
| Watches and warnings |
| ROAD WEATHER |
| Current conditions |
| History listing |
| Regional map of road weather conditions |
| Pavement forecast |
| MDSS |
| Route specific forecast |
| Road condition report |
| Road weather alert |
| Camera images |
| HYDROLOGY |
| Flood warning |
Increased Operational Activities Incumbent to Ongoing Monitoring
In using road weather information, including the generation of derived road weather information products, assumptions are often made regarding the existence of reasonable quality in the observed weather and road weather data and the resulting quality of road weather derived products using these observed data. The fallacy of assuming data to be meeting an acceptable quality level is that too often it results in frustration within the road weather information user community when less than ideal information is subsequently available to support road weather management decision-making. Often these assumptions include the following:
- Site-specific data are representative of an area extending beyond the location of its observation or predicted location;
- ESS sensors are operating within manufacturer's specifications;
- ESS sensors are routinely and properly maintained;
- ESS data are a significant portion of the data used to generate derived and/or forecast products;
- Road weather data users assign quality in an objective manner based upon operational experiences by the user; and,
- The more experience users have using road weather information in applications, the more reliable will be the characterization of quality and value of road weather.
An important effort with potential to improve the overall assessment of the quality of road weather information is the rigorous use of quality check flags and a more robust quality assurance program that provides conditional integration of the existing individual quality check tests. A thorough quality assurance program will more accurately discriminate between anomalous road weather conditions induced by unusual conditions and those caused by sub-standard sensor performance. Quality assurance programs will also benefit from an active "blacklist" program that temporarily eliminates known defective sensors from their use in operational activities.
An active metadata program is also necessary to assure the appropriate use of field data for different objectives. Data from ESS sites chosen to provide guidance on specific maintenance problem areas must be available to support maintenance operations; however, these data may not be representative of conditions in the general area and may need to be suppressed or treated in special ways to eliminate or minimize its influence on the quality assurance and use in regional displays and weather forecasting programs. Ongoing updates to the metadata files are essential to address ESS sites that met meteorological standards at the time of installation but are subsequently affected by surrounding vegetation or impacted by new structures in the area.
The metadata files must also reflect sites where the instrumentation does not meet WMO siting guidelines. Situations exist wherein sensors are not installed at the specified WMO heights or at proper distances away from obstructions. A concerted program needs to be developed to assist procuring agencies to understand the importance of site selection and the impact of properly siting RWIS instrumentation. This includes the continued encouragement for DOTs to review and utilize the FHWA Road Weather Management Program ESS siting guidelines developed to address the special situation associated with ESS while emphasizing the importance of the WMO guidelines.
Sensor technology continues to change and new observation techniques are introduced routinely. Replacement of instrumentation at an ESS site has the potential to significantly modify the performance of certain measurements and change the value of given data elements at those sites. It would be advantageous for agencies owning ESS equipment or contemplating the expansion of their networks to have access to an information clearinghouse on the advantages/benefits that would accrue from the introduction of new technology. As new sensors are integrated, the metadata needs to reflect such changes and a mechanism needs to be in place to apprise weather service providers of the changes.
The instrumentation that measures and transfers field information is an essential tool in the generation of raw road weather information and secondary types of information. As with any other tool used by DOT personnel it is imperative to keep this tool working properly. Those responsible to assure the proper performance of their ESS tool need to understand the importance of the resource and what has to be done to keep the instruments working within specifications and assuring that the support metadata are routinely updated. Effective management of the RWIS resource for the benefit of all stakeholders will require a solid training program and a community-wide commitment to an effective resource management program.
Strategies for Implementation of a Monitoring Process
The implementation of an ongoing monitoring process should be led by an appropriate federal agency with strong relationships with transportation agencies nationwide. The recommended agency for this oversight of the ongoing quality monitoring process should the FHWA Road Weather Management Program. While the RITA ITS Deployment Statistics database already has an organized process to collect information associated with surface transportation weather, this effort is primarily associated with Intelligent Transportation Systems activities. Although it could be argued that road weather information quality monitoring could be considered an aspect of ITS, situations would likely occur where this could become an institutional barrier that would limit the participation by some transportation agencies.
Therefore, it is recommended that the FHWA Road Weather Management Program, in addition to oversight for the monitoring process, also assume the responsibility for establishing a road weather information quality attribute database and to implement an electronic questionnaire process to acquire current quality attributes of road weather information every two years. The initial data within the database should be comprised of those data collected as part of the present baseline study where the quality attributes contained in the database are based on the same quality attributes contained in the present baseline study. After review and revision of the questionnaires previously used, a set of questionnaires should be developed for utilization during the first occurrence of database update to occur during the federal fiscal year 2010. Subsequent questionnaires and database updates should occur every two years for a period of no less than ten years.
The protocol used in the implementation of the monitoring process should be presented for open discussion at appropriate road weather stakeholder community meetings. Examples of these meetings would be the annual Clarus ICC meeting, the meeting of the ITS and Surface Transportation Weather Committee meeting at the annual American Meteorological Society meeting, the annual ITS America (ITSA) meeting of the ITSA Weather Special Interest Group, and at the annual Transportation Research Board Surface Transportation Weather Committee meeting. Further, a state of the quality of road weather information findings summary report should be prepared and distributed at the aforementioned meetings as well as through an electronic distribution to the road weather community as a whole.
Anticipated Outcomes from Ongoing Monitoring
Heightened awareness and greater responsiveness to road weather information quality issues affords the road weather community the opportunity to expand the effective use of road weather support for advisory, control, and treatment management strategies. Establishing a proactive program to stimulate a heightened awareness of where quality issues exist will create an atmosphere of collaboration to improve the state of the quality between users and providers of road weather information. Recognition and acknowledgement of the current state of the quality of road weather information (Figures 5 and 6) should be a catalyst to achieve better quality levels. The vertical bars in Figures 5 and 6 represent the quality attributes used to assess the characterization of the Road Weather Elements and Product Type state of quality. Although the present quality levels are considered within the road weather community to be towards the high end of the quality value scale (the red dashed "mean" line in Figures 5 and 6), there exists considerable room for improvement. This is particularly true for the quality assessments in the Control and Treatment road weather management areas.
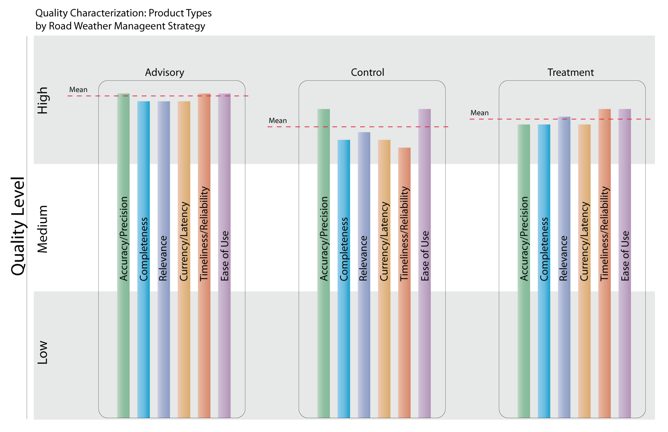
Figure 5. State of the Practice – Quality Characterization of Road Weather Product Types for each Road Weather Management Strategy.
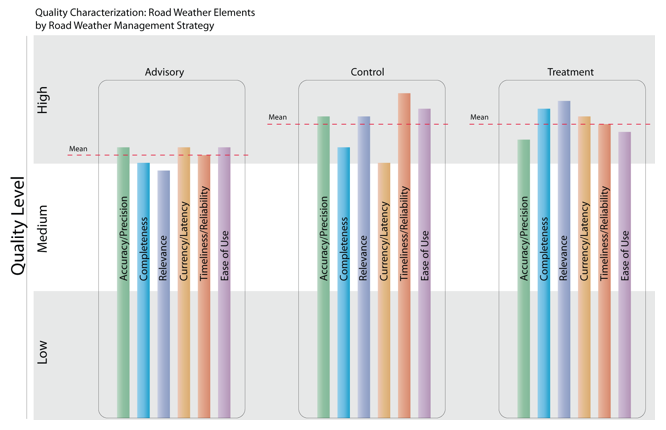
Figure 6. State of the Practice – Quality Characterization of Road Weather Elements for each Road Weather Management Strategy.
The development of the Clarus System has as one of its central objectives the improvement of environmental sensor station (ESS) data quality monitoring. Monitoring of data quality and element quality attributes are two themes in the successful application of a road weather information quality improvement process.
The Clarus data quality checking flags provide valuable information for ESS system managers to monitor the health and use of their sensors while also providing important quality flags to road weather service providers for appropriate incorporation of the ESS data in their provision of road weather elements and products. A similar quality checking capability is provided with the NOAA MADIS data provision.
A forward looking premise is that changes in quality will result in improved data quality and measurable variation, and over time element and product attributes of road weather information utilization will improve. The following are anticipated outcomes of the ongoing monitoring of quality characteristics.
Improved Road Weather Observations:
The process of using road weather information begins with the collection and processing of the observed road weather data. These data are crucial to the monitoring of current roadway environment conditions and serve as an important part of the preparation of predictions of the future conditions of the pavement and the weather conditions along the roadway. Ongoing monitoring of the quality will provide an important indicator of the reliability of these data for use in supporting agency and service provider activities leading to a greater awareness of sensor issues at the critical point of the observation.
Improved Traveler Advisory Content with Road Weather Information:
Road weather information provided to travelers has long been limited due to concerns of the quality of the information and the risks of providing untimely and less than accurate information. Ongoing monitoring will provide an important measure of the reliability and accuracy of road weather information. Where the quality meets sufficient levels to permit greater use in traveler advisory content, the result will be a broader level of traveler information system content on the road weather conditions present and expected along a travel corridor.
Improved Winter Maintenance Tactical Response to Snow and Ice Conditions:
Confidence in ESS data is currently less than desirable due to a lack of information on the quality of the data. Snow and ice control operations depend upon having timely and accurate knowledge from the ESS and ESS-derived road weather information of the present and future pavement conditions. Ongoing monitoring of quality characteristics of road weather information will promote a strengthening of the road weather information content (i.e., both the observed and predicted road weather conditions) and permit the evolution of new winter maintenance tools.
Improved Responsiveness by Traffic Managers on Placing Weather-Related Traffic Controls:
Much of the road weather information utilized today within traffic management centers and traffic operations centers support reactive responses to changing road weather conditions. Through ongoing monitoring of the quality of road weather information, it will be possible to develop a level of trust in the ease of use and reliability of road weather information. This increased trust will promote greater use of road weather information sources to provide planning decisions given the current and near-term future conditions of the road and the resulting impacts to traffic flows.
Higher Quality Road Weather Products Provided by the Road Weather Service Provider Community:
The highest level of knowledge regarding the quality of road weather information exists largely within the road weather service provider community. Existing monitoring practices and the presence of new capabilities afforded by Clarus and MADIS will provide for better understanding of limitations within the road weather data sources that are used by the road weather provider community. Further, knowing that the quality attributes of the road weather products of the road weather service provider community are being regularly monitored will provide a stimulus to effect improvements in their product and service provisions. As monitoring of ESS data quality provide transportation agency's insight into quality issues of their ESS data, this will result in an improved source of input data to road weather service providers and assist in the improvement of the products and services they provide back to these agencies.
Greater Confidence by Transportation Personnel in Road Weather Products and Services:
Transportation personnel expect high quality road weather information to support their decision-making activities. When the quality of the road weather information fluctuates, it diminishes their ability to make appropriate decision and reduces their confidence in the road weather information sources. Ongoing monitoring of quality attributes of road weather data permits transportation agencies to understand the present limitations of the information capabilities, while seeking ways to improve the quality. The awareness of the quality will allow transportation personnel to set appropriate expectations and, with indications of improved quality through the monitoring process, to adjust their expectations accordingly.
Incentives for Improvement of Instrumentation or Processing to Address Elements Perceived as Low Quality Resources:
All members of the road weather stakeholder community have expectations about the performance level of sensors or post processing techniques employed to provide resource information to address the stakeholders' needs. When road weather information resources perform below their levels of expectation, providers who can profit from resolving the deficiency are motivated to look for innovative solutions. This often requires viewing the measurement or data processing technique from a different perspective and being willing to invest resources to facilitate a new solution. A demonstrated quality deficiency and the associated opportunity to profitably gain from resolving the less than desirable state offers the incentive to those vendors who can design and market a more effective resource.
Continuing System Improvement for Road Weather Information Products:
Fundamentally, the evaluated quality attributes (Accuracy/Precision, Completeness, Relevance, Currency/Latency, Timeliness/Reliability, and Ease of Use) relate to customer satisfaction with a product. Surveying and interpreting the level of quality for each of these attributes form a true baseline for which improvement of the customer's (DOT personnel) perspective based on product or data quality changes, familiarity, skill improvement, or interest can be charted over time. It is anticipated that the key items where quality improvement would make the greatest difference will experience a decline in attribute values as familiarity and skill of using road weather information increase. Changes in these will highlight opportunities for improvement of the products and the development of trust in the data.
The assessment of these parameters serves the desired objective of establishing an overall performance level of the road weather information and yielding information that should lead to targeted improvement methods.
Initial tasks in this study focused on establishing a current baseline of road weather information through a characterization of the sources of information, and an assessment of quality attributes associated with road weather information used by state departments of transportation (DOT). The assessment was determined through feedback provided by DOT personnel actively engaged in advisory, control, and treatment management strategies. The results of this study serve as a baseline for future comparisons of enhanced road weather information enabled by the Clarus system and other advanced road weather management technologies.
In the design of the characterization process, an objective was to provide clear and useful measures of quality for existing road weather information sources in a method that is efficient, economical, and effective for continued use. This baseline provides the metric to capture future changes in user perceived quality of road weather information. The study also provides a catalog and characterization of the pre-Clarus road weather information quality "state of practice."
This report presents a recommendation for a future pathway toward the application of the aforementioned baseline characteristics and recommends strategies for the implementation of monitoring longitudinal change. A key aspect considered in this study has been to determine how change in the user's perception of road weather information may be reflected through the valuation of the intrinsic characteristics of road weather information. Future applications of road weather information performance measures will need to be accomplished in a manner that provides a clear understanding of the state of practice and best practices. Since users may view a specific road weather element from different perspectives related to their subsequent use of the information, several individual quality metrics will need to be utilized in order to assess the overall quality of the various forms of road weather information. Fundamental to this is defining what constitutes an improvement in quality over time. Parameters for each of the quality measures must be such that their change is measurable and the introduction of Clarus or other advances in technology do not alter their character or require new metrics. This report provides recommendations for tracking and comparing changes in available road weather information occurring as a result of Clarus or other technological advancements.
Stakeholder Review
Eighty-six (86) individuals in the state departments of transportation (DOT) were asked on March 3, 2009 to review the Baselining Road Weather Information Summary Report (hereafter noted as Summary) of research done on the Baselining Current Weather Information project. These individuals were DOT employees who have been involved in road weather activities within their respective states and are considered the key resources relating to road weather as it affects advisory, control, and treatment strategies in daily operations.
Eleven (11) recipients of the request-to-participate in the evaluation of the Summary provided input to a short online survey designed to capture respondent feedback. The results, discussion, and comments are presented in Appendix F. Question 12 in this survey requested users to select in which management strategy areas the respondents were most involved. The expectation had been that the respondents would select one of the three, or at least allocate their efforts primarily to one and partially to the others. The responses seemed to indicate, rather, the respondent's allocation of time to the different areas, and may indicate they do not spend all of their time on functions dedicated to the three strategies. The total number of responses in each of the three strategy categories was essentially equal; however, the predominant response of "Most Involvement" from the Advisory strategy suggests the survey has an advisory strategy bias. Two interesting points result from this question. First, the answers tend to indicate respondents to this post-report survey see themselves as participants in multiple strategies rather than explicitly classified within one area. The respondents came from the same sample set used in the original quality attribute survey that forced respondents to classify themselves into one of the three strategies. More evaluation is needed to determine whether the separation of responses into strict strategy categories creates a viable statistical partition. Second, the advisory bias of this review survey does not match with the dominant response from individuals in the treatment strategy in the quality attribute survey.
In general, the survey indicate that the results presented in the Summary Report were well received by the reviewers, and that the findings in the Baseline Study provide a baseline assessment reflecting the perception of the stakeholders and practitioners. However, the survey also provided the perspective of at least one individual who did not see the value of the baseline assessment and the presentation of the results.
APPENDICES
APPENDIX A: Scan results - weather service providers road weather service providers.
Tabulation of weather service providers and road weather service providers
| Company | Location |
Road Weather Provider (Y/N) |
Services |
|---|---|---|---|
| 3SI | Marlton, NJ | N | Weather support system, aviation support system |
| Aanderaa Instruments | Attleboro, MA | N | Weather and RWIS equipment |
| About.com Weather | NY Times Company | N | Weather education |
| Accuweather | State College, PA | Y | Commercial forecasting to large community base; high resolution forecasting of weather and precipitation propagation |
| Advanced Designs Corporation | Bloomington, IN | N | Doppler radar equipment and services |
| Advanced Forecasting Corporation | Wilmington, DE and Miami, FL | Y | Risk management services where weather is one component along with terror, bio, geological, network, etc.; risk for transportation services is one component |
| Aerocomp Inc. | Santa Ana, CA | N | Environmental assessments; Siting and installation of met equipment; hydrology services; climatology for transmission lines |
| Aerology | N | Weather map forecasts | |
| Aerospace & Marine International | San Jose, CA | N | Weather routing sea; Offshore weather; Tropical weather & storms; SST & ice conditions |
| Agricultural Weather Information Information Service (AWIS), Inc. | Auburn, AL | N | Ag & energy wx |
| Air Science Consultants, Inc. | Bridgeville, PA | N | Ag, aviation, media, construction, forensics, trucking, recreation weather support services |
| Air Weather & Sea Conditions Inc. | Pacific Palisades, CA | N | Consulting and forensics; CCM |
| Alert Weather Serivces, Inc. | Lafayette, LA | N | Marine weather service solely |
| Allivan Marketing | Tyngsboro, MA | N | Barometers |
| AmbientWeather | Tempe, AZ | N | Amateur weather station equipment |
| America's Weather | N | Repackage of NWS weather information | |
| AnythingWeather.com | Palm Desert, CA | N | Amateur weather station equipment |
| Applied Modeling, Inc. | Henderson, NV | N | Air quality assessment consulting |
| Applied Weather Technology | Sunnyvale, CA | N | Marine forecasting |
| ASAI/Weather 2000 | New York, NY | N | Weather derivatives |
| Associated Science Experts | Green Valley, CA | N | Forensics |
| AtmosForecast | Portland, ME | N | Forensics, general wx forecasting |
| Atmospheric and Enviromental Research Inc | Lexington, MA and other US locations | N | Provide meteorological suite of svcs; primary emphasis is consulting about impact of wx on various industries |
| Atmospheric Information Services | Delmar, NY | N | Forensics, consulting |
| AWS Convergence Technologies (WeatherBug) | Germantown, MD | N | School net wx equipment, forecasting |
| Aviation Weather, Inc. | New York, NY? | N | Aviation weather |
| Avtec Systems, Inc. | Chantilly, VA | N | Satellite receivers and support eqpt |
| Baron Services | Hunstville, AL | Y | Weather information & data display systems; wx info content distributor for satellite radio |
| Big Country Weather | Abilene, TX | N | Web interface to Abilene, Tx area weather & general wx condtions |
| Biral | Portishead, Bristol, UK | N | Weather, partical detection, & biodetection instruments |
| Boschung America | New Castle, PA | Y | Weather and pavement monitoring eqpt, weather and pavement forecasting, MDSS |
| Bruce F. Watson | White Bear Lake, MN | N | Consulting meteorologists, forensics, and general wx info provider in upper Midwest |
| Burk Weather Center | Burkburnett, TX | N | Packages NWS wx info content for west central OK |
| Cable News Network (CNN) | Atlanta, GA | N | Wx info dissemination; uses content provided by AccuWeather |
| California Weather & Earth Sciences, Inc. | Phelan, CA | N | Consulting; Forensics; Some operational info; associated with American Weather & Earth Sciences, Inc. |
| Campbell Scientific, Inc. | Logan, UT | N | Data logger manufacturer & weather equipment integrator |
| Cape Ann Mass.com | Cape Ann, MA | N | Community integration of wx info from NWS and local sources to support local wx info needs |
| Clear Weather Solutions | Thompson's Station, TN | N | Information unavailable via website query |
| Clearwest | Wenatchee, WA | N | Ag wx forecasts primarily for Washington growers |
| Climadata Corporation | Miami, FL | N | Media, film, forensics |
| Climate Logic | Superior, CO | N | Seasonal to inter-annual climate forecasts |
| Climate-Charts.com | Joe Casey, individual web page | N | Climate maps of the world; not a business |
| Climatological Consulting Corporation | Palm Beach Gardens, FL | N | Forensics and applied climatology |
| Climatronics Corporation | Bohemia, NY | N | Weather and environmental monitoring eqpt |
| Climet Systems | Newmarket, Ontario | N | Forensic and applied climatology |
| Coastal Environmental Systems | Seattle, WA | N | Manufactures professional weather instrumentation |
| Columbia Weather Systems, Inc. | Hillsboro, OR | N | Manufactures weather instrumentation for industrial applications |
| Commanders' Weather Corporation | Nashua, NH | N | Marine forecasting for yacht racing |
| Comptus,Inc. | New Boston, NH | N | Weather and environmental monitoring eqpt |
| Compu-Weather, Inc. | Hopewell Junction, NY | N | Forensic consulting, historical analyses, and forecasting |
| Connecticut Weather Center, Inc. | Danbury, CT | N | Weather information & forecasts for Connecticut |
| Consumer Lightning Products, Inc. | Asheville, NC | N | Lightning retardant cable |
| Continental Weather Corporation | Lutz, FL | N | Fcsts for media, agriculture, marine, aviation; forensics |
| Convective Development | Blaine, MN | N | Software packages to support ind interested in weather; wx alerts, hurricane tracking |
| Cox Weather Services | N | Wx info portal to a variety of wx info resources | |
| Crown Weather Services | N | Wx info portal to a variety of wx info resources covering northern Maine and New England | |
| Custom Weather | San Francisco, CA | N | Meteorological information packaged for a variety of industries |
| Davis Instruments | Hayward, CA | N | Manufactures weather instrumentation for general use |
| DayWeather Inc. | Cheyenne, WY | N | Media forecasting, general forecasting for WY and vicinity, forensics |
| DBS Weather Impact Corporation | Delray Beach, FL | N | Climate impact assessments, forensics |
| Demico Inc. | Atlanta, GA | N | Wind sensors and signal transducers |
| Digital RF Technology, Inc. | Corsicana, TX | N | Radar (WSR doppler image) enhancement program for broadcast |
| Disaster Warning Network, Inc. | Oceanside, CA | N | Disaster collection and dissemination for wx and other natural or biological events |
| doityourselfWEATHER | N | Portal to weather, astronomical, and related info from NWS and other weather service providers | |
| E-Alert USA | N | Link to weather alerts for mobile devices | |
| Early Alert, Inc. | Tampa, FL | N | Alerts to potential disasters and NWS watches and warnings |
| East Coast Weather | Scituate, MA | N | Portal to weather information primarily from NOAA and EC sources |
| East End Weather | Long Island, NY | N | Portal for coastal erosion project; contains weather info from NWS and private vendor |
| Ed Roy, Ltd | Lafayette, LA | N | Forensic meteorologist |
| EJS Weather | Newton, IL | N | Forecasting for a variety of weather sensitive industries both domestically and worldwide |
| ENSCO, Inc. | Springfield, VA | N | Weather support systems for meteorologists |
| Enterprise Electronics Corporation | Enterprise, AL | N | Manufacturer of radar systems |
| EnviroTech Sensors, Inc. | Columbia, MD | N | Manufacturer of visibility and fog assessment systems |
| Expert Weather Investigations (EWI) | New York, NY | N | Forensics, consulting |
| F5WeatherAlert.com | N | Portal for passthrough of NWS products | |
| FleetWeather, Inc. | Hopewell Junction, NY | N | Marine weather |
| Foreca | Helsinki, Finland | N | Weather information for media and websites; forecasting for broad community of industrial users in Europe |
| Forensic Meteorology Associates Inc. | Fort Collins, CO | N | Walt Lyons; consulting and forensics |
| Forensic Meteorology Associates, Inc. | Fort Collins, CO | N | Forensics |
| Forensic Weather Consultants | Albany, NY | N | Forensics |
| Fox Weather, LLC | Fortuna, CA | N | Ag weather services |
| Franklin Time and Weather | Franklin, MA | N | Manufacturer of weather instruments |
| Freese-Notis Weather | Des Moines, IA | N | Weather support svcs for ag, energy, construction, media plus forecsics |
| Geonor, Inc. | Milford, PA | N | Manufacturer of precipitation gauges |
| Global Weather Dynamics, Inc. | Monterey, CA | N | Aviation weather message switching |
| Golden Gate Weather Services | Saratoga, CA | N | Climatological consulting; Special event forecasts; forensics; Training |
| Great Lakes Weather Service | Stetsonville, WI | N | General forecasting for various industries in upper Midwest |
| Guaranteed Weather | Overland Park, KS | N | Risk assessment of wx on ag and precipitation related situations |
| Hawaii Weather Today | Kahului, Hawaii | N | Portal to Hawaiian weather information |
| Hometown Forecast Services | Nashua, NH | Y | Media forecasting, commercial forecasting, forecasts for winter maintenance operations in New England |
| HOTWEATHER | South Bay Area, CA | N | Portal to weather sites provided by NOAA and DOD |
| How the Weather Works | Naples, FL | N | Weather education services |
| Hurricane Consulting, Inc. | Friendswood, TX | N | Portal to hurricane info, hurricane consulting and advisories |
| Hurricanecity | Delray Beach, FL | N | Portal to hurricane info, hurricane consulting and advisories |
| Hurricaneville | N | Portal to hurricane info | |
| I*ON Weather, Inc. | Morristown, NJ | N | Media, storm alerts, and forensics |
| Intellicast | N | Weather support services to broad set of industries | |
| IntelliWeather, subsidiary of ItWorks | Chico, CA | N | Broadcast weather support systems |
| InterMet Systems | Grand Rapids, MI | N | Rawindsonde collection systems |
| IPS MeteoStar | Aurora, CO | N | Weather support system for meteorologists |
| Jeppesen | Englewood, CO | N | Aviation |
| Jersey Weather Service | New Jersey | N | Portal to forecasts for agriculture, marine, and general content. |
| Katy Weather | Katy, Tx | N | Portal to conditions around Katy TX |
| Locus Weather | Camden, ME | N | General forecasting for various industries with emphasis on Northeast |
| Marta Systems | Santa Paula, CA | N | Weather support system for meteorologists |
| MDA Federal Inc. (EarthSat) | Rockville, MD | N | Agriculture, energy, and historical weather services |
| Meridian Environmental Technology Inc. | Grand Forks, ND | Y | Surface transportation weather services and 5-1-1 systems |
| Met One Instruments Inc. | Grants Pass, OR | N | Manufacturer of weather instruments |
| MeteoGroup | London, UK | Y | General forecasting for various industries in western Europe; surface transportation weather services are one component |
| Meteorlogix | Minneapolis, MN and Omaha, NE | Y | Commercial wx svcs including transportation; consulting; RoadCast maintenance decision support |
| Meteorological Solutions Inc. | Salt Lake City, UT | N | Air quality and general weather forecasts for construction, recreation, special events |
| Metro Weather, Inc. | Valley Stream, NY | N | Media, film, general forecasts, forensics |
| Mission Instruments | Tucson, AZ | N | Lightning detection equipment |
| Mobile Weather Team, Inc. | Washington, IL | N | Lightning detection equipment |
| Morcom International, Inc. | Chantilly, VA | N | Satellite receivers and support eqpt and weather services |
| Mountain States Weather Services | Fort Collins, CO | N | Portal to NWS and other private sector weather services and forensics |
| MountainWeather | Jackson, WY | N | Portal to Jackson weather information |
| Murray & Trettel, Inc. | Palantine, IL | Y | Environmental monitoring integration, weather and pavement forecasting, forensics |
| My-Cast | Minnetonka, MN | N | Garmin based hand-held access to NWS data |
| New England Weather Associates | North Adams, MA | N | Personalized forecasting for a number of different industries |
| New England Weather Science | Hull, MA | N | Archived weather data and personalized forecasting |
| NewsWX | San Diego, CA | N | Portal to NWS data and presentation of customized displays of NWS data. |
| NEXRAIN Corporation | Longmont, CO | N | Rainfall analysis based upon gauge-adjusted radar estimates. |
| Northwest Weathernet | Issaquah, WA | Y | Surface transportation weather services |
| NovaLynx Corporation | Grass Valley, CA | N | Manufacturer/distributer of weather instruments |
| NY NJ PA Weather | Freehold, NJ | N | General forecast for New York and Philadelphia |
| Ocean-Pro.com | Naples, FL | N | Marine forecasting |
| Oceanweather, Inc. | Cos cob, CT | N | Marine research and forecasting |
| Pace Scientific, Inc. | Mooresville, NC | N | Data logger manufacturer & weather equipment integrator |
| Pacific Coast Forecasting | Salinas, CA | N | Personalized forecasting, consulting, forensics |
| PC Weather Products, Inc. | Marietta, GA | N | Hurricane tracking and risk analysis |
| Peet Bros. Company, Inc. | St. Cloud, Fl | N | Amateur weather station equipment |
| Planalytics, Inc. | Wayne, PA | N | Risk analysis of weather impact for energy, retail, manufacturing |
| Planetary Data, Inc. | Prague, NE | N | NOAA Port and client-based display system |
| Praxis Software | Orlando, FL | N | Software packages to monitor assets and weather impacted services |
| Premiere Products | Columbus, NE | N | Distributor for amateur weather systems |
| Qwikcast | Northern CA | N | Portal to general weather information |
| RainWise Inc. | Bar Harbor, ME | N | Manufacturer of weather instruments |
| Rapid Weather | Rapid City, SD | N | Personalized forecasts for Rapid City area, links to weather data, and consulting services |
| Remote Systems Integration | Millington, TN | N | Aviation and environmental monitoring systems (AWOS) |
| REMTECH Inc. | St. James, NY | N | Atmospheric remote sensing equipment |
| Scientific Sales, Inc. | Lawrenceville, NJ | N | Distributor for amateur weather systems |
| Scintec | Tubingen, Germany | N | Manufacturer of remote sensing, turbulence, and radiation sensors |
| Shade Tree Meteorology, LLC | Niskayuna, NY | N | Forensics and personalized forecasts |
| Skyview Weather | Castle Rock, CO | N | Forecasting for a variety of weather sensitive industries in the CO region |
| Sonalysts, Inc. | Waterford, CT | N | Weather suppport system for meteorologists |
| Sonoma Technology, Inc. | Petaluma, CA | N | Air quality and emissions monitoring |
| Speranza's Weather Service | Hendersonville, NC | N | Distributor for amateur weather systems |
| Surface Systems, Inc. (SSI) | St. Louis, MO | Y | RWIS vendor |
| Susan Genett's Real Weather | Newport, RI | N | Forecasting for special events |
| Sutron Corporation | Sterling, VA | N | Manufacturer and integrator of weather and oceanic monitoring equipment |
| Tactical Weather | Wyoming, MN | N | Forecasts for adventure events |
| Texas Electronics, Inc. | Dallas, TX | N | Manufacturer of weather instruments |
| The Disaster Center | Federal System | N | Portal to disaster information from wx and other federal sources |
| The National Weather Station, Inc. | Lodi, NJ | N | General forecasting for various industries |
| The Weather Channel | Atlanta, GA | N | Weather information for public and users in all business sectors. |
| The Weather Underground, Inc. | San Francisco, CA | N | Weather information portal |
| THOR GUARD, Inc. | Sunrise, FL | N | Lightning detection equipment |
| Travelforecast.com, Inc. | Madison, WI | N | Portal to NWS forecasts and products associated with travel requirements |
| Unisys Weather | Blue Bell, PA | N | Weather information for meteorologists |
| Universal Weather & Aviation, Inc. | Houston, TX | N | Aviation weather services |
| Vaisala | Boulder, CO | Y | Weather and pavement monitoring eqpt, automated weather and pavement temperature forecasts |
| Vieux & Associates, Inc. | Norman, OK | N | Hydrological software, flood projections, & water resource analysis. |
| Weather 2000 | New York, NY | N | Weather derivatives |
| Weather Bank Inc. | Edmond, OK | N | Commercial wx svcs including transportation; consulting; Historical wx data |
| Weather Central, Inc. | Madison, WI | N | Weather content for media |
| Weather Decision Technologies | Norman, OK and Arlington, VA | N | Modeling tools; Precipitation Tools; Lightning; Weather models; DSS in hydrology, lightning, radar; forensics, display systems; Provision of sophisticated weather support tools to other weather resource facilities |
| Weather for You | Grants Pass, OR | N | Weather information portal to NWS and other service providers |
| Weather History Research | Central Indiana | N | Weather history research for insurance and legal community |
| Weather One Corp. | Knoxville, TN | N | Weather observers |
| Weather or Not | Shawnee, KS | Y | Web site wx svcs, consulting, paging svcs |
| Weather Research Associates | Westbrook, ME | N | Meteorological hazard mitigation research |
| Weather Research Center | Houston, TX | N | Weather education |
| Weather Risk Management, LLC | Norman, OK | N | Energy, construction, insurance, recreation, retail |
| Weather Routing Inc. | Glen Falls, NY | N | Marine weather service solely |
| Weather Ventures | Boalsburg, PA | N | Probabilistic forecasting to assist risk analysis of high value ventures |
| Weather Works | Hackettstown, NJ | N | Forensics |
| WeatherData, Incorporated | Wichita, KS | N | Forecasts and warning service for a broad spectrum of users from various industry sectors. |
| WeatherExperts.com | Chantilly, VA | N | Sale of satellite weather equipment a subsidiary of Morcom, International |
| WeatherExtreme Ltd. | Zephyr Cove, NV | N | Forensics and personalized forecasts |
| Weatherguy.com | Kailua, HI | N | Worldwide marine forecasting |
| WeatherMarkets.com | Wayne, PA | N | Energy and agriculture forecast service |
| Weathernews | San Francisco, CA and Norman, OK | Y | Broad spectrum of wx svcs including maintenance; maintenance guidance advisories |
| weatherTAP | Crossville, TN | N | Weather information display mechanisms for weather info at meteorologist's level |
| Western Weather Group | Chico, CA | N | Forecasting for agriculture, industrial, and commercial interests. |
| Wilkens Weather Technologies Inc. | Houston, Texas | N | Web site graphics, hurricane animation software, customized web pages. |
| WorldWinds, Inc. | Slidell, LA | N | Weather, marine, and aviation forecasting; research & development in meteorology and oceanography |
| WSI Corporation | Andover, MA | N | Weather support tools and forecasting for media, aviation, energy, and insurance interests. |
| Wxforecast Services | Bradenton, FL | N | General weather forecasting for a broad spectrum of clients |
| WxPortal - SSESCO, Inc. | St. Paul, MN | N | Wx Portal is part of WindLogics |
| WxUSA | N | NWS general weather forecasts for cities | |
| Zephyrus Electronics, Ltd. | Tulsa, OK | N | Hardware and weather alert messaging software |
APPENDIX B: Scan Information
ATIS Telephone-Based Services
| Informer | Delivery Format | Road Content Provider | Weather Content Provider | Road Specific Content | Weather Specific Content | Comments |
|---|---|---|---|---|---|---|
| Alabama DOT | None | None | None | |||
| Alaska DOT | 511 | NWS | NWS | Pavement state | Forecast precipitation type, precipitation intensity, precipitation amount, precipitation probability, maximum air temperature, minimum air temperature, wind speed, wind direction, visibility | |
| Arizona DOT | 511 | NWS | NWS | Pavement state | Forecast precipitation type, precipitation intensity, precipitation amount, precipitation probability, maximum air temperature, minimum air temperature, wind speed, wind direction, visibility | NWS NDFD |
| Arkansas DOT | Toll-free call | DOT | None | Pavement state | None | Only when conditions warrant |
| Sacramento/Northern California DOT | 511 | DOT | None | Pavement state | None | |
| San Francisco DOT | 511 | DOT | None | None | None | |
| San Diego DOT | 511 | DOT | None | None | None | |
| Colorado DOT | Toll call | DOT | DOT | Pavement state | Forecast cloud cover, precipitation type, minimum temperature, maximum temperature | Manually recorded |
| Connecticut DOT | None | None | None | |||
| Delaware DOT | None | None | None | |||
| Florida Statewide DOT | 511 | DOT | None | None | None | A manual as conditions warrant system |
| Central Florida DOT | 511 | None | None | None | None | |
| Jacksonville DOT | 511 | None | None | None | None | |
| Southeast Florida DOT | 511 | None | None | |||
| Tampa Bay DOT | 511 | None | None | |||
| Georgia DOT | 511 | DOT | Private Sector | Pavement state | Current and forecast cloud cover, wind speed, wind direction, wind gusts, air temperature, visibility, precipitation type, and precipitation intensity | |
| Hawaii DOT | None | |||||
| Idaho DOT | Toll-free call | DOT | NWS | Pavement state | Forecast precipitation type, precipitation intensity, precipitation amount, precipitation probability, maximum air temperature, minimum air temperature, wind speed, wind direction, visibility | |
| Illinois DOT | Toll-free call | DOT | None | Pavement state | None | Interstates only |
| Indiana DOT | Toll-free call | State Patrol | None | Pavement state | None | |
| Iowa DOT | 511 | DOT | None | Pavement state | None | |
| Kansas DOT | 511 | DOT | Private Sector | Pavement state | Current and forecast cloud cover, wind speed, wind direction, wind gusts, air temperature, precipitation type, and precipitation intensity | |
| Kentucky DOT | 511 | None | None | |||
| Louisiana DOT | 511 | DOT | NWS | Pavement state | Forecast precipitation type, precipitation intensity, precipitation amount, precipitation probability, maximum air temperature, minimum air temperature, wind speed, wind direction, visibility | |
| Maine DOT | 511 | DOT | NWS | Pavement state | Forecast precipitation type, precipitation intensity, precipitation amount, precipitation probability, maximum air temperature, minimum air temperature, wind speed, wind direction, visibility | Weather not provided relative to specific roads |
| Maryland DOT | None | |||||
| Massachusetts DOT | 511 | DOT | Private Sector | Pavement state | Forecast precipitation type, precipitation amount, precipitation probability, wind speed and direction, cloud cover, air temperature | Recorded manually by private sector |
| Michigan DOT | Toll-free call | DOT | None | Pavement state | ||
| Minnesota DOT | 511 | DOT | NWS | Pavement state | Forecast precipitation type, precipitation amount, precipitation probability, wind speed and direction, cloud cover, air temperature | Not provided relative to specific roads |
| Mississippi DOT | None | |||||
| Missouri DOT (St. Louis) | 511 | None | ||||
| Montana DOT | 511 | DOT | Private Sector | Pavement state | Current and forecast cloud cover, wind speed, wind direction, wind gusts, air temperature, visibility, precipitation type, and precipitation intensity | |
| Nebraska DOR | 511 | DOT | Private Sector | Pavement state | Current and forecast cloud cover, wind speed, wind direction, wind gusts, air temperature, visibility, precipitation type, and precipitation intensity | |
| Nevada DOT | 511 | DOT | Private Sector | Pavement state | Current and forecast cloud cover, wind speed, wind direction, wind gusts, air temperature, visibility, precipitation type, and precipitation intensity | DOT road condition reports |
| New Hampshire DOT | 511 | DOT | NWS | Pavement state | Forecast precipitation type, precipitation intensity, precipitation amount, precipitation probability, maximum air temperature, minimum air temperature, wind speed, wind direction, visibility | Weather not provided relative to specific roads |
| New Jersey DOT | 511 | None | ||||
| New Mexico DOT | Toll-free call | None | ||||
| New York DOT | None | |||||
| North Carolina DOT | 511 | None | NWS | None | Forecast maximum temperature, minimum temperature, precipitation type, precipitation probability, cloud cover | Weather not provided relative to specific roads. NWS NDFD used. |
| North Dakota DOT | 511 | DOT | Private Sector | Pavement state | Current and forecast cloud cover, wind speed, wind direction, wind gusts, air temperature, visibility, precipitation type, and precipitation intensity | DOT road condition reports |
| Cincinnati/Northern Kentucky | 511 | None | NWS | None | NWS forecast precipitation type, precipitation intensity, precipitation amount, precipitation probability, maximum air temperature, minimum air temperature, wind speed, wind direction, visibility | Weather not provided relative to specific roads |
| Ohio DOT | Toll-free call | None | None | |||
| Oklahoma DOT | Toll-free call | DOT | None | Pavement state | ||
| Oregon DOT | 511 | DOT | NWS | Pavement state | Current cloud cover, precipitation type | Weather not provided relative to specific roads |
| Pennsylvania DOT | Toll-free call | DOT | None | Pavement state | Available only from Nov. 1 – Apr. 30 | |
| Rhode Island DOT | 511 | DOT | NWS | Pavement state | Forecast precipitation type, precipitation amount, precipitation probability, wind speed and direction, cloud cover, air temperature | Weather not provided relative to specific roads. NWS zone forecast. |
| South Carolina DOT | None | |||||
| South Dakota DOT | 511 | DOT | Private Sector | Pavement state | Current and forecast cloud cover, wind speed, wind direction, wind gusts, air temperature, visibility, precipitation type, and precipitation intensity | DOT road condition reports |
| Tennessee DOT | 511 | DOT | NWS | Pavement state | Current and forecast cloud cover, wind speed, wind direction, wind gusts, wind chill, air temperature, visibility, precipitation type, and precipitation intensity. | |
| Texas DOT | Toll-free call | DOT | DOT | Pavement state | Precipitation types, maximum temperature, minimum temperature, watches, warnings, advisories. | Manual DOT synthesis of NWS regional forecasts |
| Utah DOT | 511 | DOT | DOT | Pavement state | Current and forecast precipitation type, sky conditions. | |
| Vermont DOT | 511 | DOT | NWS | Pavement state | Forecast precipitation type, precipitation intensity, precipitation amount, precipitation probability, maximum air temperature, minimum air temperature, wind speed, wind direction, visibility | Weather not provided relative to specific roads; DOT road conditions |
| Virginia DOT | 511 | DOT | NWS | Pavement state | Forecast precipitation type, precipitation amount, precipitation probability, wind speed and direction, cloud cover, air temperature | Weather not provided relative to specific roads; NWS NDFD data. |
| Washington DOT | 511 | DOT | NWS | Pavement state, current and forecast | Current air temperature, precipitation, cloud cover. Forecast cloud cover, wind speed, wind direction, air temperature, freezing level, precipitation type, precipitation intensity | |
| West Virginia DOT | Toll-free call | DOT | None | Pavement state | ||
| Wisconsin DOT | Toll-free call | State Patrol | None | Pavement state | None | |
| Wyoming DOT | 511 | Private Sector/DOT | Pavement state | Current and forecast cloud cover, wind speed, wind direction, wind gusts, air temperature, visibility, precipitation type, and precipitation intensity | DOT road condition reports |
Public Web-Based Road Weather Content Delivery
| >Informer | >Web Resource Type | >Road Specific Content Provider | >Weather Specific Content Provider | >Road Specific Content | >Weather Specific Content | >Comments |
|---|---|---|---|---|---|---|
| Alabama DOT | Traveler Information | DOT | None | Pavement state | None | Link to NWS website and DOT hurricane evacuation routes |
| Alaska DOT | Traveler Information | DOT | Pavement state | Current and forecast precipitation type, precipitation amount, precipitation probability, wind speed and direction, cloud cover, air temperature | ||
| Arizona DOT | Traveler Information | DOT | DOT, NWS | Pavement state | Current ESS includes air temperature, dew point, pressure, air temperature, visibility, wind speed, wind direction, wind gust, precipitation type, and precipitation rate. Forecast precipitation type, precipitation probability, cloud cover, air temperature | NWS state tabular forecast |
| Arkansas DOT | Traveler Information | DOT | None | Pavement state | None | |
| CalTrans (Sacramento/Northern California) | Traveler Information | DOT | None | Pavement state | None | Link to general NWS web site |
| CalTrans (San Diego) | Traveler Information | None | None | None | None | |
| CalTrans (San Francisco) | Traveler Information | None | None | None | None | |
| Colorado DOT | Traveler Information | DOT | DOT | Pavement state | Current ESS includes air temperature, dew point, pressure, air temperature, visibility, wind speed, wind direction, wind gust, precipitation type, and precipitation rate. Forecast cloud cover, precipitation type, minimum temperature, maximum temperature | Provide links to NWS |
| Connecticut DOT | Traveler Information | None | None | None | None | |
| Delaware DOT | Traveler Information | DOT | DOT | Current pavement state, pavement temperature, sub-pavement temperature | Current ESS includes air temperature, dew point, pressure, air temperature, visibility, wind speed, wind direction, wind gust, precipitation type, and precipitation rate. | Google Map-based. Incident-based reporting of weather. |
| Central Florida | Traveler Information | None | None | |||
| Jacksonville | Traveler Information | None | None | |||
| Southeast Florida | Traveler Information | None | None | |||
| Tampa Bay | Traveler Information | None | None | |||
| Georgia DOT | Traveler Information | DOT | None | Pavement state | None | |
| Hawaii DOT | Traveler Information | DOT | None | None | ||
| Idaho DOT | Traveler Information | DOT | NWS | Pavement state | Current air temperature, sky cover, precipitation type, wind speed, wind direction, visibility, pressure, dew point temperature, and humidity. Forecast precipitation type, precipitation intensity, precipitation amount, precipitation probability, maximum air temperature, minimum air temperature, wind speed, wind direction, visibility | |
| Illinois DOT | Traveler Information | DOT | Pavement state | Current ESS includes observations air temperature, dew point, pressure, air temperature, visibility, wind speed, wind direction, wind gust, precipitation type, and precipitation rate. | Difficulty with web access | |
| Indiana DOT | Traveler Information | State Patrol, DOT | DOT | Current and forecasted pavement state. ESS pavement temperature, sub-pavement temperature | Current ESS observations includes air temperature, dew point, air temperature, wind speed, wind direction, wind gust | Traffic speeds. Link to NWS |
| Iowa DOT | Traveler Information | DOT | DOT, NWS, Private Sector. | Pavement temperature, sub-pavement temperature | Current ESS air temperature, precipitation type, wind speed, wind direction, dew point temperature, and humidity wind gust, precipitation type, and precipitation rate. NWS forecast precipitation type, precipitation intensity, precipitation amount, precipitation probability, maximum air temperature, minimum air temperature, wind speed, wind direction, visibility. NWS watches / warnings / advisories. | |
| Kansas DOT | Traveler Information | DOT | Private Sector | Road conditions, current and forecast precipitation type, precipitation intensity | Current and forecast cloud cover, wind speed, wind direction, air temperature | DOT road condition reports |
| Kentucky DOT | Traveler Information | DOT | DOT, NWS | Pavement wetness, pavement temperature, sub-pavement temperature | Current ESS air temperature, dew point temperature, solar radiation, precipitation rate, wind direction, wind speed, wind gust, relative humidity, precipitation accumulation. NWS forecast precipitation type, precipitation intensity, precipitation amount, precipitation probability, maximum air temperature, minimum air temperature, wind speed, wind direction, visibility. | |
| Louisiana DOT | Traveler Information | DOT | NWS | Pavement state | NWS forecast precipitation type, precipitation intensity, precipitation amount, precipitation probability, maximum air temperature, minimum air temperature, wind speed, wind direction, visibility. | |
| Maine DOT | Traveler Information | DOT | NWS | Pavement state | Current air temperature, sky cover. NWS forecast precipitation type, precipitation intensity, precipitation amount, precipitation probability, maximum air temperature, minimum air temperature, wind speed, wind direction, visibility. | |
| Maryland DOT | Traveler Information | DOT | DOT | Pavement temperature, pavement state. | Current ESS air temperature, precipitation type, wind speed, wind direction, visibility, dew point temperature, and relative humidity, precipitation type, and precipitation intensity. | Link to NWS forecasts |
| Massachusetts DOT | Traveler Information | DOT | NWS | Pavement state | Current air temperature, dew point temperature, sky cover, wind speed, wind direction, pressure, precipitation type, precipitation amount. | Weather is from airport METARS |
| Michigan DOT | Traveler Information | DOT | None | Pavement state | ||
| Minnesota DOT | Traveler Information | DOT | NWS | Pavement state | NWS forecast precipitation type, precipitation intensity, precipitation amount, precipitation probability, maximum air temperature, minimum air temperature, wind speed, wind direction, visibility. | |
| Mississippi DOT | Traveler Information | None | None | |||
| Missouri DOT | Traveler Information | DOT | None | Pavement state | ||
| Montana DOT | Traveler Information | DOT | DOT | Pavement temperature, sub-pavement temperature, pavement state, chemical factor, freezing point temperature, chemical percent, depth of water, ice percent, conductivity, salinity | Current ESS air temperature, dew point temperature, precipitation rate, wind direction, wind speed, wind gust, relative humidity, visibility, precipitation accumulation, precipitation type, precipitation intensity. | Link to NWS forecasts |
| Nebraska DOR | Traveler Information | DOT | None | Pavement state | None | Link to various private sector and NWS web sites |
| Nevada DOT | Traveler Information | None | Private Sector | None | Current and forecast cloud cover, wind speed, wind direction, wind gusts, air temperature, visibility, precipitation type, and precipitation intensity | |
| New Hampshire DOT | Traveler Information | DOT | DOT | Pavement state, pavement temperature. | Current ESS air temperature, dew point temperature, relative humidity, wind speed, wind direction, wind gust, precipitation intensity, precipitation type, visibility. | |
| New Jersey DOT | Traveler Information | None | None | |||
| New Mexico DOT | Traveler Information | DOT | DOT | Pavement state | Reported wind speed, precipitation, and visibility. | Link to NWS web site |
| New York DOT | Traveler Information | DOT | NWS | Pavement state | Forecast maximum temperature, minimum temperature, precipitation type, precipitation probability, cloud cover, watches, warnings, and advisories. | NWS NDFD data |
| North Carolina DOT | Traveler Information | None | None | None | None | Link to NWS web site |
| North Dakota DOT | Traveler Information | DOT | Private Sector | Pavement temperature, sub-pavement temperature, pavement state, chemical factor, freezing point temperature, chemical percent, depth of water, ice percent, conductivity, salinity | Current ESS air temperature, dew point temperature, precipitation rate, wind direction, wind speed, wind gust, relative humidity, visibility, precipitation accumulation, precipitation type, precipitation intensity. Current and forecast cloud cover, wind speed, wind direction, wind gusts, air temperature, visibility, precipitation type, and precipitation intensity. | |
| Cincinnati/Northern Kentucky | ||||||
| Ohio DOT | Traveler Information | DOT | DOT | Pavement state (ESS), pavement state (reports), pavement temperature, sub-pavement temperature | Current ESS air temperature, dew point temperature, precipitation rate, wind direction, wind speed, wind gust, relative humidity, visibility, precipitation type. | |
| Oklahoma DOT | Traveler Information | DOT | None | Pavement state | Links to NWS and private sector weather web sites | |
| Oregon DOT | Traveler Information | DOT | DOT, NWS | Pavement state | Current ESS air temperature, dew point temperature, relative humidity, wind speed, wind direction, wind gust, precipitation, snow indicator. Sky cover, precipitation type reported by observer. NWS forecast precipitation type, precipitation intensity, precipitation amount, precipitation probability, maximum air temperature, minimum air temperature, wind speed, wind direction, visibility | |
| Pennsylvania DOT | Traveler Information | DOT | DOT, Private Sector | Pavement state, pavement temperature, chemical percent, freeze point temperature, sub-pavement temperature | Current ESS air temperature, dew point temperature, relative humidity, wind speed, wind direction, wind gust, precipitation. Private sector provision of NWS radar and satellite. | Links to NWS weather web sites across the state. |
| Rhode Island DOT | Traveler Information | DOT | NWS | Pavement state | NWS forecast precipitation type, precipitation intensity, precipitation amount, precipitation probability, maximum air temperature, minimum air temperature, wind speed, wind direction, visibility | |
| South Carolina DOT | Traveler Information | DOT | None | Pavement state | Links to various private sector and the NWS weather web sites. | |
| South Dakota DOT | Traveler Information | DOT | Private Sector | Pavement state | Current and forecast cloud cover, wind speed, wind direction, wind gusts, air temperature, visibility, precipitation type, and precipitation intensity | |
| Tennessee DOT | Traveler Information | DOT | None | Pavement state | ||
| Texas DOT | Traveler Information | DOT | None | Pavement state | Link to 'hurricane' goes to NWS and Private Sector web sites | |
| Utah DOT | Traveler Information | DOT | DOT | Pavement state | Current and forecast precipitation type, sky conditions. | Link to NWS web sites |
| Vermont DOT | Traveler Information | DOT | NWS | Pavement state | Current air temperature, sky cover. NWS forecast precipitation type, precipitation intensity, precipitation amount, precipitation probability, maximum air temperature, minimum air temperature, wind speed, wind direction, visibility. | |
| Virginia DOT | Traveler Information | DOT | Private Sector | Pavement state | Forecast maximum temperature, minimum temperature, precipitation type, cloud cover, radar and satellite images. | Weather not provided relative to specific roads. |
| Washington DOT | Traveler Information | DOT | DOT, NWS | Pavement temperature | Current ESS air temperature, dew point temperature, relative humidity, wind speed wind direction, visibility, pressure, 24-hr maximum air temperature, 24-hr minimum air temperature. NWS forecast precipitation type, precipitation intensity, precipitation amount, precipitation probability, maximum air temperature, minimum air temperature, wind speed, wind direction, visibility, weather satellite. | |
| West Virginia DOT | Traveler Information | DOT | NWS | Pavement state | NWS forecast precipitation type, precipitation intensity, precipitation amount, precipitation probability, maximum air temperature, minimum air temperature, wind speed, wind direction, visibility | NWS NDFD clickable maps |
| Wisconsin DOT | Traveler Information | DOT | None | Pavement state | None | Links to various private sector, academic, and NWS web sites |
| Wyoming DOT | Traveler Information | DOT | DOT | Pavement state, pavement temperature, sub-pavement temperature | ESS air temperature, relative humidity, dew point temperature, wind speed, wind direction, wind gust. |
DOT Operation Support (Excludes the ESS data)
| Informer | Resource Type | Road Specific Content Provider | Weather Specific Content Provider | Road Specific Content | Weather Specific Content | Delivery Format | Comments |
|---|---|---|---|---|---|---|---|
| Alabama DOT | Maintenance | None | NWS | Flooding | NWS forecast precipitation type, precipitation intensity, precipitation amount, precipitation probability, maximum air temperature, minimum air temperature, wind speed, wind direction, visibility, weather radar. | ||
| Alaska DOT | Winter Maintenance | None | DOT, NWS | None | Snow depth. NWS forecast precipitation type, precipitation intensity, precipitation amount, precipitation probability, air temperature, maximum air temperature, minimum air temperature, wind speed, wind direction, visibility. | Graphics, Text | |
| Arizona DOT | Winter Maintenance | None | NWS | None | NWS forecast precipitation type, precipitation intensity, precipitation amount, precipitation probability, air temperature, maximum air temperature, minimum air temperature, wind speed, wind direction, visibility | Graphics, Text | |
| Arkansas DOT | Maintenance | None | NWS | None | NWS forecast precipitation type, precipitation intensity, precipitation amount, precipitation probability, maximum air temperature, minimum air temperature, wind speed, wind direction, visibility, weather radar. | Graphics | |
| California District 2 | Winter Maintenance | DOT | DOT, Academia | METAR air temperature, dew point temperature, precipitation rate, wind direction, wind speed, wind gust, relative humidity, visibility, precipitation accumulation, precipitation type, precipitation intensity. | Graphics | ||
| California District 3 | Winter Maintenance | DOT, Private Sector | DOT, Private Sector | Forecasts pavement temperature, pavement condition, treatment recommendations, mobility | METAR air temperature, dew point temperature, precipitation rate, wind direction, wind speed, wind gust, relative humidity, visibility, precipitation accumulation, precipitation type, precipitation intensity. Forecast for air temperature, precipitation type, precipitation amount, precipitation rate, precipitation probability, precipitation accumulation, wind speed, wind direction, blowing snow, dew point temperature, solar radiation, cloud cover. | Graphics | MDSS |
| Colorado DOT | Winter Maintenance | DOT, Private Sector | DOT, Private Sector | Treatment reports. Forecasts pavement temperature, pavement condition, treatment recommendations, mobility | METAR air temperature, dew point temperature, precipitation rate, wind direction, wind speed, wind gust, relative humidity, visibility, precipitation accumulation, precipitation type, precipitation intensity. Forecast for air temperature, precipitation type, precipitation amount, precipitation rate, precipitation probability, precipitation accumulation, wind speed, wind direction, blowing snow, dew point temperature, solar radiation, cloud cover. | Graphics, In-vehicle | |
| Colorado DOT | Traffic Mgmt | DOT | DOT | Treatment reports. Traffic cameras. Analyzed pavement conditions. | METAR air temperature, dew point temperature, precipitation rate, wind direction, wind speed, wind gust, relative humidity, visibility, precipitation accumulation, precipitation type, precipitation intensity. | Graphics | |
| Colorado E-470 | Winter Maintenance | Private Sector, DOT, Federal Lab | Private Sector, DOT, Federal Lab | Forecasts pavement temperature, pavement condition, treatment recommendations, mobility | METAR air temperature, dew point temperature, precipitation rate, wind direction, wind speed, wind gust, relative humidity, visibility, precipitation accumulation, precipitation type, precipitation intensity. Forecast for air temperature, precipitation type, precipitation amount, precipitation rate, precipitation probability, precipitation accumulation, wind speed, wind direction, blowing snow, dew point temperature, cloud cover | Graphics | |
| Colorado - Denver | Winter Maintenance | City, DOT, Federal Lab | City, DOT, Federal Lab | Forecasts pavement temperature, pavement condition, treatment recommendations, mobility | METAR air temperature, dew point temperature, precipitation rate, wind direction, wind speed, wind gust, relative humidity, visibility, precipitation accumulation, precipitation type, precipitation intensity. Forecast for air temperature, precipitation type, precipitation amount, precipitation rate, precipitation probability, precipitation accumulation, wind speed, wind direction, blowing snow, dew point temperature, cloud cover | Graphics | |
| Connecticut DOT | Winter Maintenance | DOT | DOT | ||||
| Delaware DOT | Winter Maintenance | Unknown | Unknown | ESS usage only | |||
| Florida DOT | Maintenance | DOT | NWS, Private Sector | Flooding | Weather radar, NWS watches, warnings, advisories | Graphics, Text | ESS usage only |
| Georgia DOT | None | ESS usage only | |||||
| Hawaii DOT | Maintenance | Unknown | Unknown | ESS usage only | |||
| Idaho DOT | Winter Maintenance | Private Sector | Private Sector, NWS | Forecasts pavement temperature, pavement condition | Forecast for air temperature, precipitation type, precipitation amount, precipitation rate, precipitation probability, precipitation accumulation, wind speed, wind direction, dew point temperature, cloud cover | Graphics, Text | |
| Illinois DOT | Winter Maintenance | Private Sector | Private Sector | Forecast pavement temperature, pavement condition | Forecast for air temperature, precipitation type, precipitation amount, precipitation rate, precipitation probability, precipitation accumulation, wind speed, wind direction, dew point temperature, percent of sunshine, cloud cover | Graphics, Text | |
| Indiana DOT | Maintenance | Private Sector | Private Sector | Treatment reports. Forecast pavement temperature, pavement condition, treatment recommendations, mobility, frost probability | METAR air temperature, dew point temperature, precipitation rate, wind direction, wind speed, wind gust, relative humidity, visibility, precipitation accumulation, precipitation type, precipitation intensity. Forecast for air temperature, precipitation type, precipitation amount, precipitation rate, precipitation probability, precipitation accumulation, wind speed, wind direction, blowing snow, dew point temperature, solar radiation, cloud cover. Thunderstorm outlook, flooding hazard assessment | Graphics, Text, Electronic alerts, In-vehicle | |
| Indiana Toll Road Concession | Winter Maintenance | Private Sector | Private Sector | Forecast pavement temperature, pavement condition, frost probability | Forecast for air temperature, precipitation type, precipitation amount, precipitation rate, precipitation probability, precipitation accumulation, wind speed, wind direction, blowing snow, dew point temperature, solar radiation, cloud cover. | Graphics, Electronic Alerts | Seasonal |
| Iowa DOT | Winter Maintenance | Private Sector | Private Sector | Treatment reports. Forecasts pavement temperature, pavement condition, treatment recommendations, mobility, frost | METAR air temperature, dew point temperature, precipitation rate, wind direction, wind speed, wind gust, relative humidity, visibility, precipitation accumulation, precipitation type, precipitation intensity. Forecast for air temperature, precipitation type, precipitation amount, precipitation rate, precipitation probability, precipitation accumulation, wind speed, wind direction, blowing snow, dew point temperature, solar radiation, cloud cover. | Graphics, Electronic Alerts, Text | |
| Kansas DOT | Winter Maintenance | Private Sector | Private Sector | Treatment reports. Forecasts pavement temperature, pavement condition, treatment recommendations, mobility | METAR air temperature, dew point temperature, precipitation rate, wind direction, wind speed, wind gust, relative humidity, visibility, precipitation accumulation, precipitation type, precipitation intensity. Forecast for air temperature, precipitation type, precipitation amount, precipitation rate, precipitation probability, precipitation accumulation, wind speed, wind direction, blowing snow, dew point temperature, solar radiation, cloud cover. | Graphics, In-vehicle | |
| Kentucky DOT | Winter Maintenance | Private Sector | Private Sector | Forecast pavement temperature, pavement condition, frost, treatment recommendations | Forecast for air temperature, precipitation type, precipitation amount, precipitation rate, precipitation probability, precipitation accumulation, wind speed, wind direction, dew point temperature, cloud cover | Graphics, Text | |
| Louisiana DOT | Maintenance | Unknown | Unknown | ||||
| Maine DOT | Winter Maintenance | Private Sector | Private Sector | Forecast pavement temperature, pavement condition, frost, treatment recommendations | Forecast for air temperature, precipitation type, precipitation amount, precipitation rate, precipitation probability, precipitation accumulation, wind speed, wind direction, dew point temperature, cloud cover | Graphics, Text | |
| Maryland DOT | Winter Maintenance | Unknown | NWS | Forecast for air temperature, precipitation type, precipitation amount, precipitation rate, precipitation probability, precipitation accumulation, wind speed, wind direction, dew point temperature, cloud cover | |||
| Massachusetts DOT | Winter Maintenance | Unknown | Unknown | ||||
| Michigan DOT | Winter Maintenance | Unknown | Unknown | ||||
| Minnesota DOT | Winter Maintenance | Private Sector | Private Sector | Treatment reports. Forecast pavement temperature, pavement condition, treatment recommendations, mobility | METAR air temperature, dew point temperature, precipitation rate, wind direction, wind speed, wind gust, relative humidity, visibility, precipitation accumulation, precipitation type, precipitation intensity. Forecast for air temperature, precipitation type, precipitation amount, precipitation rate, precipitation probability, precipitation accumulation, wind speed, wind direction, blowing snow, dew point temperature, solar radiation, cloud cover. | Graphics, In-vehicle | |
| Minnesota DOT (Minneapolis) | Traffic Mgmt | DOT | Private Sector, NWS | Traffic cameras, pavement condition forecasts | Weather radar. Forecast of precipitation type, precipitation probability, precipitation rate | Graphics | |
| Mississippi DOT | Maintenance | Unknown | Unknown | ||||
| Missouri DOT | Winter Maintenance | Private Sector | Private Sector | Forecast pavement temperature, frost probability | Forecast of cloud cover, precipitation type, precipitation probability, precipitation accumulation, maximum air temperature, minimum air temperature, wind speed, wind direction, wind gust, dew point temperature, drifting snow. | Text | |
| Montana DOT | Winter Maintenance | Private Sector | Private Sector, NWS | Forecast pavement temperature, pavement condition | Forecast for air temperature, precipitation type, precipitation amount, precipitation rate, precipitation probability, precipitation accumulation, wind speed, wind direction, dew point temperature, cloud cover. | Graphics, Text | |
| Nebraska DOR | Winter Maintenance | Private Sector | Private Sector | Treatment reports. Forecast pavement temperature, pavement condition, treatment recommendations, mobility | METAR air temperature, dew point temperature, precipitation rate, wind direction, wind speed, wind gust, relative humidity, visibility, precipitation accumulation, precipitation type, precipitation intensity. Forecast for air temperature, precipitation type, precipitation amount, precipitation rate, precipitation probability, precipitation accumulation, wind speed, wind direction, blowing snow, dew point temperature, solar radiation, cloud cover. | Graphics | |
| Nevada DOT | Winter Maintenance | Private Sector | Private Sector, NWS | Forecast pavement temperature, pavement condition | Forecast for air temperature, precipitation type, precipitation amount, precipitation rate, precipitation probability, precipitation accumulation, wind speed, wind direction, dew point temperature, cloud cover. | Graphics, Text | |
| New Hampshire DOT | Winter Maintenance | Private Sector, Academia | Private Sector, Academia | Treatment reports. Forecast pavement temperature, pavement condition, treatment recommendations, mobility | METAR air temperature, dew point temperature, precipitation rate, wind direction, wind speed, wind gust, relative humidity, visibility, precipitation accumulation, precipitation type, precipitation intensity. Forecast for air temperature, precipitation type, precipitation amount, precipitation rate, precipitation probability, precipitation accumulation, wind speed, wind direction, blowing snow, dew point temperature, solar radiation, cloud cover. | Graphics | |
| New Jersey DOT | Winter Maintenance | Private Sector | Private Sector | Forecast pavement temperature, pavement condition, frost, treatment recommendations | Forecast for air temperature, precipitation type, precipitation amount, precipitation rate, precipitation probability, precipitation accumulation, wind speed, wind direction, dew point temperature, cloud cover | Graphics, Text | |
| New Jersey (Cherry Hill) | Traffic Mgmt | DOT | Private Sector, NWS | Forecast pavement condition | Weather radar. Forecast of precipitation type, precipitation probability, precipitation rate | Graphics | |
| New Mexico DOT | Winter Maintenance | None | NWS | None | NWS forecast precipitation type, precipitation intensity, precipitation amount, precipitation probability, maximum air temperature, minimum air temperature, wind speed, wind direction, visibility | Graphics | |
| New York DOT | Winter Maintenance | Private Sector | Private Sector | Treatment reports. Forecasts pavement temperature, pavement condition, treatment recommendations, mobility | METAR air temperature, dew point temperature, precipitation rate, wind direction, wind speed, wind gust, relative humidity, visibility, precipitation accumulation, precipitation type, precipitation intensity. Forecast for air temperature, precipitation type, precipitation amount, precipitation rate, precipitation probability, precipitation accumulation, wind speed, wind direction, blowing snow, dew point temperature, solar radiation, cloud cover. | Graphics, Electronic Alerts | |
| North Carolina DOT | Winter Maintenance | None | NWS | NWS forecast precipitation type, precipitation intensity, precipitation amount, precipitation probability, maximum air temperature, minimum air temperature, wind speed, wind direction, visibility | Graphics | Major concern for forecasting of ice storms | |
| North Dakota DOT | Winter Maintenance | Private Sector | Private Sector | Treatment reports. Forecast pavement temperature, pavement condition, treatment recommendations, mobility, frost probability | METAR air temperature, dew point temperature, precipitation rate, wind direction, wind speed, wind gust, relative humidity, visibility, precipitation accumulation, precipitation type, precipitation intensity. Forecast for air temperature, precipitation type, precipitation amount, precipitation rate, precipitation probability, precipitation accumulation, wind speed, wind direction, blowing snow, dew point temperature, solar radiation, cloud cover. | Graphics, In-vehicle, Electronic Alerts | |
| Ohio DOT | Winter Maintenance | Private Sector | Private Sector | Forecast pavement temperature, pavement condition, frost probability | Forecast for air temperature, precipitation type, precipitation amount, precipitation rate, precipitation probability, precipitation accumulation, wind speed, wind direction, dew point temperature, cloud cover. | Graphics, Electronic Alerts | |
| Oklahoma DOT | Winter Maintenance | None | NWS, Academia | None | Oklahoma Mesonet for air temperature, precipitation rate, precipitation accumulation, wind speed, wind direction, wind gust, dew point temperature. NWS weather radar. NWS forecast precipitation type, precipitation intensity, precipitation amount, precipitation probability, maximum air temperature, minimum air temperature, wind speed, wind direction, visibility | Graphics | |
| Oregon DOT | Winter Maintenance | Unknown | Unknown | ||||
| Pennsylvania DOT | Winter Maintenance | None | Private Sector | None | Forecast for air temperature, precipitation type, precipitation amount, wind speed, wind direction, dew point temperature, cloud cover, severe weather potential | Text | |
| Rhode Island DOT | Winter Maintenance | Unknown | Unknown | ||||
| South Carolina DOT | Maintenance | Unknown | Unknown | ||||
| South Dakota DOT | Winter Maintenance | Private Sector | Private Sector | Treatment reports. Forecast pavement temperature, pavement condition, treatment recommendations, mobility | METAR air temperature, dew point temperature, precipitation rate, wind direction, wind speed, wind gust, relative humidity, visibility, precipitation accumulation, precipitation type, precipitation intensity. Forecast for air temperature, precipitation type, precipitation amount, precipitation rate, precipitation probability, precipitation accumulation, wind speed, wind direction, blowing snow, dew point temperature, solar radiation, cloud cover. | Graphics, In-vehicle | |
| Tennessee DOT | Winter Maintenance | None | Private Sector | Forecast for precipitation type, precipitation amount, precipitation rate, precipitation probability, precipitation accumulation | Electronic Alerts | ||
| Texas DOT | Maintenance | None | NWS | Flash flooding | Current precipitation, air temperatures, wind speed. Forecast for air temperature, precipitation type, precipitation amount, precipitation rate, precipitation probability, precipitation accumulation, wind speed, wind direction, dew point temperature, cloud cover, flooding, severe convection, fire hazard. | Graphics, Text | |
| Texas DOT (Houston) | Traffic Mgmt | DOT | NWS | Flood monitors, pavement condition | Weather radar. Forecast of precipitation type, precipitation probability, precipitation rate | Graphics | |
| Utah DOT | Winter Maintenance | DOT | DOT | Forecasts pavement temperature, pavement condition | MesoWest and METAR air temperature, dew point temperature, precipitation rate, wind direction, wind speed, wind gust, relative humidity, visibility, precipitation accumulation, precipitation type, precipitation intensity. Forecast for air temperature, precipitation type, precipitation amount, precipitation rate, precipitation probability, precipitation accumulation, wind speed, wind direction, dew point temperature, cloud cover. | Verbal, Text | |
| Utah DOT | Traffic Mgmt | DOT | DOT | Forecasts pavement temperature, pavement condition | MesoWest and METAR air temperature, dew point temperature, precipitation rate, wind direction, wind speed, wind gust, relative humidity, visibility, precipitation accumulation, precipitation type, precipitation intensity. Forecast for air temperature, precipitation type, precipitation amount, precipitation rate, precipitation probability, precipitation accumulation, wind speed, wind direction, dew point temperature, cloud cover. | Verbal | |
| Vermont DOT | Winter Maintenance | Unknown | |||||
| Virginia DOT | Winter Maintenance | Private Sector | Private Sector | Treatment reports. Forecasts pavement temperature, pavement condition, treatment recommendations, mobility, frost probability. | METAR air temperature, dew point temperature, precipitation rate, wind direction, wind speed, wind gust, relative humidity, visibility, precipitation accumulation, precipitation type, precipitation intensity. Forecast for air temperature, precipitation type, precipitation amount, precipitation rate, precipitation probability, precipitation accumulation, wind speed, wind direction, blowing snow, dew point temperature, solar radiation, cloud cover. | Graphics | |
| Washington DOT | Winter Maintenance | Academia, Private Sector | Academia, Private Sector | Forecast pavement temperature, pavement conditions | Forecast for air temperature, precipitation type, precipitation amount, precipitation rate, precipitation probability, precipitation accumulation, wind speed, wind direction, blowing snow, dew point temperature, cloud cover. | Graphics, Text | |
| Washington, D.C. DOT | Winter Maintenance | Private Sector | Private Sector | Forecast pavement temperature, pavement conditions | Forecast for air temperature, precipitation type, precipitation amount, precipitation rate, precipitation probability, wind speed, wind direction, dew point temperature, cloud cover. | Text | |
| West Virginia DOT | Winter Maintenance | Unknown | Unknown | ||||
| Wisconsin DOT | Winter Maintenance | Private Sector | Private Sector | Forecast pavement temperature, pavement condition, frost probability | Forecast for air temperature, precipitation type, precipitation amount, precipitation rate, precipitation probability, precipitation accumulation, wind speed, wind direction, dew point temperature, cloud cover. | Graphics, Electronic Alerts | |
| Wyoming DOT | Treatment reports. Forecast pavement temperature, pavement condition, treatment recommendations, mobility | METAR air temperature, dew point temperature, precipitation rate, wind direction, wind speed, wind gust, relative humidity, visibility, precipitation accumulation, precipitation type, precipitation intensity. Forecast for air temperature, precipitation type, precipitation amount, precipitation rate, precipitation probability, precipitation accumulation, wind speed, wind direction, blowing snow, dew point temperature, solar radiation, cloud cover. | Graphics, In-vehicle |
APPENDIX C: Scan results - uniform ESS content
Environmental Sensor Station Data Typical to State DOTs
| Pavement temperature, sub-pavement temperature, pavement state, chemical factor, freezing point temperature, chemical percent, depth of water, ice percent, conductivity, salinity, camera imagery. | ESS air temperature, dew point temperature, precipitation rate, wind direction, wind speed, wind gust, relative humidity, visibility, precipitation accumulation, precipitation type, precipitation intensity. |
APPENDIX D: QAM Results for Road Weather Product Types
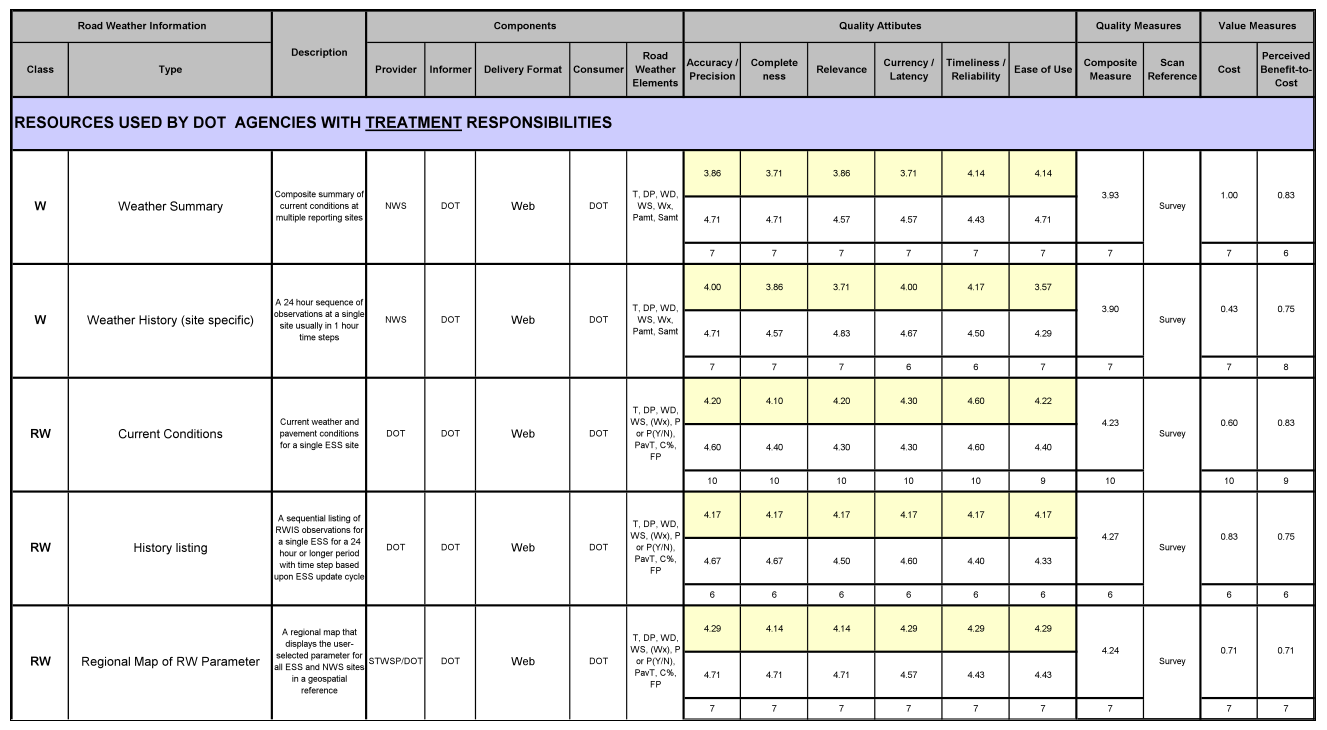
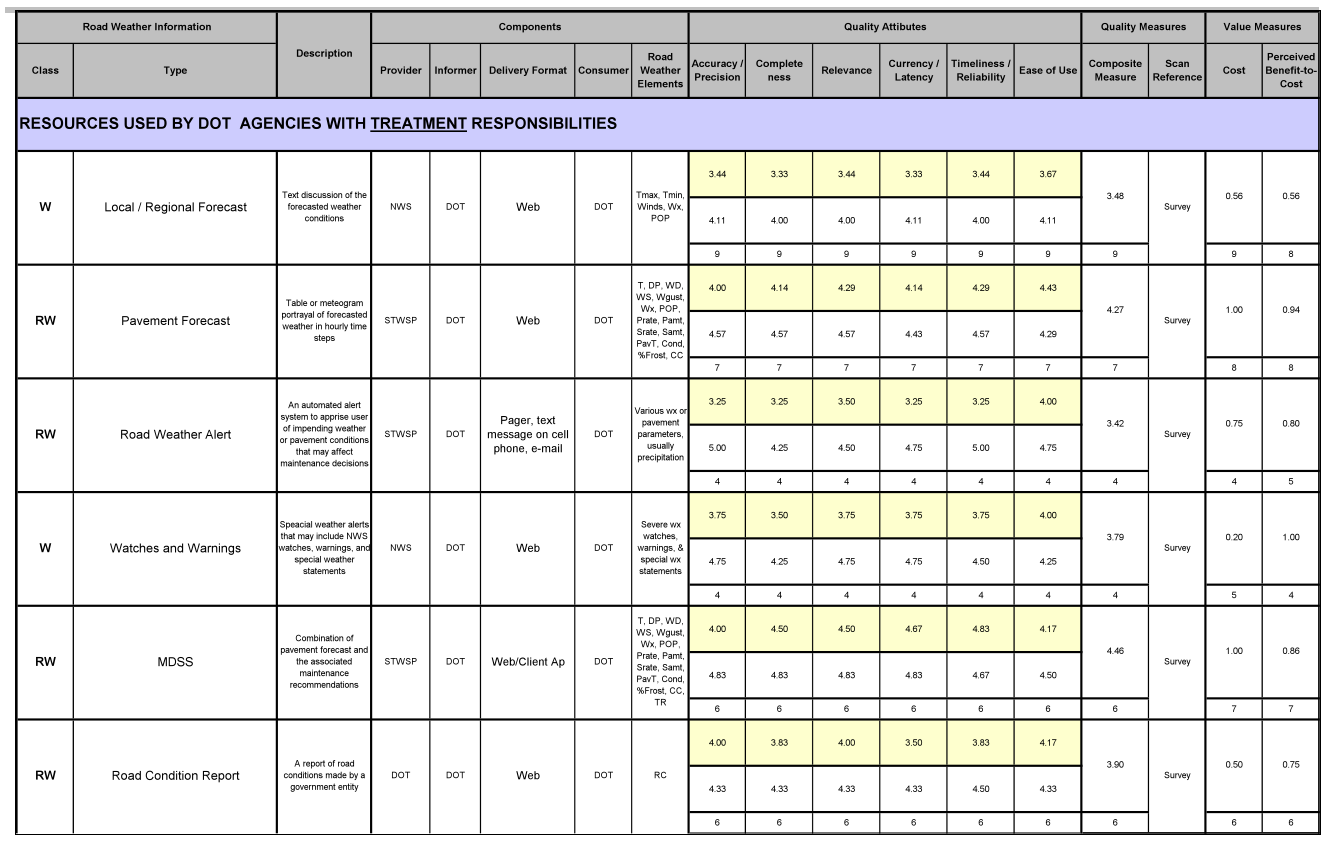
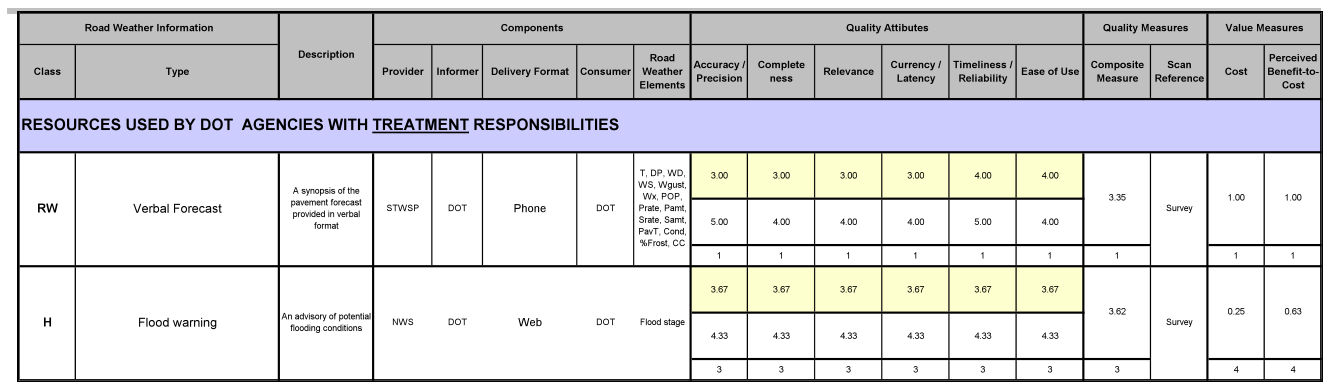
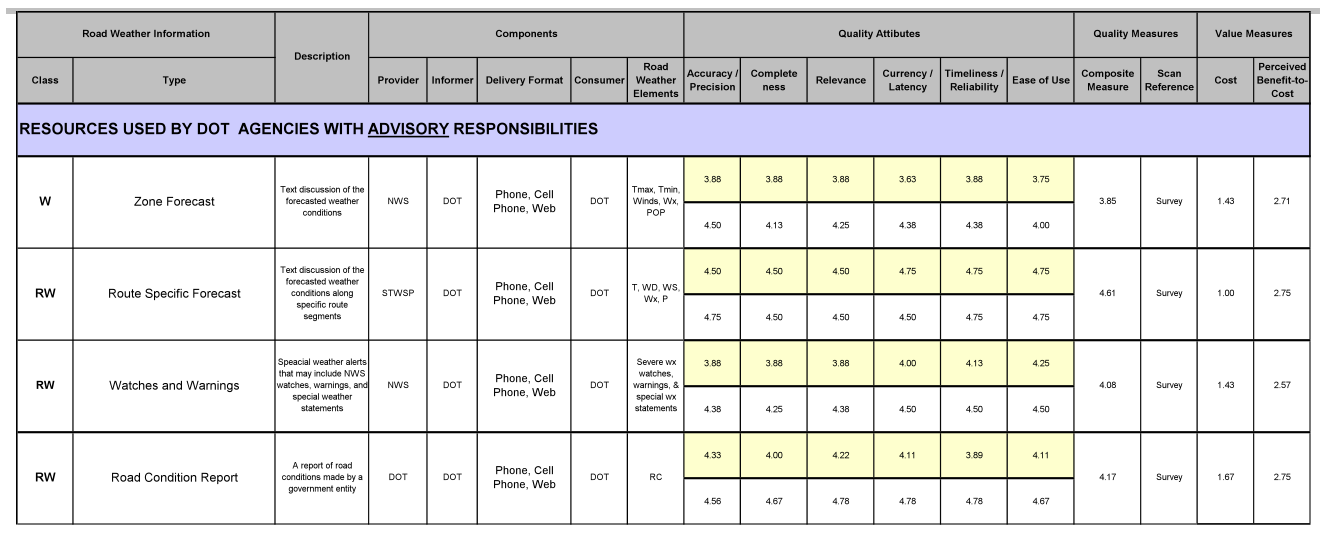
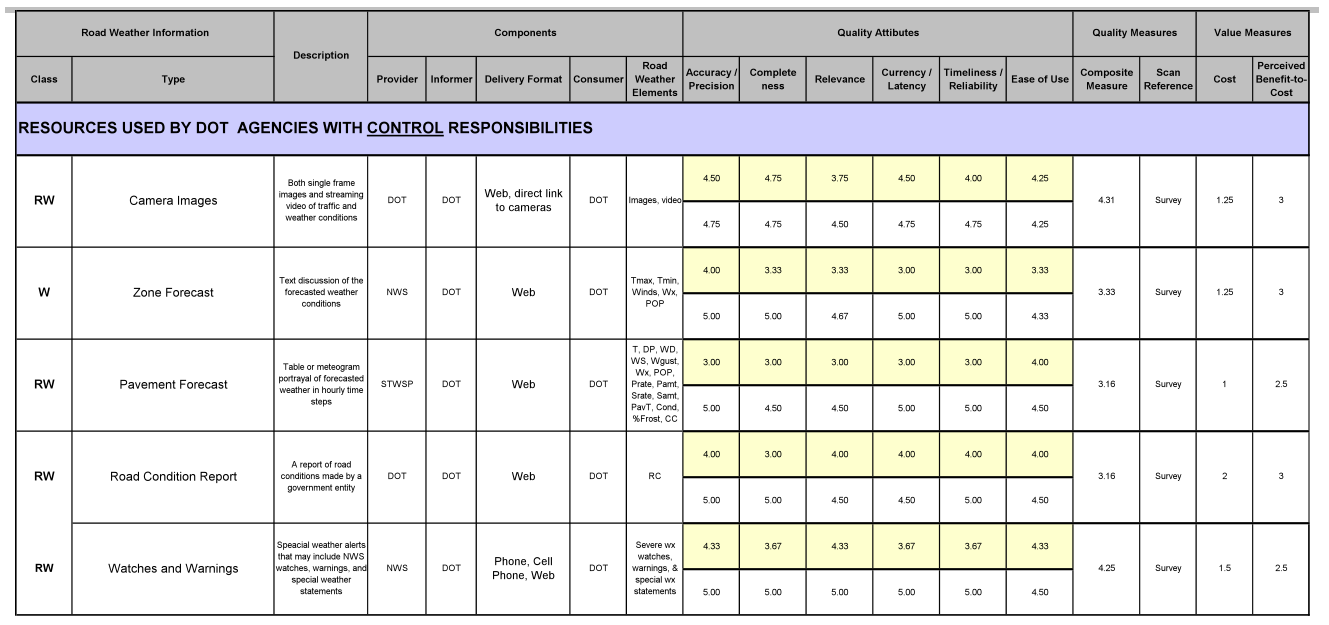
APPENDIX E: QAM results for Road Weather Elements
TREATMENT STRATEGY (1 of 4)
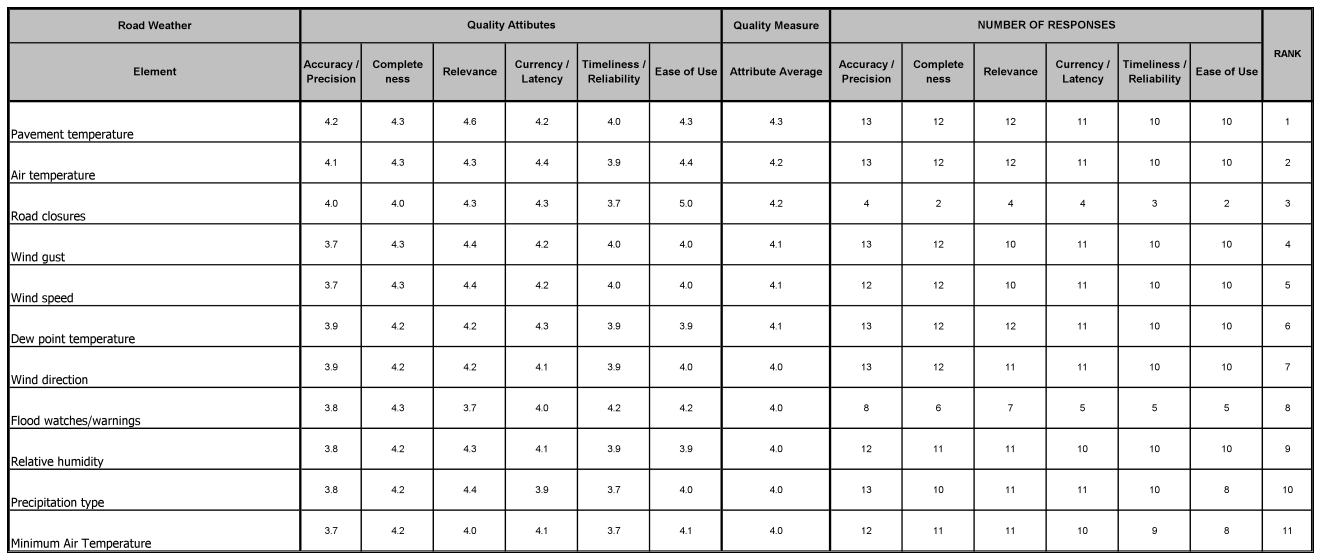
TREATMENT STRATEGY (2 of 4)
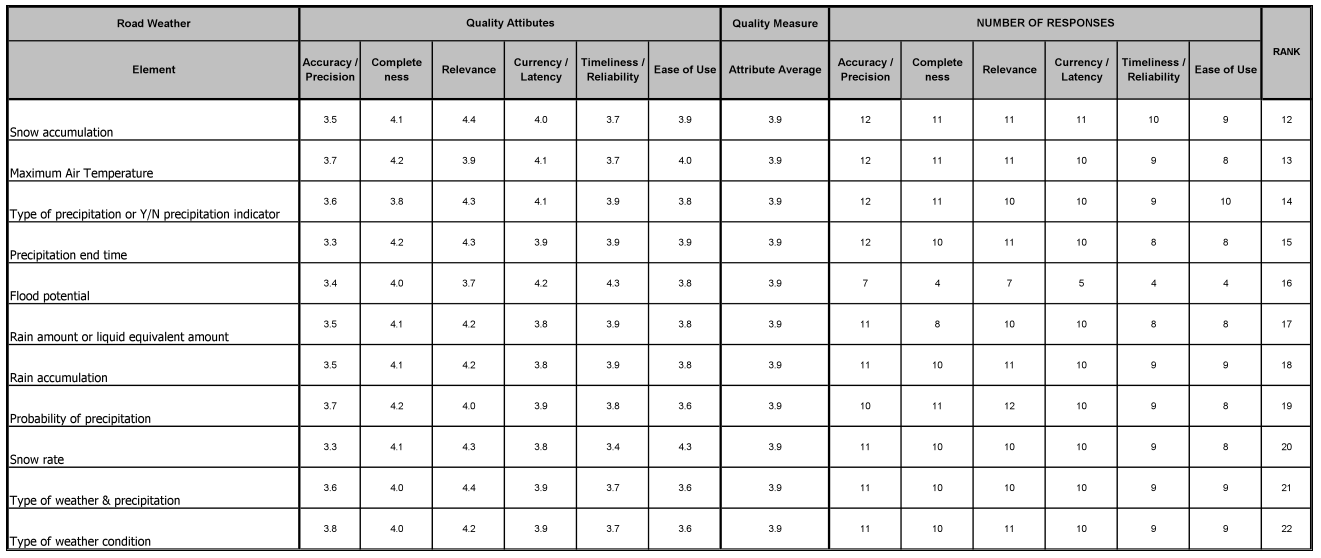
TREATMENT STRATEGY (3 of 4)
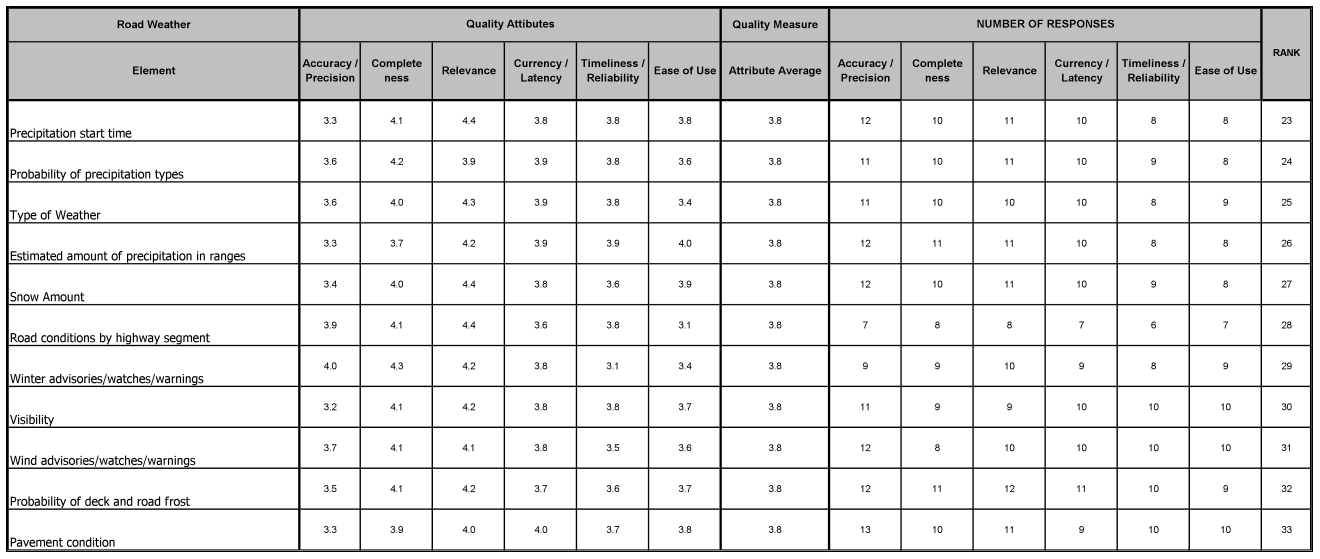
TREATMENT STRATEGY (4 of 4)
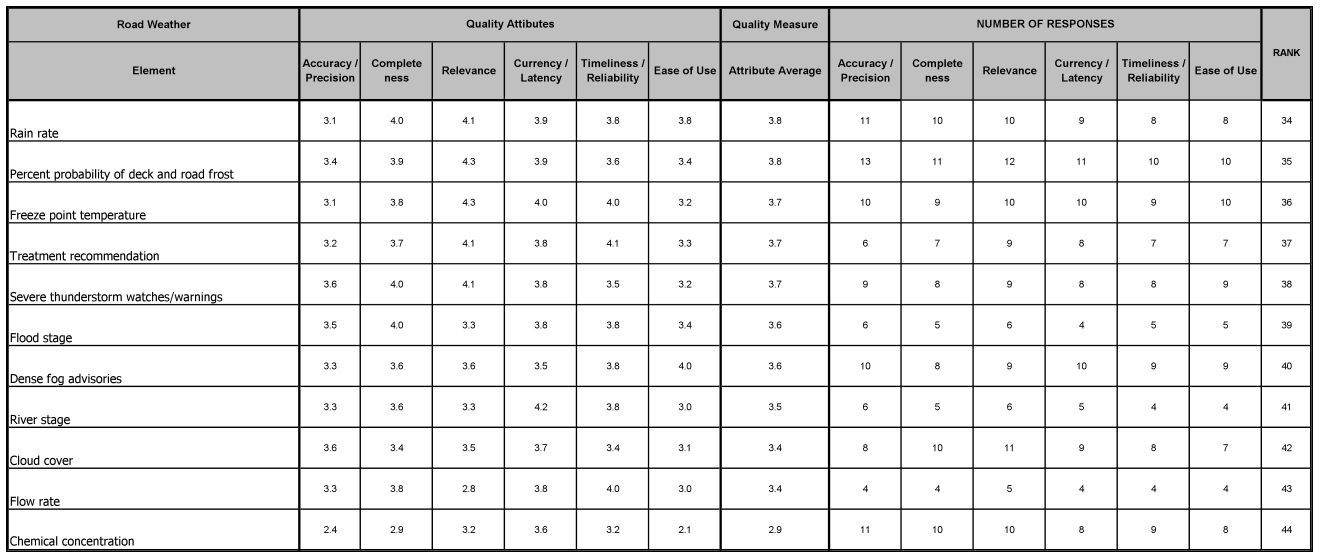
ADVISORY STRATEGY (1 of 1)
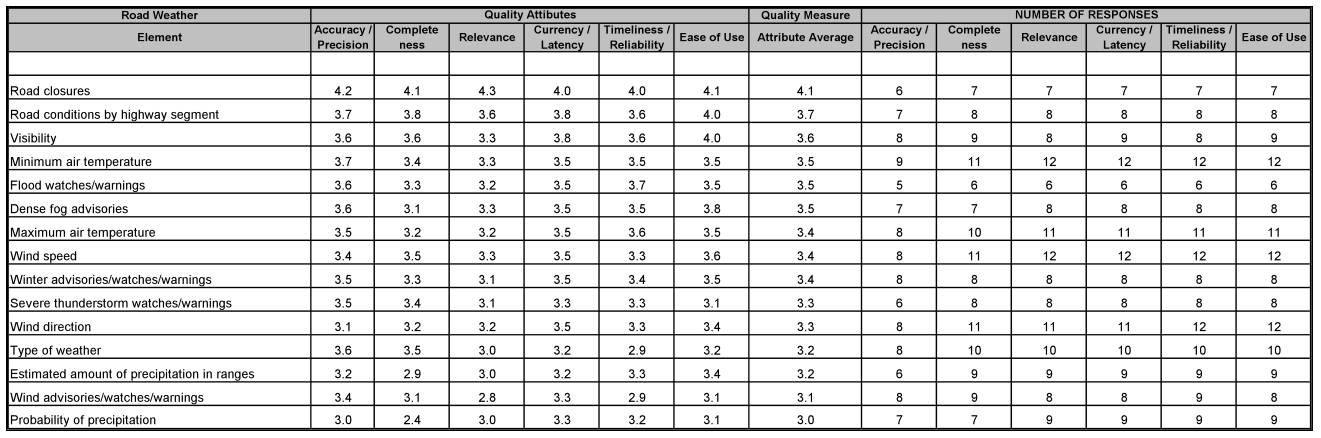
CONTROL STRATEGY (1 of 2)
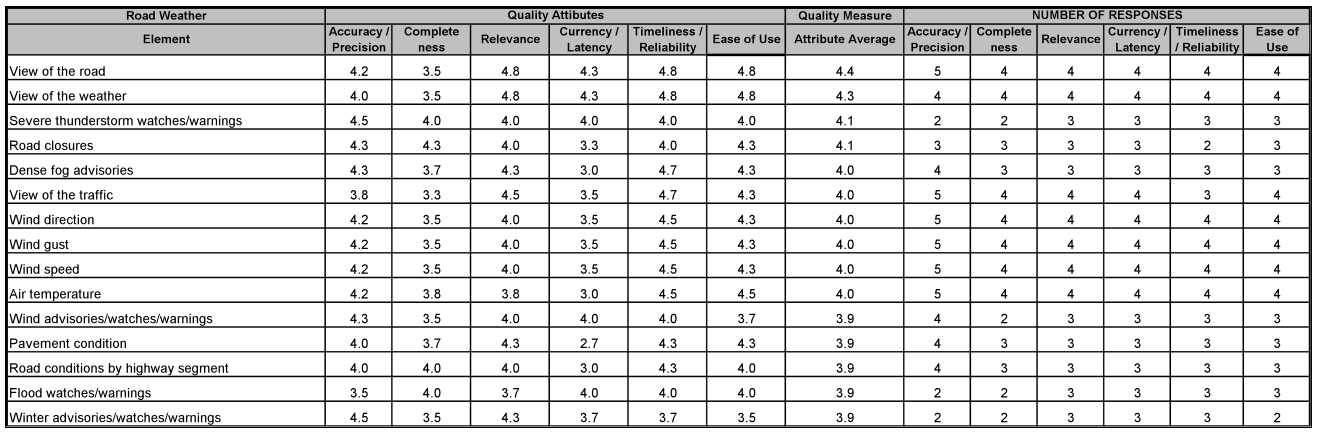
CONTROL STRATEGY (2 of 2)
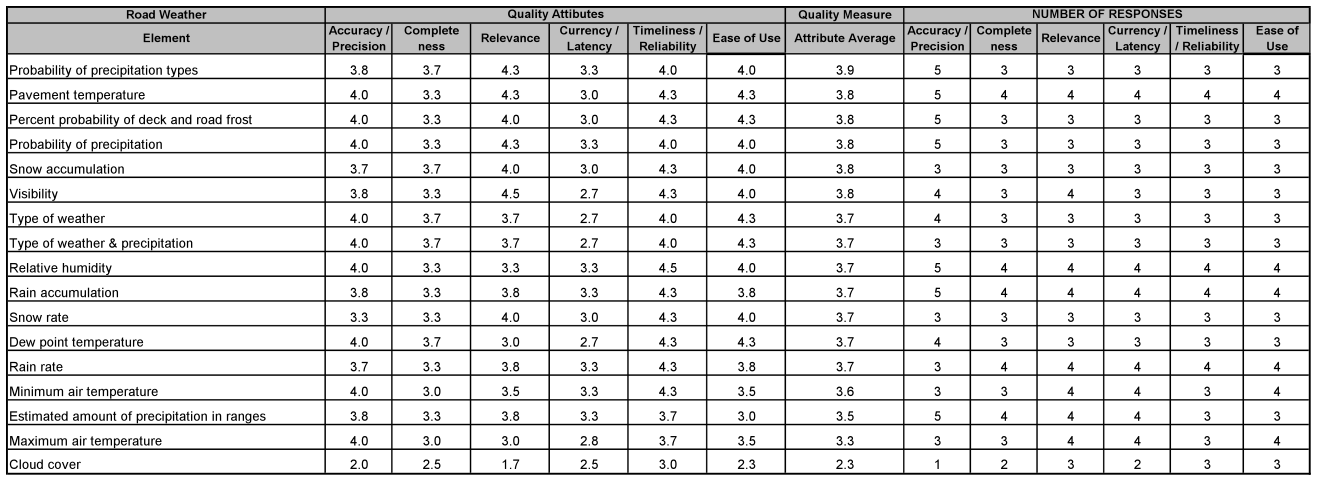
APPENDIX F: Stakeholder review results, discussion, and comments
Survey Responses
The survey was composed of twelve questions, nine of which were multiple-choice. Three questions requested free form text input, but the online survey permitted comments after each of the multiple-choice questions. This section presents the questions, the associated answers, and comments that were added after the multiple-choice questions. An assessment and evaluation of the responses is provided in a subsequent section.
Q1) How well did the quality attributes used in the study provide the desired characterization of road weather elements?
| Very Well | Well | Neutral | Poorly | Very Poorly | No Opinion | |
|---|---|---|---|---|---|---|
| Advisory | 2 | 5 | 1 | 0 | 0 | 1 |
| Control | 1 | 5 | 2 | 0 | 0 | 1 |
| Treatment | 1 | 6 | 1 | 0 | 0 | 1 |
Q1 Comments:
"Charts and graphs are very diffucult (sic) to understand. I can answer the questions but diffucult (sic) for the field folks on the front line."
"There needs to be more discussion of what is meant by Advisory, Control and Treatment Strategies, with some examples. On page 2 Figure 1 there needs to be an explanation of the abbreviations used under Road Weather Elements. On page 3 there is "Table Definitions", but I couldn't find Class or Scan Reference. Where are these used? Why was CLARUS not listed as a provider of information?
Q2) How well did the quality attributes used in the study provide the desired characterization of road weather products?
| Very Well | Well | Neutral | Poorly | Very Poorly | No Opinion | |
|---|---|---|---|---|---|---|
| Advisory | 2 | 4 | 2 | 0 | 0 | 1 |
| Control | 2 | 4 | 2 | 0 | 0 | 1 |
| Treatment | 1 | 5 | 2 | 0 | 0 | 1 |
Q2 Comments:
"What is the purpose? What are we trying to say here?"
Q3) Please provide comments on what you believe was overlooked in the characterization of current road weather information.
"Very good document that really doesn't say anything of value!"
Q4) Provide comments on the alternate methods that you believe would have provided better methods of quality attribute characterization of road weather information.
"Direct contact with highway maintenance workers."
"Phone surveys might have been used to make sure that answers to the survey were understood by the respondent and the questioner for quality assurance."
Q5) How well do the summary tables communicate the findings of the quality attribute characterization?
| Very Well | Acceptable | Poorly | |
|---|---|---|---|
| Road Weather Elements | 4 | 4 | 1 |
| Road Weather Products | 2 | 6 | 1 |
Q5 Comments:
"Make clear conclusions, state what is really meant!"
Q6) Recommendation: A survey instrument (similar to that used in the present study) should be developed and applied during the Federal fiscal year 2010.
| Yes | No | No Comment | |
|---|---|---|---|
| Is this recommendation appropriate? | 6 | 1 | 3 |
Q6 Comments:
"NOOOOOOOOOOO , needs to be simple and easy to understand!"
"I think there are too many parameters being surveyed. I would suggest condensing it down to the highest priority ones."
Q7) Recommendation: Subsequent stakeholder surveys and database updates should occur every two years for a period of no less than ten years.
| Yes | No | No Comment | |
|---|---|---|---|
| Is this recommendation appropriate? | 6 | 0 | 4 |
Q8) Recommendation: The monitoring process should be presented for open discussion at appropriate road weather community stakeholder meetings.
| Yes | No | No Comment | |
|---|---|---|---|
| Is this recommendation appropriate? | 8 | 0 | 1 |
Q8 Comments:
"The more discussion about the meanings of the terms the more representative the results will be."
Q9) Recommendation: A state of the quality of road weather information findings summary report should be prepared and distributed at the appropriate road weather community stakeholder meetings, as well as an electronic distribution to the road weather community as a whole.
| Yes | No | No Comment | |
|---|---|---|---|
| Is this recommendation appropriate? | 7 | 1 | 1 |
Q10) Would you be willing to participate in future road weather information characterization surveys?
| Yes | No | No Opinion |
|---|---|---|
| 7 | 1 | 2 |
Q11) Please provide additional recommendations for future road weather information characterization studies.
"This is a poor document written for an administrative level."
Q12) Please indicate the management strategy area(s) in which you are involved, ranking them from most to least involved.
| Most Involvement | Moderate Involvement | Least Involvement | |
|---|---|---|---|
| Advisory | 5 | 2 | 1 |
| Control | 0 | 6 | 1 |
| Treatment | 1 | 3 | 3 |