
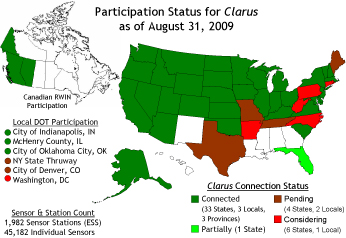
Since Clarus was introduced in 2004, interest in and use of the system has increased substantially. By May 31, 2009, 33 state departments of transportation (DOT), three local DOTs, and three Canadian provinces were contributing their Road Weather Information System (RWIS) Environmental Sensor Station (ESS) data to the Clarus System.
Many of these agencies that are shown in the map below and their road weather information providers monitor current road weather conditions via the Clarus System web site (http://www.clarus-system.com) and subscribe to Clarus System data in order to monitor field equipment, track approaching weather systems, and support operational decisions.
Success Stories
States that are using the Clarus system have positive stories to tell. Following are several examples of how state DOTs are using Clarus system data to improve their transportation operations.
| Clarus is the 21st Century’s answer to the need for timely, high- quality road weather information. Clarus collects weather observations from both weather and transportation sources and turns them into valuable road weather information. |
Iowa DOT
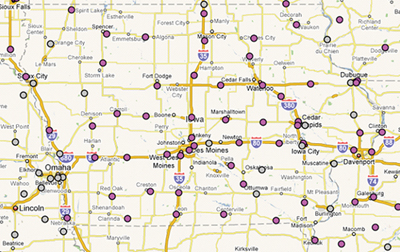
This map shows ESS in Iowa and bordering states. From the map interface, states can access the latest quality-checked data at each location.
The Iowa DOT has been part of the Clarus Initiative Coordinating Committee (ICC) since its inception in 2004. Iowa DOT uses observation data (e.g., pavement temperature) to support operations and utilizes quality checking flags to monitor sensor status and support maintenance and repair decisions that help operations managers direct maintenance crews.
Tina Greenfield, RWIS manager, noted “observed weather alerts from [neighboring states] was possible only after Clarus became available.” It makes the process of obtaining RWIS data easier, she said, because in the past, a state had to track information from a variety of web sites. By using data from surrounding states, weather information providers can create observed weather text alerts for Iowa DOT supervisors near the State border.
In the future, the Iowa DOT plans to integrate Clarus System data into their Weatherview web site. Researchers at the Iowa State University also archive and display ESS data from the Clarus System.
Illinois DOT
Clarus has been beneficial to the Illinois DOT which had previously used an antiquated DOS-based system to access ESS data. Through the Clarus Connection Incentive Program, the DOT was able to purchase a new server that decreased operating costs, increased data quality, and tremendously improved reliability.
These improvements resulted in more efficient operations in monitoring performance of their RWIS contractor. Illinois DOT representative Dean Kernan noted, “The Clarus System has definitely helped us with our snow and ice operations.” He indicated the Clarus System makes it easier for the DOT to share data with their RWIS provider.
Illinois is currently working with Iowa and Indiana on a cooperative interstate program that will use Clarus data to enhance traveler information as well as improve communication among the three states. The effort is part of the Aurora Pooled Fund Program, which brings together transportation agencies, universities, and weather services to integrate state-of-the-art road and weather forecasting technologies with coordinated, multi-agency weather monitoring infrastructures.
Alaska DOT & Public Facilities
Alaska DOT & Public Facilities representatives feel participating in Clarus Initiative Coordinating Committee (ICC) meetings has fostered sharing of ideas and approaches to quality assurance. Jack Stickel from the Department commends FHWA for taking a leadership role in developing the Clarus System, and indicates easy access to quality checking information on a real-time basis is a key benefit.
A real-time quality assurance program and effective performance measures program are important parts of the DOT’s overall Data Business Plan. The Alaska DOT&PF is the lead state for a planned Aurora Program (http://www.aurora-program.org) project that will use Clarus System data to develop a robust health-of-the-network web application as well as sensor and system performance reports.
The Alaska DOT&PF also plans to use Clarus System data during the upgrade of the Alaska-Canada Road Weather Portal, which will improve services required for a natural gas pipeline as well as natural resource and energy development around the Alaska-Canada Highway. Portal upgrades will include integrated traveler information systems, data delivery to trucking dispatch centers and transportation agency centers, integration of vehicle detectors and radio frequency identification with ESS to provide value-added services to commercial vehicle operators, enhanced road weather forecasting including flood and avalanche support, a seasonal weight restriction decision support tool, and non winter maintenance and construction decision support tools.
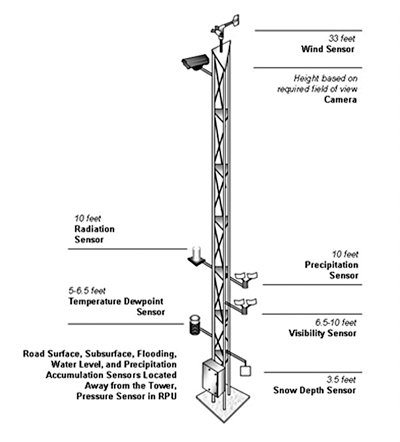
Clarus data is obtained from ESS that provide information on wind, precipitation, visibility, snow depth, temperature, radiation as well as information on the road surface and subsurface. A camera also allows users to see conditions in real time.
Virginia DOT
Personnel from the Virginia DOT access Clarus System data from around the State and surrounding states to track approaching weather systems. VDOT manager Gene Martin stated the Clarus System “has proved very useful to our operations folks.” DOT personnel utilize the Clarus System map to view observation data and use a subscription to retrieve quality checking flags. VDOT internal web sites also have embedded links to the Clarus System web site.
All of the DOT’s maintenance personnel are aware of the Clarus System and “have given very positive feedback.” “Clarus,” he said, “provides real-time data access for transportation agencies and their providers.“ and there are plans for VDOT’s road weather forecast provider to utilize the Clarus System to enhance forecasts.
Future Reports
The FHWA expects to document additional success stories and innovative uses of the Clarus System as more agencies begin to contribute data to the system and make use of the system’s observation data, metadata, and quality checking information. If you have a success story to share, please contact the U.S. DOT. For more information on the Clarus Initiative, visit http://clarusinitiative.org. To access the Clarus System, visit http://www.clarus-system.com/.
Paul Pisano
202-366-1301
E-mail: paul.pisano@dot.gov
Publication #: FHWA-JPO-10-005
EDL #: 14507