
PDF Version 2.38MB
NOTICE Comments on this report are welcome, and may be provided to the Evaluation Team in written form via email, fax or mail to: Mark Jensen |
TABLE OF CONTENTS
1.3 Institutional Benefits Evaluation
2.0 Riverside County Transit Demonstration Project System Description
2.1 Existing Computer-Aided Dispatching (CAD) Systems
2.1.1 Riverside Transit Agency
2.2 Proposed AVL/CAD-based ITS System
3.1 System Operational Performance and Customer Satisfaction Evaluation
3.1.1 Objective data collection and analysis
3.1.2 Subjective data collection and analysis
3.2 Institutional Benefits Evaluation
4.1 Survey Respondent Demographics
4.2 System Operational Performance
4.2.1 Objective Before System Performance Data
4.2.2 Subjective Before Survey Results
4.3.1. Objective System Performance Data
4.4 Institutional Benefits Evaluation
4.4.1 Institutional Processes “Before” Assessment
4.4.2 Procurement Processes “Before” Assessment
5.2 Deployment Plans and Schedule
Appendix A: baseline system performance datA
Appendix B: Evaluation “before” survey guidelines
Appendix C: Evaluation “BEFORE” Surveys
LIST OF TABLES
Table 1-1. Characteristics of Riverside County
Table 2-1. Potential Benefits of AVL Systems
Table 3-1. Data Required for the Fixed-Route Transit System Performance Evaluation
Table 3-2. Data Required for the Paratransit System Performance Evaluation
Table 4-1. Number of Survey Respondents by Transit Agency
Table 4-2. RTA Fixed-Route Objective System Performance “Before” Data*
Table 4-3. SunLine Fixed-Route Objective System Performance “Before” Data*
Table 4-4. RTA Paratransit Objective System Performance “Before” Data*
Table 4-5. SunLine Paratransit Objective System Performance “Before” Data*
LIST OF FIGURES
Figure 1-1. Riverside Transit Agency FTA National Transit Database 1999 Statistical Overview
Figure 1-2. SunLine Transit Agency FTA National Transit Database 1999 Statistical Overview
Figure 2-1. Existing System Architecture for RTA Operations
Figure 2-2. Existing System Architecture for SunLine Operations
Figure 2-3. RTA and SunLine Regional Server Concept
Figure 4-1. Passenger Perception of Fixed-Route Off-Schedule Performance
Figure 4-2. Passenger Perception of Paratransit Off-Schedule Performance
Figure 4-3. Driver Perception of Adequacy of Time Allowed to Complete Fixed Routes
Figure 4-4. Reasons for Delay on RTA Buses
Figure 4-5. Reasons for Delay on SunBuses
Figure 4-6. Driver Perception of Bus Idle Time During Fare Collection
Figure 4-7. Driver Perception of Waiting Time to Replace Broken-down Buses
Figure 4-8. Driver Perception of Frequency of Meeting Paratransit Pick-up Times
Figure 4-9. Reasons for Delay on Dial-a-Ride Vehicles
Figure 4-10. Reasons for Delay on SunDial Vehicles
Figure 4-11. Passenger Satisfaction with Fixed-Route Service at RTA and SunLine
Figure 4-12. Passenger Satisfaction with Paratransit Service at RTA and SunLine
Figure 4-13. Types of Information Passengers Would Like to Find Easily
Figure 4-14. Job Stress Ratings Reported by Fixed-Route Drivers at RTA and SunLine
Figure 4-15. Job Stress Ratings Reported by Paratransit Drivers at RTA and SunLine
1.0 Introduction
1.1 Overview
In 1999, the U.S. Congress earmarked funds for selected projects that were assessed as supporting improvements in transportation efficiency, promoting safety, increasing traffic flow, reducing emissions, improving traveler information, enhancing alternative transportation modes, building on existing ITS, and promoting tourism. A small number of these projects were selected for national evaluation. The Riverside County, California Transit ITS Demonstration was among the selected projects.
A team led by SAIC, under direction from the USDOT ITS Joint Program Office (JPO), was selected in January 2000 to develop and implement an evaluation of the Riverside County Transit ITS Demonstration Project. As part of the evaluation, a “before” assessment was necessary to establish a baseline to which future evaluation data could be compared. This report presents the results of this baseline assessment. The overall evaluation will continue through the end of 2002 and will gather data during and after deployment of the ITS technologies. These “during” and “after” data will be compared to the “before” data presented in this report. The evaluation timeframe will be divided into the following three periods:[1]
- “Before” – January 2001 through June 2002[2]
- “During” – July 2002 through October 2002
- “After” – Late 2002 (dates to be decided)
At the direction of the USDOT-JPO, this evaluation is intended primarily to be a Systems Impact Study that addresses system operational performance and customer satisfaction. In addition, an Institutional Benefits Evaluation will be performed to address the unique institutional arrangements and procurement methods that are being applied to this project. The overriding purpose of these evaluations is to determine whether the project goals are met, and to provide valuable information and lessons learned which can assist others across the nation who may be considering similar deployments.
The Riverside County ITS Demonstration project covers several ITS applications that have the potential to offer substantial benefits in operations productivity, customer service and traveler information. The major component of this project is an automatic vehicle location (AVL) and computer-aided dispatch (CAD) system. This system allows for real-time fleet monitoring, and promotes on-route/on-time performance, enhances customer information, and promotes safety. Secondary ITS applications include information connectivity to the regional commuter rail system to improve transit-to-transit transfers, and enhanced transit and traveler information available initially on the Internet, with regional kiosks to be added later.
Other ITS applications are being considered for inclusion in this deployment, and may come on line near the end of the evaluation period. These technologies include electronic fare payment technology using Smart Cards, a real-time maintenance monitoring system, and traffic signal priority for transit vehicles.
The emphasis of the project, however, is not on the individual technologies being deployed, but on the integration of these technologies. According to the partner’s project description, the demonstration is intended to “bundle the technologies into systemic applications and then integrate the systems into transit operations.” The primary purpose of this integration is to enhance service productivity, which can lead to substantial cost savings.
The ITS demonstration will be applied to the transit operations of both the Riverside Transit Agency (RTA) and the SunLine Transit Agency. RTA and SunLine are medium and small sized providers, respectively, which operate fixed route transit and demand responsive paratransit systems that encompass large geographic areas. They are the primary service providers in Western Riverside County and the Coachella Valley. Their service areas range from large urban areas adjacent to the regions most heavily traveled corridors, to rural communities separated by segments of open and undeveloped land.
The Riverside and SunLine Transit Agencies are the primary stakeholders in this demonstration project. Additional major stakeholders include the Southern California Association of Governments (SCAG) [3] and Riverside County Transportation Commission (RCTC).
SCAG is the MPO for the six county Greater Los Angeles region and has the responsibility for long-range transportation planning and regional development. Under SCAG, an organization called the Southern California Economic Partnership is responsible for the development and coordination of ITS deployments and integration in the region.
The RCTC oversees the Riverside and SunLine transit agencies, and acts as the funding agent for this project.
The current situation in Riverside County is common to many other urban areas in the United States. As detailed in Table 1-1, the population continues to grow quickly, with a corresponding increase in major congestion on the county’s streets and freeways. One way to reduce congestion is to reduce the number of single occupancy vehicles on the roadways and to encourage the use of public transportation. By offering enhanced services through the addition of these integrated technologies, Riverside County hopes eventually to increase transit ridership. However, in the short term, the county’s main goal is to use ITS technologies to make better use of the existing system to provide better service to an ever-growing base of transit users.
Table 1-1. Characteristics of Riverside County
Population in 1990 |
1,170,000 |
||
Population in 1999[4] |
1,530,000 |
||
Annual Rate of Population Growth |
2.35 % | ||
TTI U.S Metro Areas Congestion Ranking |
11th | ||
Percent of Single Occupancy Vehicles |
98 % | ||
Annual Person Hours of Delay (1997) |
45,885,000 |
||
Increase in Person Hours of Delay Since 1990 |
29.5 % | ||
Riverside Transit Agency
The Riverside Transit Agency (RTA), located in Riverside, California, began operation on March 17, 1977. RTA was formed through a joint-powers agreement between the county of Riverside and the incorporated cities within its service area. RTA has an 18-member board of directors comprised of elected officials from RTA’s 14 member cities and one county supervisor from each district. The annual operating budget for RTA is approximately $20 million.
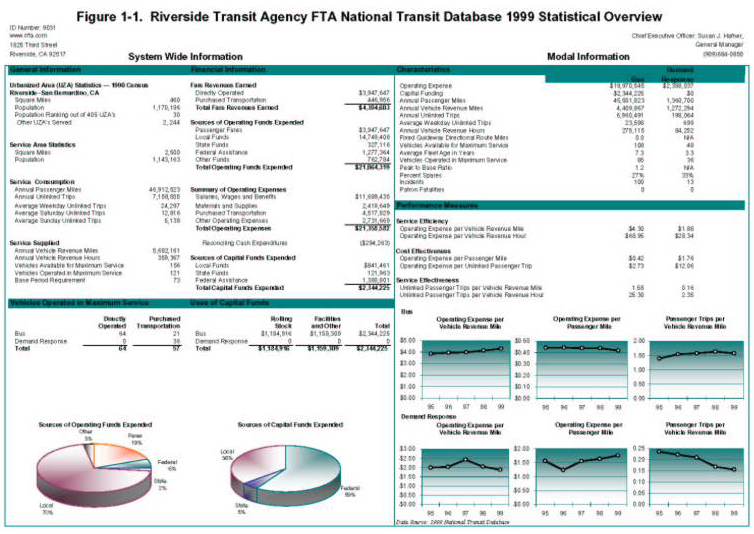
RTA currently operates a revenue fleet of 149 vehicles—108 fixed-route and 41 paratransit. These vehicles operate within a 2,500 square mile service area and annually provide 330,000 revenue hours and 5.2 million revenue miles of public transportation service in Western Riverside County. The average daily ridership is over 20,000 with more than 6.6 million passengers annually. Detailed statistics from the 1999 FTA National Transit Database[5] are presented in Figure 1-1 and provide an overview of RTA’s operations and system performance.
SunLine Transit Agency
The SunLine Transit Agency was also established in 1977 as a Joint Powers Authority, and operates public transit in the Coachella Valley of Riverside County. The agency has a ten member Board of Directors comprising a member from the County Board of Supervisors and elected officials from SunLine’s nine member cities.
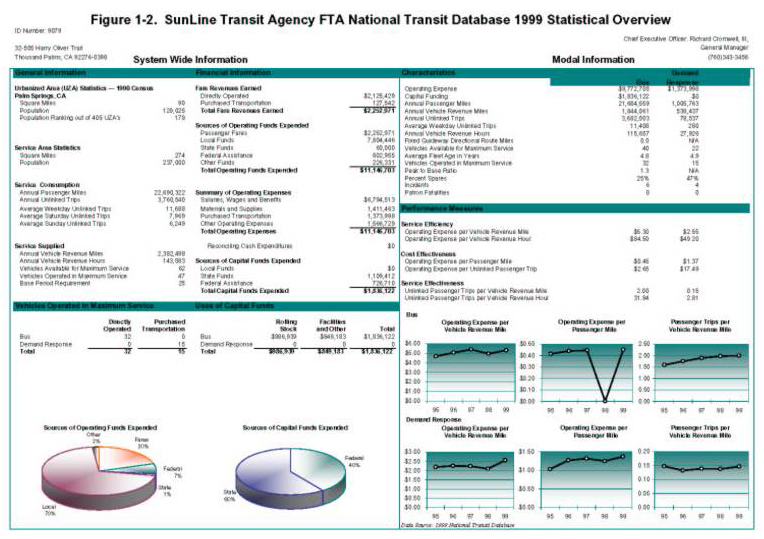
SunLine currently operates with, approximately, a $10 million dollar annual budget (approximately) and operates 60 vehicles—38 fixed-route and 22 paratransit—within a 410 square mile service area. The agency annually provides 55,000 revenue hours and 1.8 million revenue miles of public transportation service. Over the past five years, the agency’s ridership has increased an average of 7.7 percent per year. Detailed statistics from the 1999 FTA National Transit Database are presented in Figure 1-2 and provide an overview of SunLine’s operations and system performance.[6]
1.2 System Impact Study
The implementation of transit-related ITS systems has the potential to improve both the operational performance of a transit agency and the level of satisfaction experienced by the customers of that agency. The system impact study being conducted as part of this evaluation will examine the impact of the AVL/CAD deployment on the system operational performance and on customer satisfaction at RTA and SunLine. For this evaluation, customer satisfaction extends beyond the satisfaction of the passengers alone to examine also the satisfaction expressed by the agencies’ drivers and dispatchers. Agency drivers and dispatchers are important users of an AVL/CAD system and are, therefore, customers of the system. For both RTA and SunLine, system impacts are being evaluated for both the fixed-route/fixed-schedule services and the paratransit services.
The “before” evaluation reflected in this report establishes a baseline of system operational performance and customer satisfaction that will be used to evaluate the system impacts of the AVL/CAD technologies once they are deployed. Some of the expected benefits of AVL are increased overall dispatching and operating efficiency, more reliable service, and quicker response to service disruptions. The data received from AVL will be archived and can be used to optimize schedules and routes. Increasing dispatching and operating efficiency may lead to an increase in passenger miles carried. Fewer vehicles may be required to handle existing passenger loads, which would increase passenger trips per vehicle revenue mile. There are also expected benefits in security and safety with the additions of AVL – with AVL, authorities will know the exact location to send help if needed.
In monitoring vehicle locations, AVL promotes schedule adherence. If a bus fails to adhere to its schedule, the dispatching center will obtain this information in real-time, through AVL, enabling the dispatchers to respond quickly and appropriately to this knowledge. AVL can also enable transfers at jurisdictional boundaries to occur more efficiently, further promoting schedule adherence, when dispatch centers share information on vehicle locations and coordinate transfers accordingly.
As for paratransit operations, AVL will allow operators to know the exact location of the vehicles. This can assist operators in choosing which vehicle to send to a particular location and can also be used to provide information to passengers on the approximate arrival of a ride, if off schedule. For the paratransit dispatchers, algorithms in the CAD system will assist them in planning and assigning the optimum routes and pickups for the paratransit fleet. This planning and assigning can be done in real time. These capabilities can also allow for service expansion with an existing vehicle fleet.
With these benefits, it can reasonably be expected that an improvement in general customer satisfaction with fixed-route and paratransit services should be measurable after the deployment of the AVL/CAD system. In addition, the job satisfaction experienced by drivers and dispatchers should improve once the AVL/CAD system is operational. Information obtained by the AVL system is expected to be used by RTA and SunLine to provide real-time transit information to travelers through a regional ATIS provider, web sites, and later, a regional kiosk system. Web sites displaying the AVL-supplied data may include the regional Transtar transit information web site, the Traveler Advisory News Network (TANN) Southern California ATIS web site, and a new transit information web site developed by RTA. This real-time transit traveler information is another way in which customer satisfaction should improve as a result of the AVL/CAD system deployment.
1.3 Institutional Benefits Evaluation
The objective of this evaluation is to develop a qualitative “case study” of both the institutional processes and the procurement processes for this deployment. The goal of this evaluation will be to present benefits and lessons learned resulting from these processes.
For the evaluation of institutional processes, the focus will be on assessing the ITS deployment processes from an institutional viewpoint. Oftentimes, problems arising during a deployment are not only technical, but also institutional. It is important for agencies involved to communicate and reach agreements early in the deployment process so that obstacles can be overcome and enduring successful deployments can be realized. This project presents a unique opportunity to witness how a medium-sized transit agency and a small transit agency, with support from a large MPO, can work together to succeed in deploying a major regional transit ITS project. For the Institutional Benefits Evaluation, SAIC is examining the inter-jurisdictional relationships forged by the project.
For the evaluation of procurement processes, SAIC is conducting a qualitative case study analysis of the procurement processes involved in this deployment. Here, the two primary stakeholders in this deployment, RTA and SunLine, are working together on the system development. To keep costs down, the agencies are using the same system integrator (with RTA as the procurement lead agency) and a common database to manage information received from the AVL systems. A unique procurement process is being implemented in the contract between RTA and the system integrator (Iteris) such that the relationship is expected to be more like a “deployment partnership,” in contrast to the typical contractor-to-agency procurement relationship. To facilitate this case study, SAIC was invited by RTA and SunLine to be an active, impartial participant throughout the entire procurement process.
2.0 Riverside County Transit Demonstration Project System Description
2.1 Existing Computer-Aided Dispatching (CAD) Systems
2.1.1 Riverside Transit Agency
RTA currently uses an automated transit scheduling software system for its dispatching and scheduling needs. The software, developed by Multisystems, is called MIDAS-PT.[7] MIDAS-PT is a scheduling software system that features real-time, fully automated capabilities that include:
- Client registration
- Automatic geocoding
- Mapping
- Interactive batch trip scheduling
- Brokering for multiple carriers
- Dispatching
MIDAS-PT runs on a Microsoft Windows based graphical user interface application that is built upon a commercial Geographic Information System (GIS). The GIS platform used by MIDAS-PT is TransCAD® 3.0 from the Caliper Corporation.
The Windows version of MIDAS-PT has been in use since September 1995. MIDAS-PT software can combine paratransit/ADA service management with fixed-route telephone-based customer information within a common GIS environment. MIDAS-PT works well with assigning trips to vehicles while the customer is still on the telephone. The software allows the dispatcher to visualize one or more scheduling solutions in both a driver manifest and map display format. The dispatcher can accept the computer’s top choice or may negotiate with the customer to select the solution that best meets both the customer’s needs and the operator’s productivity objectives. MIDAS-PT is designed to handle advanced reservation trips and same day will-calls, add-ons, and cancellations.
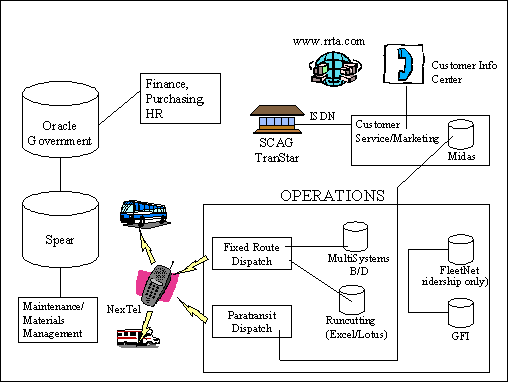
MIDAS-PT can automatically re-route vehicles based on an algorithm that considers the vehicle’s current location, schedule, and proximity to the potential pick-up. Schedule adherence is monitored through either mobile data terminals or radio communication of pick-up/drop-off times. It is unknown at this time to what extent RTA will be using mobile data terminals. Figure 2-1 shows a representation of the RTA system architecture as it exists before the ITS implementation.
Figure 2-1. Existing System Architecture for RTA Operations
2.1.2 SunLine Transit Agency
SunLine updates its routes and schedules manually at this time for its fixed-route/fixed-schedule service. However, SunLine uses software by Trapeze Software Group, Inc. to manage their paratransit services.
The software used by SunLine is called Trapeze Pass.[8] Trapeze Pass allows for effective and efficient management of routine tasks such as registering passengers, creating bookings, scheduling passengers to vehicles, dispatching vehicles and drivers, recording trip events, and geocoding locations. The system allows for manual or automatic scheduling of passengers. Trapeze allows the scheduler to check if passengers are eligible for programs such as the Americans with Disabilities Act (ADA).
Trapeze Pass can use AVL to view vehicles on a system map in real-time using global positioning system (GPS) technology. Trapeze can automatically reassign vehicles based on vehicle location and schedule adherence.
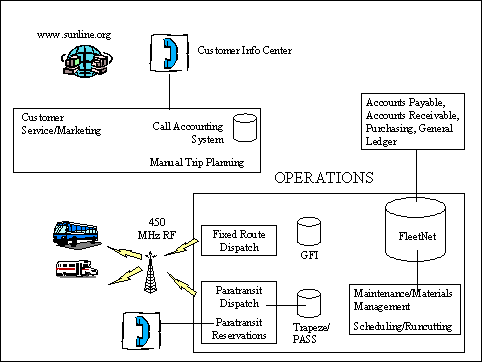
Figure 2-2 shows a representation of the SunLine system architecture as it exists before the ITS implementation.
Figure 2-2. Existing System Architecture for SunLine Operations
2.2 Proposed AVL/CAD-based ITS System
2.2.1 Introduction
Automatic vehicle location (AVL) systems are an assembly of technologies and equipment that permit a control facility automatic determination, display, and control of the position and movement of multiple vehicles throughout an appropriately instrumented area. Location is determined through automatic communication between the central control facility and the vehicle.
There are currently four methods for the automatic tracking of vehicles: LORAN C technology, signpost technology, dead reckoning, and global positioning systems (GPS). GPS is the most commonly used technology for AVL today. In order to use GPS, the vehicle must be equipped with a satellite receiver. The receiver scans the signals from at least three satellites to get its location. The location of the vehicle is then automatically sent to the central control facility where the location is then displayed on a map. GPS-based AVL systems are often supplemented with dead reckoning systems that use compass and odometer readings to maintain location references when the line of sight to GPS satellites is impaired by buildings or other obstacles.
The location of transit vehicles in the system is important in both demand-responsive and fixed‑route operations. For a fixed-route system, knowing the current locations of the vehicles can help drivers adhere to their schedules, and the information can also be relayed to inform passengers of delays or early departures. In a demand-responsive system, knowing the locations of the vehicles aids dispatchers in sending the vehicle with the most optimal route to the pick-up location. AVL provides real-time assistance in on-time pick-up and reduces passenger wait time. AVL can also track vehicles experiencing trouble and respond with assistance more quickly. Table 2-1 shows the anticipated system-wide benefits of AVL.
Table 2-1. Potential Benefits of AVL Systems [9]
Increased overall dispatching and operating efficiency |
|
Improve schedule adherence (on-time performance) |
|
More reliable service (travel and wait times) |
|
Increased transit system utilization |
|
Improve customer satisfaction |
|
Induce mode shift towards transit |
|
Reduce emissions and fuel consumption |
|
Quicker response to service disruptions |
|
Inputs to passenger information systems |
|
Increased driver and passenger safety and security |
|
Improve communications (decrease voice traffic on the radio) |
|
Inputs to traffic signal preferential treatment actuators |
|
Improve performance monitoring |
|
Increased capability in handling customer complaints |
|
More extensive and timely planning information collected at a lower cost |
Other agencies that have deployed automatic vehicle location systems have seen the following benefits:[10]
- Kansas City: response times to bus operator calls for assistance have been reduced to 3-4 minutes with AVL from 7-15 minutes previously; on-time performance improved from 80 percent to 90 percent after AVL; AVL produced reductions in scheduled running times, generating an estimated maintenance and operator cost savings of $400,000 annually.
- Milwaukee: on-time performance has improved from 90 percent to 94 percent after implementing AVL.
- Baltimore: 23 percent increase in on-time performance of buses with AVL.
- Winston-Salem: CAD/AVL paratransit system has decreased operating expense by 8.5 percent per vehicle mile and by 2.4 percent per passenger trip.
- London, Ontario: AVL system will provide schedule adherence on a continuing basis, thus saving the $40K to $50K previously spent on each schedule adherence survey.
Generally, for transit uses, the AVL system is linked to a computer-aided dispatch (CAD) system. CAD, with a human dispatcher in the loop, manages the data collected by AVL systems, manages communications, and is used to track the on-time status of each vehicle in a fleet. In demand-responsive applications, CAD, in concert with AVL, may locate the vehicle with the most optimal route to a particular destination. Most CAD systems also provide organizations with archiving and targeted retrieval of historical operating data.
2.2.2 System Overview
The Riverside County project includes installing a GPS-based AVL system on all fixed-route and paratransit vehicles at the two transit agencies. This includes 149 RTA vehicles and 60 SunLine vehicles. The AVL system will be integrated with the existing CAD systems. A common hardware/software platform is being used to allow for additional functionality to be added in the future – for example, the on-bus “control head” is being designed to be able to integrate with a future automated fare payment/Smart Card system, and a real-time maintenance monitoring system.
Once complete, the system will provide continual real-time information on the fixed-route and paratransit vehicles through a common database in a regional server accessible by each of the two dispatch centers. This real-time information can be used to improve system efficiency and operations. Eventually, the integrated RTA and SunLine operations will expand to include such external systems as an advanced traveler information system. External systems will access the regional server through the Internet. Figure 2.4 shows the concept of the integrated RTA and SunLine regional server.
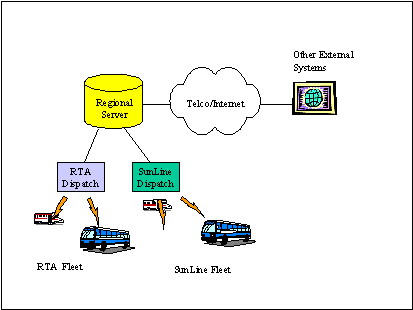
Figure 2-3. RTA and SunLine Regional Server Concept
There are at least four areas that the AVL system will directly impact:
- Improved system efficiency
- Inter-jurisdictional transfers
- Emergency evacuation
- Traveler information
Improved System Efficiency With the information received and archived from the AVL system, the transit managers can optimize their schedules/routes, decide to increase or decrease the number of vehicles on the street, and improve their system operational performance. Additionally, with an AVL/CAD system, paratransit dispatchers will be able to optimize the use of their fleet in real time, which should translate into increased service with the same fleet of vehicles.
Interjurisdictional Transfers AVL will assist RTA and SunLine in coordinating their services with MetroLink (a commuter rail system in Southern California) to better serve passengers who transfer from the train to buses, thus potentially reducing wait times. Interjurisdictional bus transfers will be aided by the existence of a common database containing real-time information on vehicle locations in each of the fleets. If this real-time information is used properly, the wait time normally associated with such transfers will be reduced.
Emergency Evacuation RTA and SunLine will also use information from AVL to integrate with emergency services to aid in evacuations during emergencies. For example, in a large earthquake, the transit vehicle fleet could be required for evacuations or other emergency services – AVL/CAD will allow for a much more effective use of these transit vehicles.
Traveler Information The real-time data collected from AVL will allow follow-on ITS deployments to provide travelers with Internet- and Kiosk- based information on schedule adherence, bus pickup times, and bus arrival times.
Additionally, near the end of, or after, the evaluation timeframe, there are two areas that the AVL/CAD deployment could affect:
- Maintenance monitoring
- Automated fare payment
Maintenance Monitoring RTA and SunLine have plans in the 2002-2003 timeframe to deploy an interface between the AVL Control Head and the bus Engine Diagnostics System, which would allow for real-time maintenance monitoring of all buses in the fleet. This would allow for more effective preventive maintenance, and also for providing warnings on critical engine/bus failures before they happen.
Automated Fare Payment RTA and SunLine are contemplating the development of an automated fare payment/Smart Card system sometime in the 2002-2003 timeframe. This system will likely be deployed in cooperation with a system that is now being considered by MTA for the Los Angeles region. The AVL Control Head for this project is being designed to allow for future connectivity to this system.
2.2.3 Participants and Users
The main participants and the primary users of the AVL/CAD system will be RTA and SunLine. However, all agencies bordering with RTA and SunLine will be permitted to use the database of information collected by the system. However, coordination with these other agencies will likely not take place until after the evaluation time period.
The system users at the agency level will be the bus drivers, dispatchers and operations personnel. The end-users of the system are the members of the regional public population that use the transportation services provided by RTA and SunLine.
2.2.4 Schedule
Initial deployment of the AVL system will be completed by summer of 2002, with full deployment to be completed in fall of 2002. The Internet traveler information web site and other Internet linkages are expected to be deployed sometime in late 2002. However, the maintenance monitoring system and the automated fare payment/Smart Card will not be deployed until after the end of the evaluation timeframe in 2003.
3.0 Methodology OVERVIEW
The methodologies described in this section were first developed at a high level in the Evaluation Plan, and then at a more comprehensive level (for the System Operational Performance Study) in the Detailed Test Plan. These documents may be obtained by contacting SAIC directly as detailed on page i:
- Riverside County Transit ITS Demonstration Project Final Evaluation Plan, Mark Jensen, SAIC, for the USDOT-JPO, February 15, 2001
- Riverside County Transit ITS Demonstration Project: System Operational Performance Study Detailed Test Plan, Kate Chen, SAIC, for the USDOT-JPO, May 1, 2001
The Detailed Test Plan document contains more detailed information than is presented in this document concerning the specific technical approaches that are being implemented for this evaluation. The Evaluation Plan document contains more background information as well as a discussion of the management approaches being utilized by SAIC in this effort. Both of these documents should be considered significant evaluation references that should be accessed alongside this Phase II Final Report.
3.1 System Operational Performance and Customer Satisfaction Evaluation
For the “before” evaluation, system operational performance data and customer satisfaction data were collected. These data were collected through objective and subjective means. Objective data were provided by RTA and SunLine in the form of system performance records. Subjective data were collected through surveys of drivers, passengers, and dispatchers to identify user perceptions of system performance. Discussion in this report of subjective data will focus on passenger and driver feedback. A handful of dispatchers provided generally anecdotal feedback in response to the survey. Their responses will be discussed in the Phase III report once additional dispatcher feedback is collected during the “after” evaluation.
3.1.1 Objective data collection and analysis
In support of this evaluation, objective data on system operational performance were collected by both RTA and SunLine throughout the “before” evaluation timeframe. These data will continue to be collected throughout the remainder of the evaluation timeframe in order to compare “before,” “during,” and “after” data during Phase III of this evaluation. The objective data collected during the “before” evaluation include a variety of operational statistical data, such as on-time performance, that the agencies already collect. The objective data address mainly the system performance at each agency, although customer satisfaction may be reflected in some of the objective variables (e.g., number of passenger complaints).
The Evaluation Team has been working with RTA and SunLine to gather appropriate “before” operational performance data. Some of the “before” data were available in RTA’s and SunLine’s monthly or quarterly reports, which are being collected in this evaluation from January 2001 through the end of the evaluation timeframe in late 2002. Other data are being specially compiled by RTA and SunLine for this evaluation. The actual data collected by RTA and SunLine are presented in Appendix A.
Table 3-1 lists the complete set of data that has been provided for the fixed-route transit system.
Table 3-1. Data Required for the Fixed-Route Transit System Performance Evaluation
Datum Provided |
Field Name in Source Document |
Agency Data Source |
Number of late/early departures |
“number late,” “number ahead,” “percent late,” “percent ahead” |
RTA Monthly Report |
“percent trips on-time” |
SunLine Quarterly Report |
|
Number of passenger miles carried |
no existing field-to be collected |
RTA separate collection |
“passenger miles” |
SunLine Quarterly Report |
|
Operating expense per passenger mile |
no existing field-to be collected |
RTA separate collection |
“total operating expenses” / ”passenger miles” |
SunLine Quarterly Report |
|
Passenger trips per vehicle revenue mile |
“passengers/revenue miles” |
RTA Quarterly Report |
“passengers/revenue mile” |
SunLine Quarterly Report |
|
Emergency and breakdown response time |
no existing field-to be collected |
RTA separate collection |
no existing field-to be collected |
SunLine separate collection |
|
Number of vehicles |
no existing field-to be collected |
RTA separate collection |
derived from Short Range Transit Plan |
SunLine Short Range Transit Plan |
|
Number of routes |
derived from monthly report |
RTA Monthly Report |
derived from ridership report |
SunLine Monthly Report |
|
Number of passengers carried |
“passengers” |
RTA Quarterly Report |
all fields in ridership report |
SunLine Monthly Report |
|
Number of passenger complaints |
no existing field-to be collected |
RTA separate collection |
“valid passenger complaints” |
SunLine Quarterly Report |
Table 3-2 lists the complete set of data that has been provided for the paratransit system.
Table 3-2. Data Required for the Paratransit System Performance Evaluation
Datum Provided |
Field Name in Source Document |
Agency Data Source |
Number of passengers per hour |
“passengers per hour” |
RTA Performance Standards Report |
no existing field-to be collected |
SunLine separate collection |
|
Number of passenger miles carried |
no existing field-to be collected |
RTA separate collection |
“passenger miles” |
SunLine Quarterly Report |
|
Operating expense per passenger mile |
no existing field-to be collected |
RTA separate collection |
“total operating expenses” / ”passenger miles” |
SunLine Quarterly Report |
|
Passenger trips per vehicle revenue mile |
“passengers/revenue miles” |
RTA Quarterly Report |
“passengers/revenue mile” |
SunLine Quarterly Report |
|
Number of vehicles |
no existing field-to be collected |
RTA separate collection |
derived from Short Range Transit Plan |
SunLine Short Range Transit Plan |
|
Number of passengers carried |
“passengers” |
RTA Quarterly Report |
all fields in ridership report |
SunLine Monthly Report |
|
Number of passenger complaints |
no existing field-to be collected |
RTA separate collection |
“valid passenger complaints” |
SunLine Quarterly Report |
Initial AVL/CAD system deployment is planned to begin in July 2002 and end in October 2002. RTA and SunLine anticipate that the initial deployment may affect only certain bus routes or paratransit lines. Future deployments are planned to integrate all routes into the AVL/CAD system. As much as possible, system performance “before” data are being collected for each route so that future before-after comparisons can be made specifically for the routes affected by the deployment.
3.1.2 Subjective data collection and analysis
Subjective data provide valuable insight into user perceptions of system impacts. Measuring the subjective responses of AVL/CAD system users is as important as measuring the objective impacts on operations and performance. For example, whether or not the objective data show improved schedule adherence, it is useful to know whether passengers perceive schedule adherence to be improved. Passenger perceptions of on-time performance can do as much toward affecting ridership, for example, as the actual on-time performance can. Similarly, the efficiency with which dispatchers can locate transit or paratransit vehicles may objectively be improved through the use of AVL/CAD technologies—increasing on-board safety; however, if drivers perceive that their on-board safety has not improved due to the AVL/CAD system then the system’s benefits are not being fully exploited. Further training or driver education may be appropriate.
To gather subjective data for this report, “before” surveys were distributed to drivers and passengers within the fixed-route and paratransit systems at RTA and SunLine. These surveys, developed through a series of working meetings with survey and transit experts from the Evaluation Team and from RTA and SunLine, were distributed on-board the transit agency vehicles and at the agencies’ headquarters. The surveys were identical for the two agencies, except in their use of agency-specific terms like “RTA buses” and “SunLine buses.” Spanish surveys were available for Spanish-speaking passengers. Survey guidelines were available to facilitate standardized distribution and collection procedures during survey implementation. These guidelines, which are shown in Appendix C, provided instruction on the sampling criteria, required materials, and step-by-step procedure for the survey effort.
Appendix D contains the surveys used to gather subjective data on the aspects of system performance and customer satisfaction that would likely be affected by the AVL/CAD system deployment. Four types of surveys were distributed:
- RTA bus drivers
- RTA passengers (riders)
- SunLine bus drivers
- SunLine passengers (riders)
Passenger surveys included questions such as:
- In your experience, how frequently do buses run on schedule?
- How many days in advance do you typically schedule an appointment with Dial‑a‑Ride/SunDial?
- When buses are not running on schedule, by how many minutes are they typically early or late?
- How much time does it typically take you to complete a one-way trip on the bus?
Driver surveys included questions such as:
- Does the bus schedule allow you enough time to complete your route(s) on schedule?
- For a total of about how much time in a typical shift is your paratransit vehicle empty?
- When your bus breaks down, how long does it typically take until a replacement bus arrives?
- How frequently are you able meet your pickup times?
For Phase II, “before” survey data were examined using descriptive statistics. Measures of central tendencies (e.g., mean, median, and mode) and frequencies of responses were generated to reflect the subjective experiences of passengers and drivers. For ease of reporting, some survey scales were inverted during analysis.
During Phase III of this evaluation, the “before” data will be compared to the “after” data using both descriptive statistics and inferential statistical tests such as Pearson’s R correlations, t-tests, and analyses of variance to represent the impacts of the AVL/CAD system deployment.
3.2 Institutional Benefits Evaluation
The Institutional Benefits Evaluation provides an opportunity to study the inter-jurisdictional relationship shared by RTA and SunLine. Such an evaluation also allows for examination of the unique procurement process used by the agencies to deploy the ITS technologies in their region. To facilitate the institutional benefits evaluation, the Evaluation Team has participated as impartial observers throughout the “before” period of the ITS Demonstration project. In addition to monitoring the progress of the project through regular meetings with RTA and SunLine, the SAIC team interviewed agency staff regarding institutional issues and lessons learned. A questionnaire related to institutional issues was developed and distributed to the following three primary stakeholders, who returned written responses/comments to the Evaluation Team:
- Jay Peterson, Riverside Transit Agency (RTA)
- Kerry Forsythe, SunLine Transit Agency
- Bob Huddy, SCAG/Southern California Economic Partnership
Mr. Bob Huddy of SCAG is an advisor from the regional MPO for this project.[11] Mr. Huddy is providing procurement and institutional advice to the implementation Project Mangers for this project, Mr. Jay Peterson[12] at RTA and Mr. Kerry Forsythe at SunLine.
During the “before” time period, SAIC staff followed the progress of the system integrator contract procurement process by attending the contractor oral presentations in December 2000 and the BAFO decision-making meeting in January 2001. Since the award of the systems integrator contract, SAIC has attended several monthly meetings with the system integrator, agencies, and project partners (e.g., SCAG) for contract activity updates.
4.0 Results
The following presents the results of the “before” data collection to date and the subsequent analysis of these results. The results presented here are primarily focused on the subjective survey analysis effort described in Section 3, which supports both the system operational performance and the customer satisfaction components of the system impacts study. Additionally, a discussion of the objective system performance data collection effort, with examples of data being collected, is presented. Finally, the before institutional benefits case study analysis results are presented.
4.1 Survey Respondent Demographics
“Before” surveys were collected from 1,001 bus passengers, 156 paratransit passengers, 188 bus drivers, and 54 paratransit drivers. Although the numbers of respondents in the driver samples were lower than the number of passenger respondents, the driver samples included nearly the entire population of drivers at the two agencies. The data provided by the drivers are, therefore, representative of the current driver populations at each agency.
Table 4-1 presents the number of respondents included in the samples for each transit agency. Because RTA is a larger transit agency, with greater passenger volumes, it is not surprising that RTA’s samples were generally larger than SunLine’s.
Table 4-1. Number of Survey Respondents by Transit Agency
Type of Sample |
RTA |
SunLine |
Bus Passengers |
742 |
259 |
Paratransit Passengers |
115 |
41 |
Bus Drivers |
140 |
44 |
Paratransit Drivers |
37 |
17 |
4.1.1 Fixed-Route Passengers
On both RTA and SunLine buses (SunBus), approximately 55 percent of the passengers responding to the survey identified themselves as female, 45 percent as male. The average age of all bus passengers was 34, with RTA respondents ranging in age from 12 to 86 and SunBus respondents ranging from 11 to 78 years of age. On RTA buses, 14 percent of respondents completed the survey using a Spanish version of the survey; on SunBuses, 18 percent used Spanish versions.
Most respondents indicated their fare category as General (65 percent on RTA, 60 percent on SunBus). The second most reported fare category was Student/Youth (14 percent on RTA, 25 percent on SunBus), with Disabled (11 percent on both RTA and SunBus) and Senior rounding out the response categories reported (10 percent on RTA, five percent on SunBus).
On average, respondents reported having ridden buses for about four-and-a-half years. However, there was great variation in the number of years of bus riding reported by the respondents. RTA’s passenger respondents indicated that they have ridden buses for time periods ranging from less than one month to 56 years. SunBus passengers reported less than one month of riding, up to nearly 27 years of riding.
When asked why they ride the bus, passengers at both RTA and SunLine offered similar responses. Not surprisingly, some passengers offered several reasons for riding the bus. Just over half of respondents indicated that they ride the buses to go to work. Forty percent ride the bus to go shopping and 33 percent to go to school. Just under 30 percent of respondents offered various other reasons, including visiting friends and going to the doctor’s office. Buses are used for these trips despite the fact that 65 percent of RTA riders and 36 percent of SunBus riders have access to a car or motorcycle at home.
RTA passengers take an average of 10 one-way trips on the bus per week. SunBus passengers average about nine one-way trips per week. Approximately 50 percent of RTA and SunBus passengers predicted that they will use buses about as often next year as they do now. Roughly one-quarter reported that they will use buses less often next year and one-quarter expects to use them more often.
Respondents had the opportunity to write their contact information on the survey so they could be directly contacted for the “after” survey. Seventy percent of RTA passengers provided the information, as did 62 percent of SunBus passengers.
4.1.2 Paratransit Passengers
Paratransit passengers tended to be older, in general, than fixed-route passengers. RTA’s Dial‑a‑Ride (DAR) passengers averaged 55 years of age, while SunLine’s SunDial passengers averaged 68 years old. Although passengers ranged in age from 15 to 95 for DAR and 31 to 92 for SunDial, most passengers were over the age of 55.
DAR and SunDial passengers reported that, on average, they have used the paratransit system for about four years. DAR riders take an average of 16 one-way trips per month, while SunDial riders take an average of 11 one-way trips per month.
Thirty percent of DAR riders reported that they have access to a car or motorcycle, while only five percent of SunDial riders reported having a car or motorcycle. The majority of DAR and SunDial riders (56 percent and 72 percent, respectively) indicated that they would use the paratransit system about as often next year as they do now. Forty percent of DAR passengers and 24 percent of SunDial passengers predicted that they will use the paratransit system more often next year, while less than five percent at either agency expect to use it less often.
As with the fixed-route passenger sample, most of the paratransit passengers provided their name and address information so they can be contacted directly for the “after” survey. Sixty-four percent of DAR passengers gave this information, as did 72 percent of SunDial passengers.
4.1.3 Fixed-Route Drivers
Sixty-five percent of RTA bus driver respondents were male, 35 percent were female. Among the SunBus driver respondent population, 81 percent were male and 19 percent were female.
RTA bus drivers reported having an average of six years’ experience driving RTA buses, with responses ranging from one month to 24 years. SunBus drivers averaged nine years of experience driving buses at SunLine, with responses ranging from six months to 24.5 years.
4.1.4 Paratransit Drivers
Among the RTA DAR driver respondents, 44 percent were male and 56 percent were female. At SunLine, 71 percent of SunDial drivers were male and 29 percent were female.
DAR drivers reported an average of three years’ paratransit driving experience, with responses ranging from one month to just over 17 years. SunDial drivers averaged four years of paratransit experience, with responses ranging from four months to nine-and-a-half years.
4.2 System Operational Performance
4.2.1 Objective Before System Performance Data
Available “before” statistics reflecting passenger volumes, revenue generation, and on-time performance were collected from both RTA and SunLine consistent with the data collection effort described in Section 3.1.1. Tables 4-2 and 4-3 present the objective system performance data collected on the fixed-route systems at RTA and SunLine. As stated in section 3.1.1, the actual data collected by RTA and SunLine for their fixed-route operations are presented in Appendix A. The data reflect the January through June 2001 timeframe. These data will be compared to “during [deployment]” and “after [deployment]” data to identify any changes in system operations that occur once the AVL/CAD technologies are deployed. For example, during the “before” period, RTA and SunLine demonstrated “percent on-time” statistics in the low to mid-nineties. While these are fairly high percentages, they indicate that during the “before” period over one hundred buses each month did not arrive at their passenger pick-up locations on time. It is reasonable to expect that improvement will be seen in on-time performance with the deployment of the AVL/CAD systems, and that the “after” percentages for “percent on-time” will exceed the “before” percentages.
Table 4-2. RTA Fixed-Route Objective System Performance “Before” Data*
Performance Measure |
Available by Line/Route |
Third Quarter (Jan.-March) |
Fourth Quarter (April-May) |
Percent on-time |
Yes |
93% |
92% |
Percent late |
Yes |
5% |
6% |
Percent ahead |
Yes |
1% |
2% |
Number of passenger miles carried |
No |
9,334,890 mi |
11,466,880 mi |
Operating expense per passenger mile |
No |
$0.64 |
$0.56 |
Passenger trips per vehicle revenue mile |
Yes |
1.17 trips |
1.26 trips |
Emergency and breakdown response time |
No |
5-10 min |
5-10 min |
Number of vehicles |
No |
112 |
112 |
Number of routes |
N/A |
37 |
37 |
Number of passengers carried |
Yes |
1,612,674 |
1,747,020 |
Number of passenger complaints |
No |
316 |
291 |
* Data reflect FY2001, 3rd and 4th Quarters (January – June 2001).
Table 4-3. SunLine Fixed-Route Objective System Performance “Before” Data*
Performance Measure |
Available by Line/Route |
Third Quarter (Jan.-March) |
Fourth Quarter (April-May) |
Percent on-time |
Yes |
95% |
96% |
Number of passenger miles carried |
No |
6,077,135 mi |
5925736 mi |
Operating expense per passenger mile |
No |
$0.56 |
$0.54 |
Passenger trips per vehicle revenue mile |
Yes |
1.78 trips |
1.79 trips |
Number of vehicles |
No |
52 |
52 |
Number of routes |
N/A |
13 |
13 |
Number of passengers carried |
Yes |
984,836 |
965,253 |
Number of passenger complaints |
No |
109 |
97 |
* Data reflect FY2001, 3rd and 4th Quarters (January – June 2001).
Tables 4-4 and 4-5 present the objective system performance data for the paratransit systems at RTA and SunLine during the January through June 2001 timeframe. Appendix A provides the actual data collected for the paratransit systems for RTA and SunLine operations.
Table 4-4. RTA Paratransit Objective System Performance “Before” Data*
Performance Measure |
Available by Line/Route |
Third Quarter (Jan.-March) |
Fourth Quarter (April-May) |
Number of passengers |
Yes |
56,484 |
60,823 |
Number of passengers per hour |
Yes |
2.18 |
2.22 |
Number of passenger miles carried |
No |
420,806 mi |
417,854 mi |
Operating expense per passenger mile |
No |
$2.46 |
$2.88 |
Passenger trips per vehicle revenue mile |
No |
0.14 trip |
0.13 trip |
Number of vehicles |
No |
45 |
45 |
Number of passenger complaints |
No |
29 |
44 |
*Data reflect FY2001, 3rd and 4th Quarters (January – June 2001).
Table 4-5. SunLine Paratransit Objective System Performance “Before” Data*
Performance Measure |
Available by Line/Route |
Third Quarter (Jan.-March) |
Fourth Quarter (April-May) |
Number of passengers |
Yes |
28,286 |
27,325 |
Number of passengers per hour |
Yes |
2.46 |
2.49 |
Number of passenger miles carried |
No |
629,160 mi |
556,429 mi |
Operating expense per passenger mile |
No |
$0.84 |
$1.10 |
Passenger trips per vehicle revenue mile |
No |
0.10 trip |
0 |
Number of vehicles |
No |
25 |
25 |
Number of passenger complaints |
No |
28 |
47 |
* Data reflect FY2001, 3rd and 4th Quarters (January – June 2001).
System performance “before” data for all routes, such as those highlighted above in Tables 4-2 through 4-5 are being collected so that during Phase III of the evaluation, before-after comparisons can be made specifically for the routes affected by the deployment.
4.2.2 Subjective Before Survey Results
4.2.2.1 Passenger Perception of System Performance
Fixed-route and paratransit passengers at both agencies provided feedback on their perceptions of and experiences with various aspects of system performance.
Fixed-Route Passengers
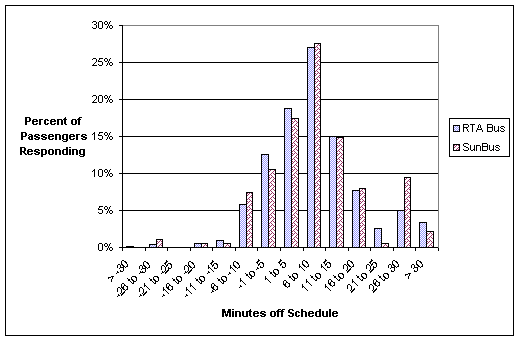
At both agencies, most fixed-route passengers reported that buses frequently or almost always run on schedule (reported by 58 percent of RTA riders and 62 percent of SunBus riders). Only about 12 percent of passengers at each agency reported that buses rarely or almost never run on schedule. Passengers commented on the nature of off-schedule occurrences when they do happen. Nineteen percent of RTA riders marked that buses usually run early (by an average of eight minutes, standard deviation of six minutes). Sixty-three percent of RTA riders reported that buses usually run late (by an average of 14 minutes, standard deviation of 12 minutes). At SunLine, 19 percent of passengers indicated that buses usually run early (by an average of eight minutes, standard deviation of seven minutes). Sixty-six percent of SunBus passengers reported that buses usually run late (by an average of 14 minutes, standard deviation of nine minutes). Figure 4-1 shows the passengers’ perceptions of the number of minutes buses were off schedule.
Figure 4-1. Passenger Perception of Fixed-Route Off-Schedule Performance
RTA and SunBus passengers reported that, on average, their one-way trips typically take one hour. At both agencies, reported one-way trip times ranged from only a few minutes (i.e., 2-5 minutes) to four-and-a-half hours. RTA passengers reported transferring two times, on average, during a one-way trip. SunBus passengers transfer an average of one time during a one-way trip.
Paratransit Passengers
Paratransit passengers reported that they schedule their DAR or SunDial trips anywhere from the same day that they wish to take the trip to roughly one-and-a-half weeks ahead of time (10 days ahead at RTA, 12 days ahead at SunLine). For both agencies, passengers reserve their paratransit rides an average of five days in advance.
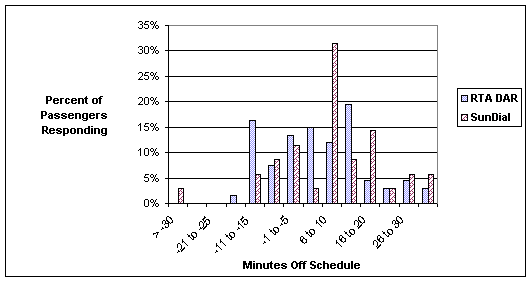
The majority of paratransit passengers indicated that the paratransit vehicles run on schedule frequently or almost always (reported by 70 percent of DAR passengers and 85 percent of SunDial passengers). When DAR or SunDial vehicles do run off schedule, passengers reported that the vehicles average about 10 minutes early (for both agencies) or 15-20 minutes late (i.e., 15 minutes late on DAR, 20 minutes late on SunDial). Figure 4-2 shows the passengers’ perceptions of the number of minutes the paratransit vehicles were off schedule.
Figure 4-2. Passenger Perception of Paratransit Off-Schedule Performance
Paratransit passengers commented on how much time it typically takes them to complete a one-way trip on DAR or SunDial. DAR passengers reported typical one-way trip lengths ranging from five minutes to one hour, with an average one-way trip length of 22 minutes. SunDial passengers reported one-way trip lengths of 10 minutes to three hours, with an average trip length of 46 minutes.
4.2.2.2 Driver Perception of System Performance
Paratransit drivers were asked about their perceptions of the system operations at their agencies. Some questions were asked of both types of drivers, while other questions were appropriate only for one type.
Fixed-Route Drivers
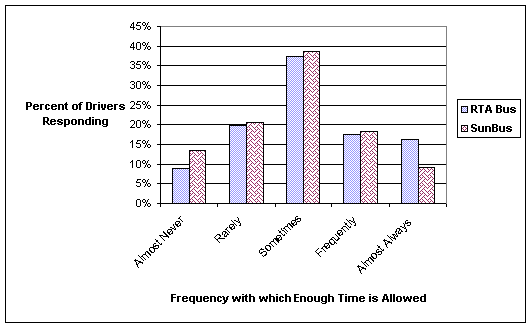
Bus drivers were asked if the bus schedules allow enough time for them to complete their routes on time. As shown in Figure 4-3, thirty-four percent of RTA drivers indicated that the bus schedule frequently or almost always allows enough time. Twenty-seven percent of SunBus drivers reported that there frequently or almost always is enough time in the schedule. However, at both agencies, about as many drivers indicated that there is rarely or almost never enough time in the bus schedule to complete routes on time (29 percent at RTA, 30 percent at SunLine).
Figure 4-3. Driver Perception of Adequacy of Time Allowed to Complete Fixed Routes
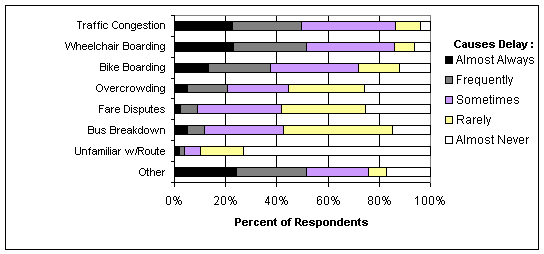
Bus drivers provided insight into the reasons for the delays they experience when trying to complete their routes. Drivers rated a series of factors on how often those factors contribute to delay. Figures 4-4 and 4-5 illustrate the bus drivers’ responses at RTA and SunLine. At RTA, more respondents (50 percent) cited “traffic congestion” and “wheelchair boarding” as factors that frequently or almost always cause delay than cited any other single reason. “Unfamiliarity with route” was least often cited as a cause of delay – 90 percent of respondents indicated that “unfamiliarity with route” rarely or almost never causes delay. Bus drivers were also asked to describe “other” reasons that contribute to delays. Twenty two percent of RTA bus drivers responded with “other” reasons. “Stopping for trains” was the most frequently cited “other” reason, while “passenger questions (about schedules and destinations)” and “stroller boarding” were the second and third most frequently cited “other” reasons for delay.
Figure 4-4. Reasons for Delay on RTA Buses
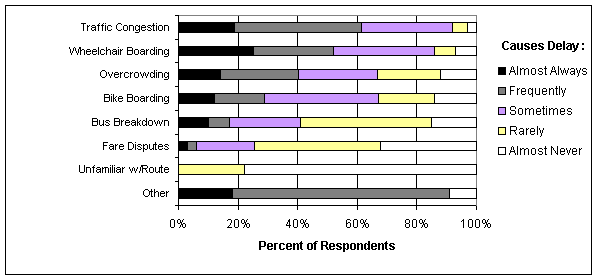
At SunBus, drivers gave similar responses to RTA bus drivers. “Traffic congestion” and “wheelchair boarding” were the most commonly blamed causes for delay. Sixty-two percent of SunBus drivers indicated that “traffic congestion” frequently or almost always causes delay, while 52 percent marked the same for “wheelchair boarding.” As with RTA bus drivers, SunBus drivers overwhelmingly indicated that “unfamiliarity with route” was rarely or almost never a cause of delay (stated by 100 percent of SunBus drivers). SunBus drivers were also asked to describe “other” reasons that contribute to delays. Thirty seven percent of SunBus drivers described “other” reasons. “Radios not working” and “passengers getting fares ready” were both cited as the top “other” reasons for delay, while “construction” was the third most frequently cited “other” reason.
Figure 4-5. Reasons for Delay on SunBuses
Bus drivers reported the average number of minutes their buses ran behind or ahead of schedule. Eleven percent of RTA drivers indicated that one or more of their routes typically run ahead of schedule. They reported that, on average, their routes are ahead of schedule by about seven minutes. Fifty-six percent of RTA drivers indicated that one or more of their routes typically run behind schedule. On average, those routes run behind schedule by 11 minutes. Sixteen percent of SunBus drivers indicated that one or more of their routes typically run ahead of schedule (by an average of six minutes), while 61 percent of SunBus drivers reported at least one of their routes runs behind schedule (by an average of 12 minutes).
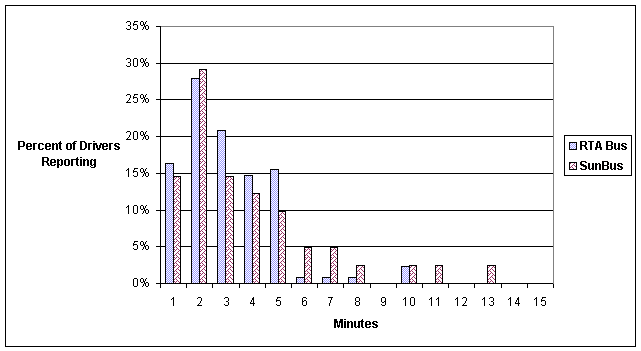
When asked how much time their buses idle as fares are collected, RTA drivers responded with estimates ranging from one to 10 minutes, as shown in Figure 4-6. SunBus drivers reported idle times ranging from one to 13 minutes. However, on average the drivers reported that for fare collection their buses idle three minutes on RTA buses and four minutes on SunBuses.
Figure 4-6. Driver Perception of Bus Idle Time During Fare Collection
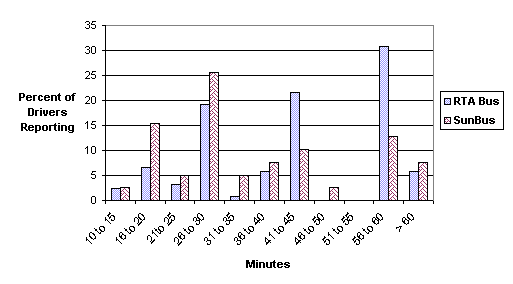
In the event that a bus breaks down, a replacement bus is required. Drivers were asked how long they typically wait for a replacement bus to arrive. Figure 4-7 shows how drivers responded. RTA drivers reported waiting an average of 48 minutes, while SunBus drivers wait an average of 39 minutes. However, at both agencies, some drivers reported waiting as few as 15 minutes and others reported waiting one-and-a-half to two hours.
Figure 4-7. Driver Perception of Waiting Time to Replace Broken-down Buses
Paratransit Drivers
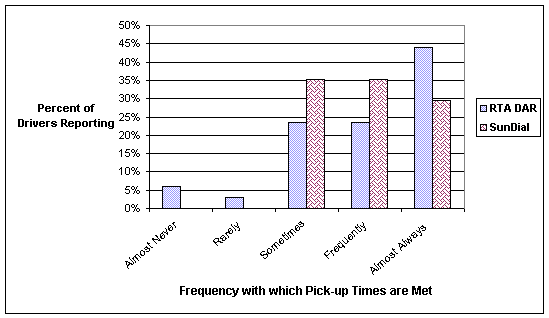
As an indicator of on-time performance, Dial-a-Ride and SunDial paratransit drivers reported how frequently they are able to meet pick-up times. Figure 4-8 shows that approximately two-thirds of drivers at both agencies indicated that they are frequently or almost always able to meet pick-up times.
Figure 4-8. Driver Perception of Frequency of Meeting Paratransit Pick-up Times
Paratransit drivers, like bus drivers, had the opportunity to identify factors that cause delay. Figure 4-9 illustrates the responses of Dial-a-Ride drivers. The factor most often reported as frequently or almost always causing delay was “passenger not ready,” reported by 40 percent of drivers. “Road construction” and “traffic congestion” were also identified as frequent causes of delay (reported as frequently or almost always causing delay by about 30 percent of drivers). “Bicycle boarding”, “DAR vehicle breakdown”, and “fare disputes” were generally reported as not causing delay.
Figure 4-9. Reasons for Delay on Dial-a-Ride Vehicles
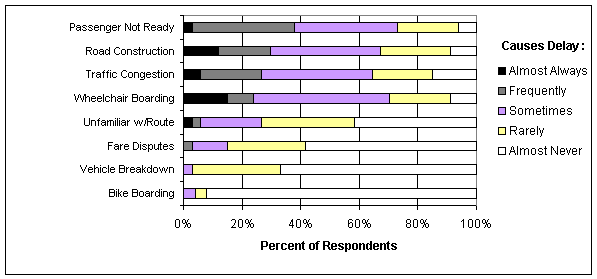
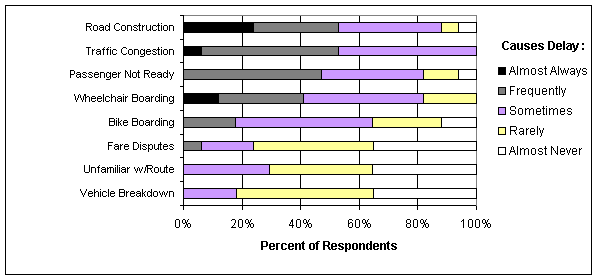
Figure 4-10 illustrates SunDial driver responses to the question asking how frequently a series of factors cause delay. The factors most often reported as frequently or almost always causing delay were “road construction” and “traffic congestion,” reported by over 50 percent of drivers. “Passenger not ready” was also identified as a factor that frequently causes delay by 47 percent of drivers. “SunDial vehicle breakdown”, “unfamiliarity with route”, and “fare disputes” were generally reported as not causing delay.
Figure 4-10. Reasons for Delay on SunDial Vehicles
Paratransit drivers offered feedback on how frequently their vehicles are empty between passenger pick-ups. Dial-a-Ride driver responses reflected tremendous variation in the frequency with which DAR vehicles are empty. About the same percentage of respondents indicated that their vehicles are frequently or almost always empty (39 percent) as indicated their vehicles are rarely or almost never empty (33 percent). Furthermore, the length of time reported as typical “empty time” varied greatly as well. Reported “empty time” averaged one hour and 20 minutes, but the standard deviation was one hour and 16 minutes. Clearly, DAR drivers experience varying “empty times.” There does not appear to be a typical scenario.
SunDial driver responses indicated some variation in the frequency with which and length of time during which their SunDial vehicles are empty. However, in general, more SunDial drivers (48 percent) reported that their vehicles are rarely or almost never empty than reported their vehicles are frequently or almost always empty (12 percent). Reported “empty time” averaged 63 minutes with a standard deviation of 45 minutes.
4.3 Customer Satisfaction
4.3.1. Objective System Performance Data
Customer satisfaction is difficult to measure using objective data. However, both RTA and SunLine collect statistics on the number of passenger complaints logged each quarter. During the third and fourth quarters of 2001 (January 2001 through June 2001), SunLine logged 75 complaints on the paratransit system and 118 passenger complaints on the fixed-route system. The nature of these complaints is not currently available.
RTA also provided data on passenger complaints for the third and fourth quarters of 2001 (January 2001 through June 2001). For their paratransit operations, RTA logged 44 passenger complaints during the fourth quarter of 2001 (April 2001 through June 2001)—third quarter data is not available. For their fixed-route operations, RTA recorded 344 complaints for the third quarter of 2001 (January 2001 through March 2001) and 335 complaints for the fourth quarter of 2001 (April 2001 through June 2001). Although, these numbers of complaints represent very small percentages (i.e., less than one percent) of the passenger volumes carried by the agencies, it is of interest to note that approximately one-third of the complaints for the fixed-route operations in the third and fourth quarters were obviously related to schedule adherence problems as reported by passengers. Again, RTA’s actual data are found in Appendix A for further review.
4.3.2 Subjective Survey Data
Customer satisfaction was measured primarily through surveys to passengers. However, agency drivers will also be customers of the planned AVL/CAD system and were, therefore, included in the survey effort to assess customer satisfaction with current service. Similar questions were asked of fixed-route respondents as were asked of paratransit respondents. Please note, several survey questions were asked using scales of one to 10 – for ease of reporting, those scales were recoded during analysis so that the meaning one and 10 were reversed (i.e., one was recoded to represent “not at all…” responses, 10 was recoded to represent “totally…” responses, all intermediate ratings were recoded accordingly).
4.3.2.1 Passenger Satisfaction
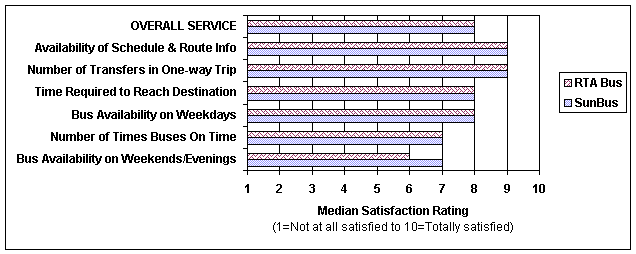
RTA and SunLine fixed-route passengers indicated generally high levels of satisfaction with various aspects of bus service (see Figure 4-11). On a scale from 1 (“not at all satisfied”) to 10 (“totally satisfied”), bus passengers at both agencies gave overall bus service a median rating of eight. Passengers gave median satisfaction ratings of nine for availability of schedule and route information as well as for number of transfers required to complete a typical one-way trip. The only aspect of service receiving a median rating that fell in the middle of the scale was availability of buses on evenings and weekends, with a median rating of six for RTA.
Figure 4-11. Passenger Satisfaction with Fixed-Route Service at RTA and SunLine
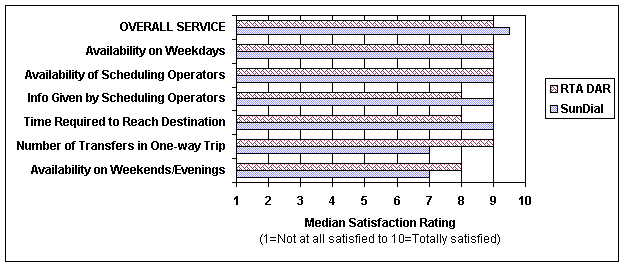
Paratransit passengers demonstrated generally high levels of satisfaction with paratransit service (see Figure 4-12). Dial-a-Ride passengers gave overall service a median rating of nine, while SunDial passengers reported a median rating of 9.5. Passengers were generally satisfied with the availability of paratransit vehicles on weekdays and the availability of scheduling operators.
Figure 4-12. Passenger Satisfaction with Paratransit Service at RTA and SunLine
Fixed-route passengers were asked how safe they typically feel on the bus. Respondents at both agencies reported high ratings for safety perception. On a scale from one (“not at all safe”) to 10 (“totally safe”), RTA and SunLine fixed-route passengers gave median ratings of nine. The most frequently reported rating was 10.
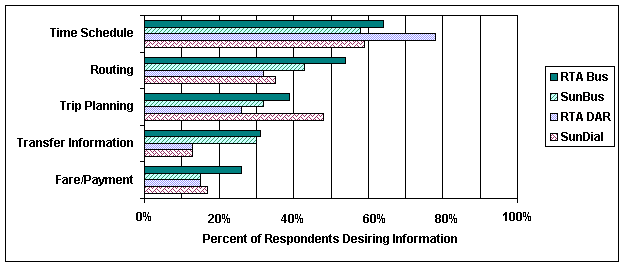
Fixed-route and paratransit passengers provided feedback on what types of transit information they would like to receive (see Figure 4-13). The types of information most often requested were time schedule, routing, and destination information/trip planning. The majority of passengers (generally more than 70 percent) at both agencies reported currently finding bus information through bus drivers, the customer service center, or informational flyers. However, over half of passengers indicated that they would like to use the Internet to obtain transit information.
Figure 4-13. Types of Information Passengers Would Like to Find Easily
4.3.2.2 Driver Satisfaction
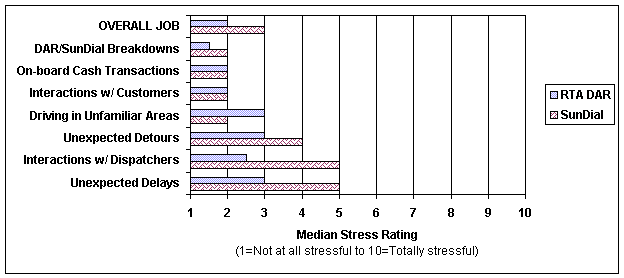
One reflection of drivers’ satisfaction with agency operations and services is the level of job-related stress experienced by drivers. Fixed-route and paratransit drivers rated how stressful they consider various aspects of their jobs. Figure 4-14 illustrates the median ratings reported by fixed-route drivers; Figure 4-15 presents median ratings for paratransit drivers. Overall, drivers reported low ratings of job-related stress. On a scale of one (“not at all stressful”) to 10 (“totally stressful”), RTA fixed-route drivers gave a median rating of three for their overall job stress; RTA paratransit drivers reported a median rating of two; SunBus and SunDial drivers gave a median rating of three for overall job stress.
Figure 4-14. Job Stress Ratings Reported by Fixed-Route Drivers at RTA and SunLine
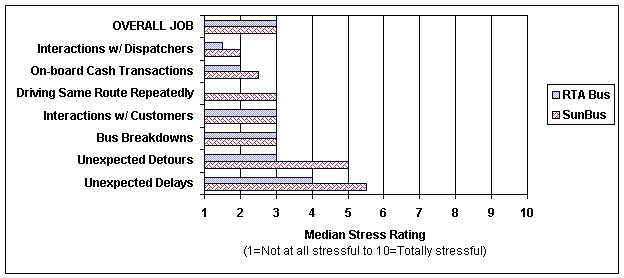
Figure 4-15. Job Stress Ratings Reported by Paratransit Drivers at RTA and SunLine
Drivers rated how safe they feel on their buses and paratransit vehicles using a scale from one (“not at all safe”) to 10 (“totally safe”). Drivers generally indicated that they feel safe on their vehicles. Drivers at both agencies gave median ratings of eight. Paratransit drivers at RTA reported a median rating of ten, while those at SunLine gave a median rating of nine.
Fixed-route and paratransit drivers at RTA and SunLine generally demonstrated overall satisfaction with their jobs. When asked to rate their level of overall job satisfaction on a scale of one (“not at all satisfied”) to 10 (“totally satisfied”), median ratings for the driver samples at both agencies ranged from eight to nine.
4.4 Institutional Benefits Evaluation
4.4.1 Institutional Processes “Before” Assessment
During the first nine months of the RTA-SunLine partnership in 2000, progress was slow and the procurement schedule suffered. Since then, the agencies have been successful in accomplishing their goals and meeting the revised project deadlines. At the conclusion of the first year in February 2001, RTA, SunLine and SCAG officials reflected on the lessons they have learned. As they move forward into the deployment phase of the project, the agencies looked back to understand what institutional issues may have contributed to prior project delays. As part of that process, these three stakeholders responded to six institutional issues questions. Based on the responses to these questions, and on the Independent Evaluator’s knowledge of the project, the following “before deployment” institutional assessments have been developed:
1) When was communication between the two agencies at its best? Please provide examples of activities/areas where communication was effective.
--During the global planning phase of the project
--During the consultant interview and response phase of the project
Evaluator Assessment: In these initial project phases in early 2000, the agencies had more “face time” than in later phases. Regular face-to-face meetings facilitated communication. Upper management at RTA supported this transit ITS deployment, and even attended one of the Evaluation Steering Committee meetings.
2) When was communication between the two agencies at its worst? Please provide examples of activities/areas where communication was ineffective.
--During the initial bid and purchasing portion of the project (i.e., development of Request for Proposal)
Evaluator Assessment: At this stage of the project, from summer through fall 2000, the agencies had difficulty agreeing on how to proceed. Upper agency management, particularly at RTA, did not encourage cooperation between the agencies, as agency goals sometimes competed.
3) A three-part question! For each type of information you list, please answer all three parts.
a) So far during this joint project, what type of information needed to be shared in order for the agencies to work together?
--Project Scope of Work details
--All global definitions and decisions
b) Who needed to have access to this information?
--Project managers from SunLine and RTA and funding and contracting agencies (i.e., FTA, Caltrans, and SCAG)
--All members of the team
c) What was the intended use of this information?
--To describe the work to be accomplished during the project
--To make policy and direction decisions
Evaluator Assessment: The sharing of information between RTA, SunLine and SCAG was performed most successfully during the periods where regular in-person meetings occurred. The sharing of technical information was primarily accomplished via email. The sharing of information for developing the RFP was accomplished with assistance from the ITS Joint Program Office – according to Jay Peterson of RTA, “we were able to use the JPO’s EDL <Electronic Document Library> web site to find examples of AVL/CAD system development documentation, including an example RFP, which were of significant help to us in developing our system concept and our System Integrator RFP.”
4) What, if any, institutional challenges or concerns were raised by either agency when information needed to be shared?
--Concerns were expressed by one agency early in the project regarding timelines and the content of the RFP’s Scope of Work. These concerns have been addressed and are no longer an issue.
--Information needed to be shared regarding who would be the primary agency point of contact for the project, RTA or SunLine. RTA assumed the role of primary point of contact.
Evaluator Assessment: According to Jay Peterson at RTA, “there is a perception that western U.S. transit agencies can’t work together…this project is now proving that perception wrong.” While some difficulties in communication occurred, in addition to a period where there was a lack of management support (at RTA), over the past four months, SunLine and RTA have been much more successful in working together. This can be attributed to more frequent meetings between the RTA and SunLine Project Managers, as well to a change in management at RTA. Additionally, while SunLine may have had concerns about delays in RTA’s management of the system integrator procurement process, this issue has been ameliorated, and SunLine is now satisfied with RTA’s leadership on this deployment.
5) How were institutional challenges or concerns addressed if they arose?
--The agencies worked to improve methods of communication. Meetings, email, and phone conversations served as the conduit for overcoming challenges. In addition, changes in upper management allowed the agencies to work more cooperatively toward common goals.
Evaluator Assessment: The prior management at RTA appeared to be not fully supportive of this ITS deployment, and at times showed a lack of interest in cooperating with SunLine on this project. Since the change in management at RTA last fall, the RTA Project Manager has been able to move forward much more quickly and successfully. Additionally, the new RTA management, as well as the RCTC, has made a new commitment to regional transit cooperation. This ITS project has helped to foster this new level of regional transit cooperation.
6) So far for the two agencies, what have been the key issues, good or bad, in working together?
--Communication
--Timeliness to responses
--Direction
Evaluator Assessment: In the initial phases of the project, the agencies experienced some difficulties with communication and cooperative project management. However, positive changes have been made to prevent disconnects in the future. Recently, the team successfully carried out the procurement phase of the project and both agencies are optimistic that the project will proceed smoothly to a timely, fruitful deployment of the system beginning in the summer of 2001.
4.4.2 Procurement Processes “Before” Assessment
During the first year of the Riverside project, RTA and SunLine coordinated efforts to procure an independent contractor that will provide system integration services for the ITS Demonstration project. Four firms responded to RTA’s and SunLine’s Request for Proposal. In December 2000, oral presentations were made to RTA, SunLine, and various project partners (i.e., the Southern California Association of Governments (SCAG), Riverside County Transportation Commission (RCTC), and CalTrans). Following this, two companies were asked to submit Best and Final Offers (BAFO’s), and ultimately, one company, Iteris, was selected in February.
The goal of this procurement was to develop a contract vehicle where the System Integrator has an equal stake in the project’s success, and is in fact considered a partner is the project’s development. To this end, the RFP was developed to include the following procurement elements:
- A two-phased award, where in the first phase the contractor must develop the system design, scope, specifications, and cost estimate (in partnership with the agencies) which will then serve as input to the second award 145 days later, which will address the deployment of the project. This unique approach to transit AVL implementation ensures that the System Integrator will be in full agreement with the system design and specifications. This approach seeks to prevent the problem with many transit AVL projects, where the system specifications are developed by the agencies or a 3rd party consultant, and allows the system integration contractor to delay the project and to increase costs due to problems with a specification that does not match the contractor’s capabilities or design experience.
- RTA and SunLine encouraged the responders to the RFP to present multiple options for contractor involvement in the responsibility for this project. Three options have the potential to provide different balances to the agencies and the contractors with respect to costs and risks:
Business as Usual. This is the standard contractor-agency business relationship, where the agency assumes most of the risk for project success or failure, but they potentially get an unrealistically low cost estimate from the system integrator. This has been the model for most transit AVL systems in the country, many of which have been delayed and plagued by cost overruns.
Contractor as Project Manager. This would allow the complete system development, deployment and initial system operation responsibilities to be fully assumed by the system integration contractor. This option would consist of a much higher fixed price total system cost to the agency, but would considerably reduce the risk to the agency – the contractor must deliver the complete system at a fixed price.
Combination. This would be a combination of the Business as Usual and the Contractor as Project Manager options. There would be a shared responsibility between the agencies and the system integration contractor to ensure project success, while managing risks and costs for both parties. Specific incentives and/or disincentives would be built into the contract to ensure full compliance in this public private partnership. As an example, a particular system acceptance criteria element might include different specifications that must be met by both contractor provided hardware as well an existing system the agency maintains. This approach appears to be the most likely option that RTA and SunLine will accept for this project. The selected systems integration contractor (Iteris) is prepared to use this approach at RTA’s and SunLine’s request.
- The ability for RTA to cancel the project at any time provides a major incentive for the System Integrator to make sure that the project is at least a marginal success.
- The contract has been specifically designed to be open-ended to allow for a variety of transit ITS elements to be amended to the Statement of Work as funding materializes over the next several years. For example, a SunLine-sponsored transit ATIS and Kiosk system has already been funded, and it is anticipated that the design and deployment of this system will be added to this System Integration contract later this year. Future anticipated add-ons include Automated Fare Payment/Smart Cards and a Maintenance Monitoring System. This procurement flexibility is especially important in California, where, as this project has demonstrated, it takes a very long time for a new start contract to be funded, an RFP to be issued, and a contract to be awarded.
The system integrator contract stipulates that by the end of 2001 the contractor will perform the following five tasks:
1) Perform a needs analysis.
2) Develop system design and technical specifications.
3) Assist in the procurement and implementation phases of the installation and integration of ITS technologies.
4) Consult during the evaluation and system testing phases of the ITS implementation.
5) Provide post-implementation services.
At the time of this report, the Needs Analysis was nearly complete and the technical specifications were under development. SAIC continues to attend monthly status update meetings with RTA, SunLine, the System Integrator, and partner organizations (e.g., SCAG). The system integration contract is progressing on schedule.
5.0 Project STATUS UPDATE
5.1 Purpose
In the draft version of this report, this section provided a risk assessment and a recommendation for proceeding with Phase III of this evaluation effort. Following the JPO’s review of this draft, approval was granted and the funding was released for this evaluation to proceed into Phase III.
Here, this final version of the report presents an update of the project status, schedule and risks for the remainder of the ongoing Phase III evaluation effort.
5.2 Deployment Plans and Schedule
Currently, the system deployment is about seven months behind the schedule that was reported in the draft version of this report in June 2001. Unlike previous delays that were due to institutional issues, the current delay is the result of unforeseen complications with the regional communications environment under which the proposed AVL technologies will operate.
In February 2001, the Systems Integration contract was awarded to Iteris. Negotiations were completed quickly, and the system development kickoff meeting was held in early March. Under Phase I of the project, which was originally expected to take four months, Iteris has been co-developing the AVL/CAD system requirements with SunLine and RTA. Due to complications with additional requirements from RTA and SunLine to conduct a region-wide radio communications study, Phase I has been extended significantly, and is now anticipated to conclude on 31 January 2002. It is important to note here that the Radio Communications Study has just been completed, and will serve as an input to the follow-on AVL/CAD deployment effort.
It is now expected that the Phase II follow-on contract for the actual system deployment will be awarded around 1 March 2002, with the first system elements being deployed by June 2002, and with the majority of the components being deployed by November of 2002. Under the Phase II AVL/CAD deployment, several routes are expected to be added monthly as the deployment proceeds to a full operating condition in late 2002.
Additionally, it is still anticipated that the funding will be in place for the complementary transit ATIS development and deployment effort as well. At the last project meeting on December 6th, 2001, the project partners reiterated their desire for this project to be included as part of the AVL/CAD system Phase II contract award in March 2002. If this can be accomplished, then deployment of this system could be expected by the end of 2002.
5.3 Opportunities
The Evaluation Team has identified the following evaluation opportunities that can potentially take place during this evaluation effort:
- The Riverside Transit ITS Demonstration project provides a unique opportunity to examine AVL/CAD system performance by cross-referencing system operational data by route with subjective system operational survey data from passengers and drivers by route. It will be very interesting to see how driver and passenger perceptions of service relate to the actual measured improvements in service from this ITS deployment.
- The significant subjective data on customer satisfaction and system operational performance being collected in the before and after evaluations here will provide an opportunity to examine in detail the fixed-route and paratransit passenger, driver and dispatcher perceptions of the quality of services that are expected to improve as a result of this ITS deployment. Here, we have collected very robust data in the before evaluation, consisting of over 1000 fixed route passenger surveys, over 150 paratransit passenger surveys, nearly 200 fixed route driver surveys, and over 50 paratransit driver surveys. Additionally, RTA and SunLine, who are partners in the survey effort, are expecting to learn a great deal about the impact of technology on their customers through the final results of the customer satisfaction survey in the “after” evaluation period.
- The technology deployment is expected to begin by June 2002, with final integration and testing expected to be completed by the end of the year. The availability of the system capabilities in the near future will lessen the difficulties in comparing and analyzing data from the baseline with the post-deployment scenario.
- The Transit Advanced Traveler Information System component is expected to be deployed during this evaluation effort (late 2002). The after survey effort can potentially examine passenger reaction to this system.
- Despite AVL/CAD system deployment delays, the Evaluation Team continues to collect high-fidelity baseline system operational performance data. Collection of this data will provide at least a 1.5-year baseline before system deployment activities commence.
- This evaluation presents an opportunity for the collection of very interesting “during” data over the 5–6 month period in which the AVL/CAD systems are deployed. Using the route-based system operational performance data that are being collected, it may be possible to see the incremental improvements in system operational efficiency occurring as buses within each route are equipped and tied into the new system.
- Significant Lessons are being learned in this evaluation regarding procurement. While time will tell the full story, the unique methods, partnerships and contract conditions that are being implemented here have the potential to significantly improve the procurement paradigm for large transit ITS system deployment efforts, many of which have historically experiences significant delays and/or cost overruns.
Additionally, the Evaluation Team has identified the following potential longer term evaluation opportunities which the JPO and PAWG may be interested in looking at in the future under a potential “Phase IV” Evaluation activity:
- RTA and SunLine have plans in the 2003–2004 timeframe to deploy an interface between the AVL Control Head and the bus Engine Diagnostics System, which would allow for real-time maintenance monitoring of all buses in the fleet. This would allow for more effective preventive maintenance, and also for providing information on critical engine/bus failures potentially before they happen. As transit maintenance monitoring remains an ITS data gap, an evaluation here could potentially be significant in addressing the operational benefits and lessons learned through the fielding of this system.
- RTA and SunLine are also contemplating the development of an automated fare payment/Smart Card system sometime in the 2003–2004 timeframe. This system will likely be deployed in cooperation with a system that is now being considered by MTA for the Los Angeles region. This system could present another potential evaluation component of interest, and would be especially significant if it were deployed across the entire Los Angeles inter-jurisdictional region.
5.4 Risks
The one primary area of risk that concerns the Evaluation Team is schedule risk. More specifically, the current evaluation timeframe is scheduled to conclude on 31 December 2002. However, based on the current project schedule, the current projected evaluation timeframe for conducting the “after” analysis activities is October 2002 through March 2003.
Concerning the project partners’ current system deployment schedule, the Evaluation Team is reasonably confident that any future schedule slips will be less severe than in the past due to the current successful involvement of Iteris as the system implementer. Iteris has provided a concrete and detailed structure that should lead to a successful project implementation in 2002.
5.5 Recommendations
Based on the above, the Evaluation Team recommends that in August of 2002 SAIC should provide the JPO with a detailed evaluation schedule update. At this point in time, the deployment schedule will be more concrete, and the Evaluation Team should be able to provide the JPO with a specific recommendation concerning a potential extension of the evaluation timeframe. The Evaluation Team will likely recommend an extension of the evaluation period-of-performance though a portion of 2003, with modifications to the final reporting deadlines as appropriate. It is not anticipated that any additional resources would be required to extend the SAIC evaluation effort timeframe.
The Evaluation Team remains committed to learning and presenting the results of the evaluation of the after-deployment scenario of the Riverside Transit ITS Demonstration Project to the JPO-PAWG. This evaluation should provide ample opportunity to test the evaluation hypotheses presented in the evaluation plan and provide FHWA with valuable information on the integration of transit ITS systems among varying customers and different jurisdictions.
The Evaluation Team would also like to highlight the future potential of this evaluation to look at the deployment of both a transit maintenance monitoring system and a regional automated fare payment system. Here, the “before” and “after” data collected under this current evaluation could be considered as the “baseline” data for a potential “Phase IV” evaluation of these components in the 2003–2004 timeframe.
Appendix A: baseline system performance datA
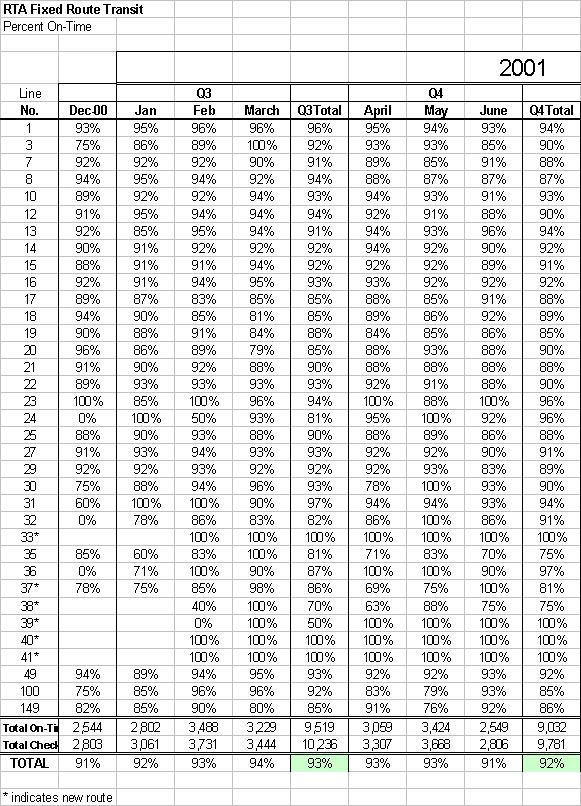
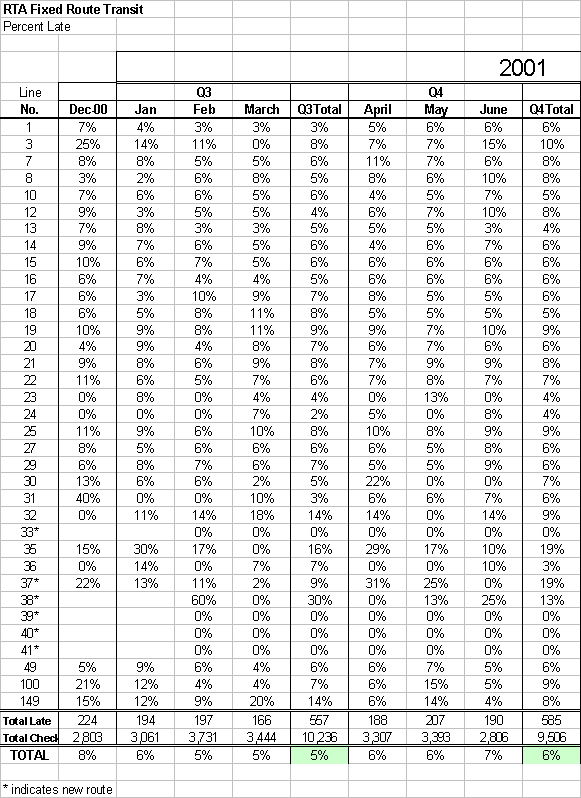
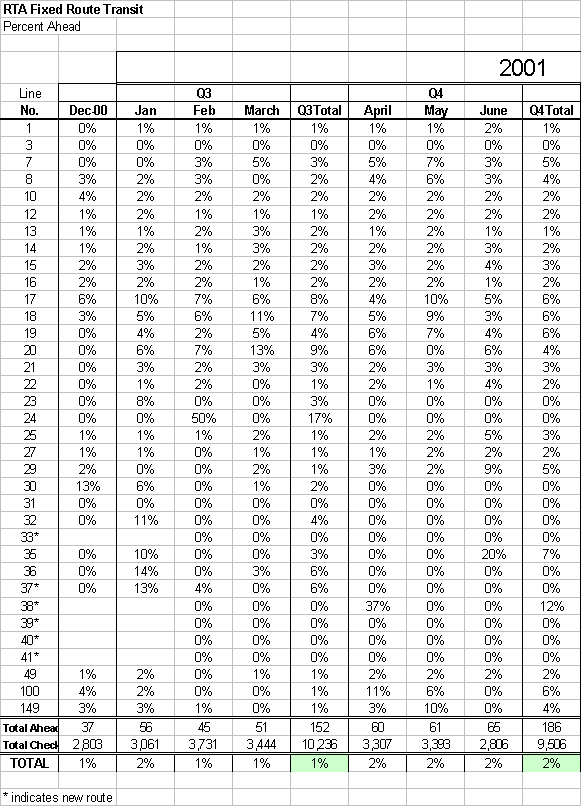
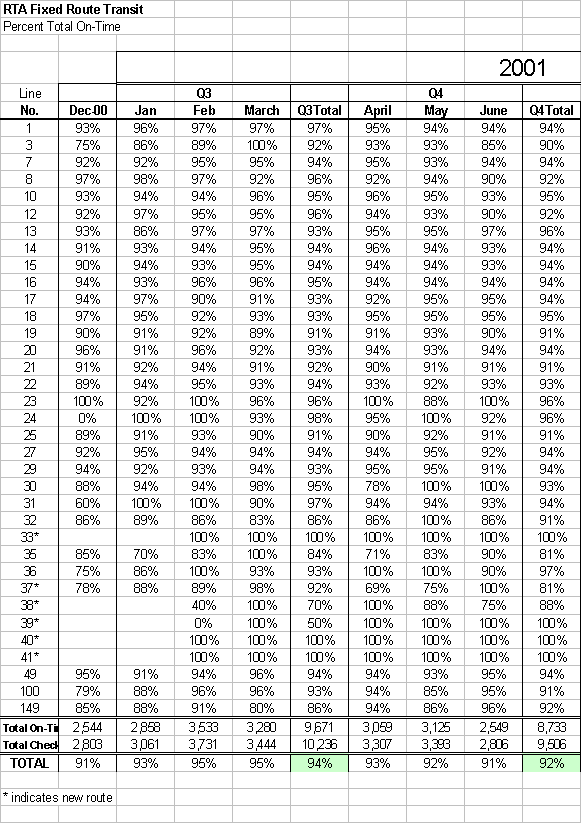
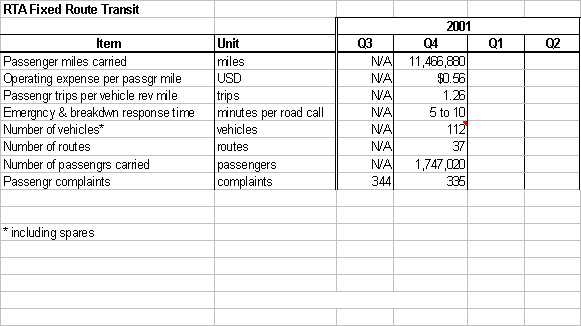
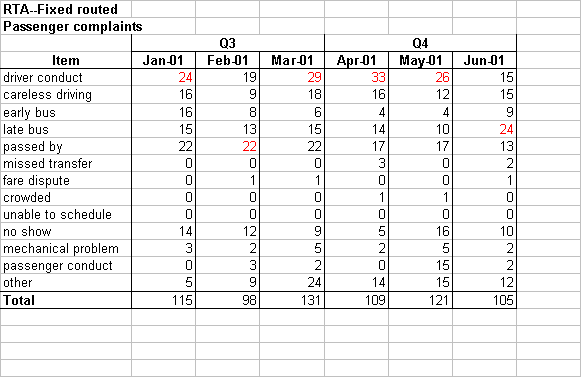
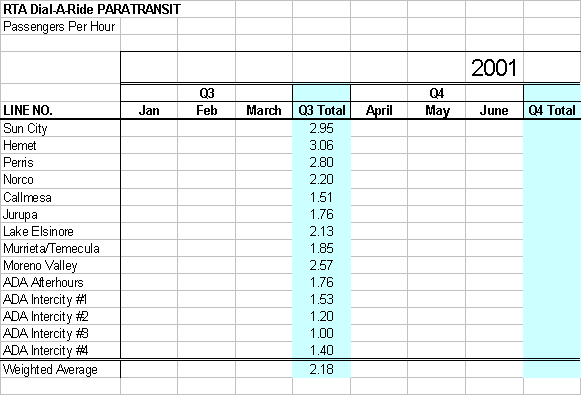
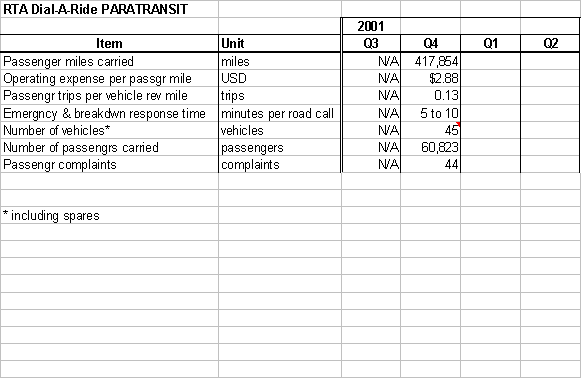
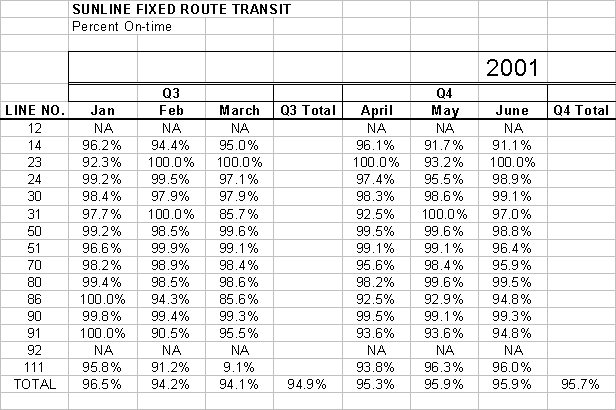
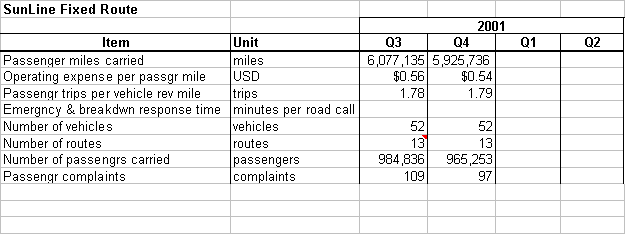
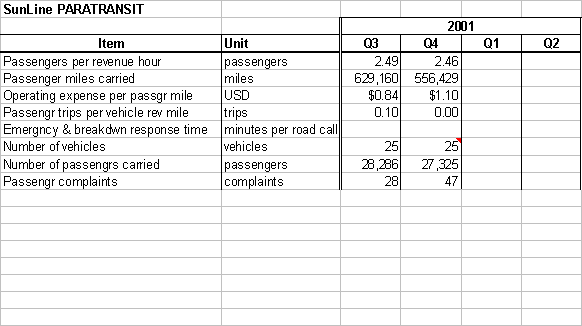
Appendix B: Evaluation “before” survey guidelines
Riverside Transit Agency and SunLine Transit Agency
Survey Guidelines
Passenger Survey
Subjects
300-500 transit riders from each agency’s jurisdiction
300-500 paratransit riders from each agency’s jurisdiction
The routes by which riders are accessed should be stratified by the following categories:
--Route
--Time of day – morning (7-10 AM), afternoon (12-3 PM), and evening (5-8 PM)
--Time of week – weekday (M-Th), weekend (S-S)
Materials (for each agency)
700 transit rider surveys (English version)
300 transit rider surveys (Spanish version)
700 paratransit rider surveys (English version)
300 paratransit rider surveys (Spanish version)
Pencils (sharpened and in quantities large enough to meet demand)
Clipboards (in quantities large enough to meet demand)
Batch information sheets for each group of surveys distributed (completed before survey distribution)
Procedure
Surveys should be separated into groups so that one group of surveys is associated with each distribution event (i.e., a particular route on a particular day at a particular time). A batch information sheet should be printed and filled out for each group of surveys.
Surveyors capable of speaking English or Spanish should ride the selected transit and paratransit routes. Enough surveyors should be present so that surveys can easily be distributed to boarding passengers and collected from departing passengers at each stop.
Surveyor greets passengers once the passenger finds a seat. The surveyor should briefly introduce the survey using a greeting similar to this:
In an effort to improve [bus/Dial-a-Ride/SunDial] service, we are asking riders to fill out a short survey about how they use [the bus/Dial‑a‑Ride/SunDial] and what they think of the service they receive. Would you mind telling us what you think?
Incentives may be necessary if response rates are low. As an incentive, respondents may be given a voucher towards one or more free rides on RTA or SunLine vehicles.
Surveyors should provide respondents with a blank survey, sharpened pencil, and clipboard.
Respondents should be reminded to return the survey and related material to the surveyor before departing the bus. * The bus driver can assist surveyors by announcing at each stop that riders should return the materials before departing the vehicle.
Completed surveys should be collected, grouped with their corresponding batch information sheet, and returned to SAIC for data entry and analysis.
*Note: Surveyors should encourage passengers to complete and return the survey before leaving the bus. However, respondents may return their surveys to the bus driver on the next bus they board.
Driver Survey
Subjects
All agency transit drivers
All agency paratransit drivers
RTA Materials
250 transit driver surveys (English version)
100 paratransit driver surveys (English version)
Pencils (sharpened and in quantities large enough to meet demand)
SunLine Materials
125 transit driver surveys (English version)
50 paratransit driver surveys (English version)
Pencils (sharpened and in quantities large enough to meet demand)
Procedure
Drivers will be approached when they report to work during the survey distribution period (February 2001 through April 2001) and will be asked to complete the survey before beginning their shifts.
Surveyors will assure drivers that the drivers’ responses are anonymous and confidential.
Surveyors should provide respondents with a blank survey and sharpened pencil.
Completed surveys should be collected and returned to SAIC for data entry and analysis.
Appendix C: Evaluation “BEFORE” SUrveys
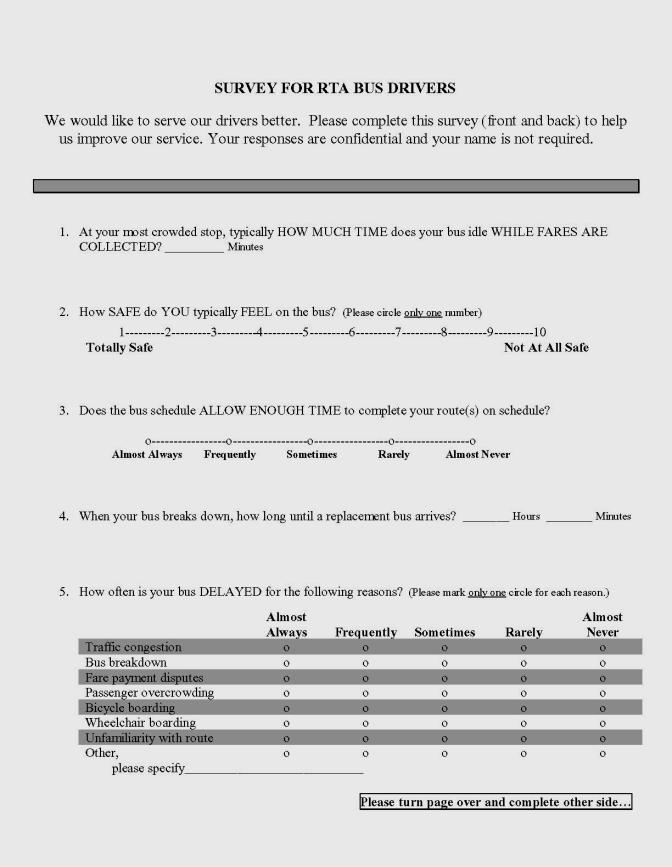
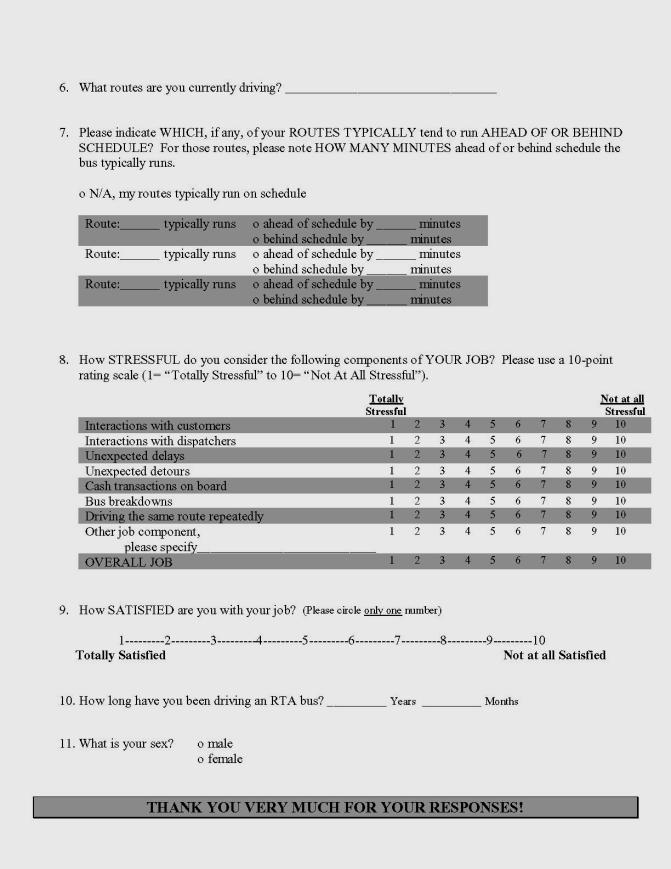
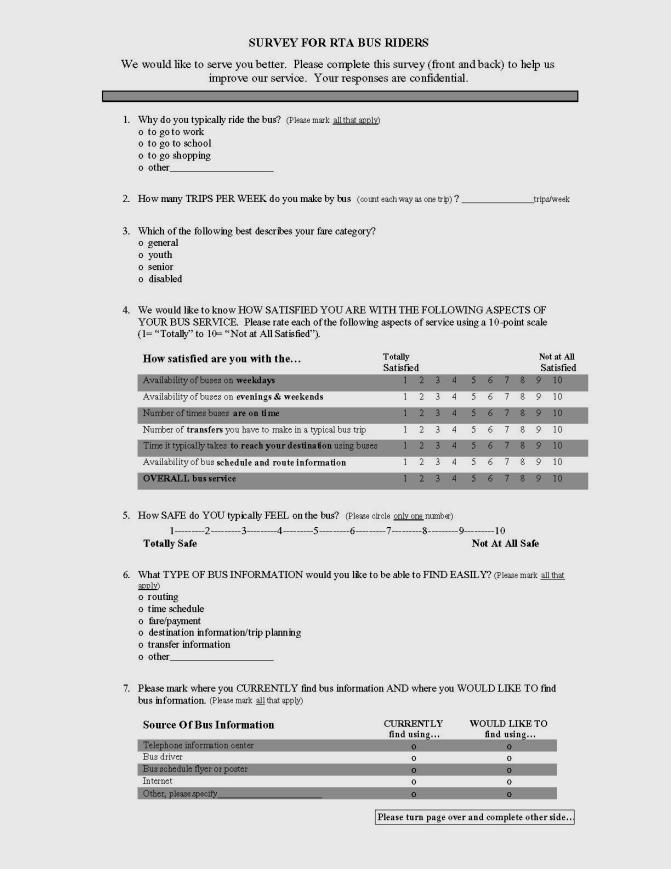
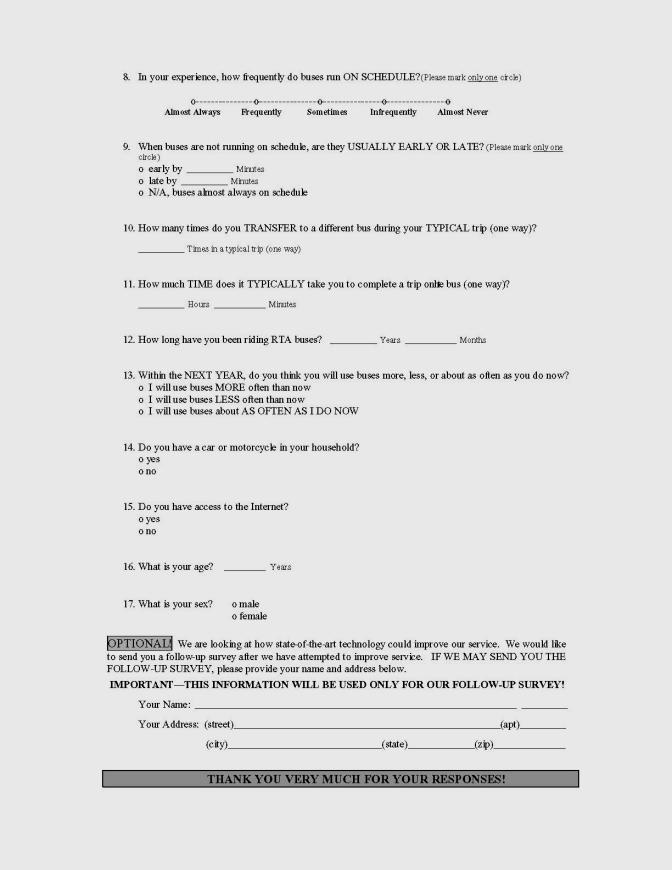
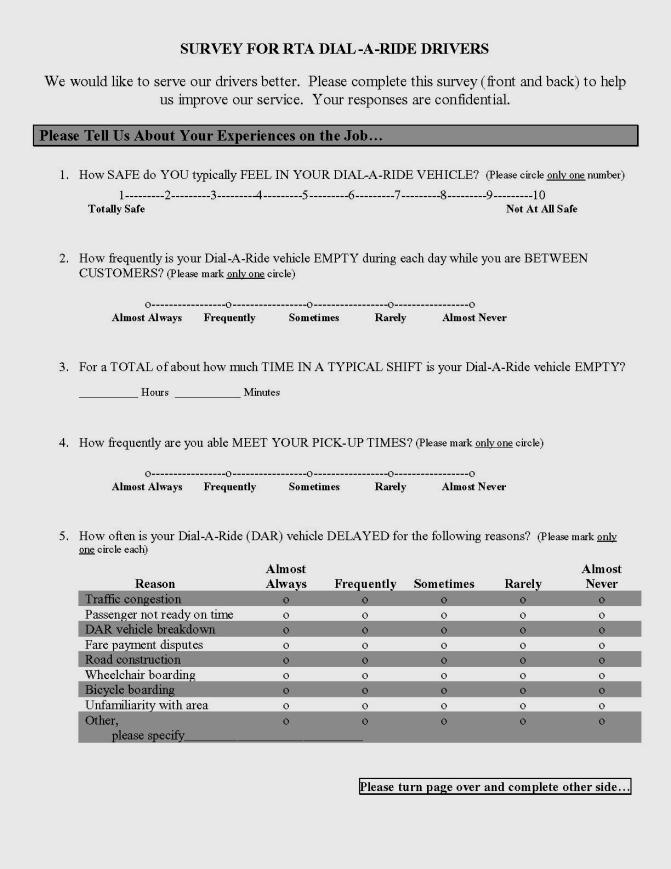
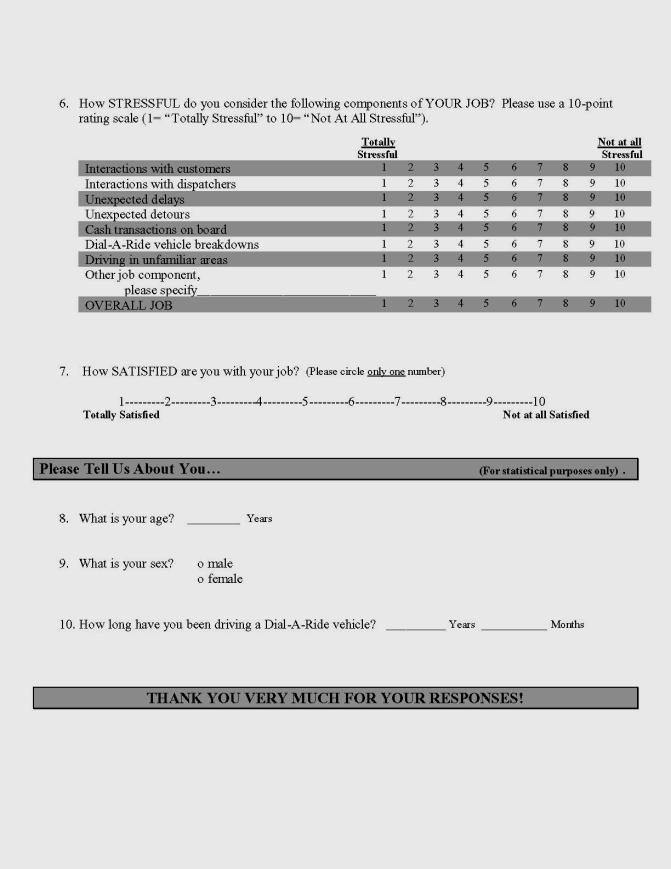
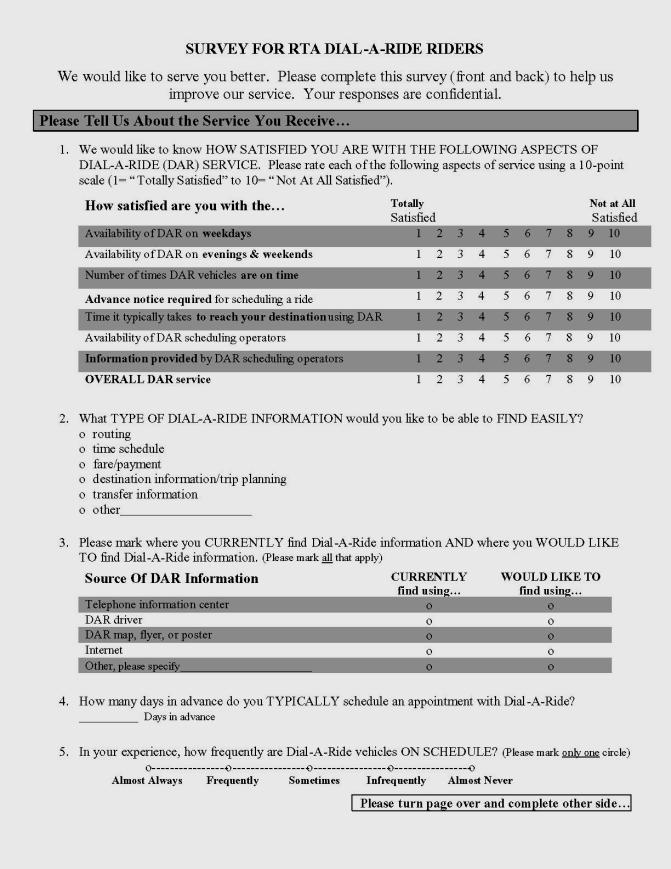
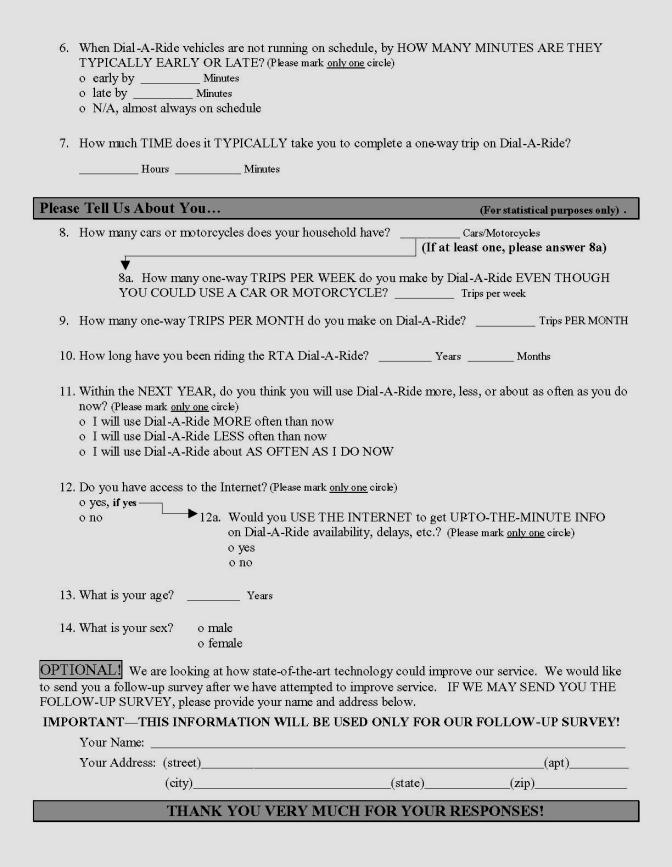
[1] Note that this evaluation schedule is based on the projected system deployment schedule as discussed with RTA and SunLine in December 2001.
[2] For this report, data analyses were performed for the period from January 2001 through June 2001. Data are being collected continuously throughout the evaluation period and will be analyzed for the final evaluation report.
[3] For the Southern California Association of Governments (SCAG), Robert Huddy serves as a Senior Transportation Planner for ITS Planning, Coordination, and Implementation, through the Southern California Economic Partnership. “The Partnership” is charged with facilitating implementation of advanced technologies identified in SCAG’s Regional Transportation Plan.
[4] US Census Bureau Web Site, www.census.gov
[5] see: FTA National Transit Database, www.fta.dot.gov
[6] Note that there appears to be an error in the 1998 entry on the “Operating Expense per Passenger Mile” graph on the 1999 National Transit Database summary provided in Figure 2-2. A zero may have been incorrectly included.
[7] System description taken from Multisystems Web site at www.multisystems.com
[8] System description taken from Trapeze Software Group Web site at www.trapezesoftware.com
[9] Several are from Casey, R. et al. “Advanced Public Transportation Systems: The State of the Art Update ‘98”, FTA, 1998, pp. 2-11.
[10] http://www.mitretek.org/its/benecost.nsf/
[11] Note here that: (1) The project is also utilizing the Caltrans New Technology Program Office (Caltrans-NewTech) to administer the contract; (2) the Riverside County Transportation Commission (RCTC) must approve all major contract awards for RTA and SunLine.
[12] Note here that in March 2001, Jay Peterson left RTA and Rick Kaczerowski assumed the role of project manager for RTA.