
Development
of Requirements and Functional Specifications for
Crash Event Data Recorders
Final Report
1. Report No. |
2. Government Accession No. |
3. Recipient's Catalog No. |
||||
4. Title and Subtitle Development of Requirements and Functional Specifications for Crash Event Data Recorders – Final Report |
5. Report Date December 2004 |
|||||
6. Performing Organization Code |
||||||
7. Author(s) John Pierowicz, Daniel P. Fuglewicz, Glenn Wilson |
8. Performing Organization Report No. |
|||||
9. Performing Organization Name and Address General Dynamics, Advanced Information Systems 4455 Genesee Street Buffalo, NY 14225 |
10. Work Unit No. (TRAIS) Task 5 |
|||||
11. Contract or Grant No. DTFH61-01-C-00182 |
||||||
12. Sponsoring Agency Name and Address Federal Highway Administration 400 Seventh Street SW Washington, DC |
13. Type of Report and Period Covered Technical Report |
|||||
14. Sponsoring Agency Code FHWA |
||||||
15. Supplementary Notes This program was administered through the Federal Highway Administration (FHWA) Intelligent Transportation Systems Joint Program Office (ITS/JPO)). For further information, contact the Task Order Manager, Amy Houser: amy.houser@fmcsa.dot.gov. |
||||||
16. Abstract The U.S. DOT has conducted research on the requirements for a Crash Event Data Recorder to facilitate the reconstruction of commercial motor vehicle crashes. This report documents the work performed on the “Development of Requirements and Functional Specifications for Crash Event Data Recorders” project, performed under U.S. DOT Contract: DTFH61-01-C-00182, Task Number: BZ82B007. It includes the results from the three program tasks: Task 1 – Develop Requirements for an EDR through Crash Analysis, Task 2 – Review Previous and Ongoing Efforts with Respect to Event Data Recorders (EDRs) and Vehicle Data Recorders (VDRs), and Task 3 – Develop Functional Specifications for an Event Data Recorder (EDR) for Commercial Motor Vehicles. |
||||||
17. Key Word Commercial Motor Vehicles, Heavy Trucks, Tractor-Trailers, Crash Analysis, Event Data Recorders, Crash Data Recorders |
18. Distribution Statement |
|||||
19. Security Classif. (of this report) Unclassified |
20. Security Classif. (of this page) Unclassified |
21. No. of Pages |
22. Price |
|||
FOREWORD
This document is disseminated
under the sponsorship of the Department of Transportation in the interest of
information exchange. The United States Government assumes no liability for its
contents or use thereof.
The contents of this report
reflect the views of the contractor, who is responsible for the accuracy of the
data presented herein. The contents do not necessarily reflect the official
policy of the United States Department of Transportation.
This report does not constitute
a standard, specification, or regulation.
The United States Government
does not endorse products or manufacturers. Trade or manufacturers names
appear herein only because they are considered essential to the object of this
document.
ACKNOWLEDGEMENTS
This project was funded by the
Federal Highway Administration Intelligent Transportation Systems/Joint Program
Office and managed by the Federal Motor Carrier Safety Administration. The
authors are grateful for the support and contributions of many USDOT staff
members who provided valuable input and direction to the project including: Amy Houser (FMCSA), Deborah Freund (FMCSA),
Ralph Craft (FMCSA), John Hinch (NHTSA), Gary Toth (NHTSA), and Kate Hartman
(FHWA).
ACRONYMS AND ABBREVIATIONS
ACRONYM DEFINITION
3D Three Dimensional
∆V Delta V, Change
in Velocity
ABS Anti-Lock Braking
System
AC Alternating
Current
ACC Automatic Cruise
Control
Ack Acknowledge
ACN Automatic Collision
Notification
AMPS Advanced Mobile Phone
Service
APP Accelerator
Pedal Position
ASCII American Standard Code
for Information Exchange
ASR Acceleration Slip
Regulation
ATA American Trucking
Associations
ATC Automatic Traction
Control
AVSC Automatic Vehicle
Speed Control
BCI Bulk Current
Injection
BTU British Thermal
Units
CCVS Cruise Control/Vehicle
Speed
CCW Counterclockwise
CFC Channel Frequency
Class
CMV Commercial Motor
Vehicle
CTI Central Tire
Inflation
CVR Cockpit Voice
Recorder
CW Clockwise
DC Direct Current
DDU Driver Display Unit
DED Data Element
Definition
DERM Diagnostic Energy
Reserve Module
DIU Driver Interface
Unit
DL Drivers License
DOF Degree-of-Freedom
DRL Daytime Running Lamps
DSRC Dedicated Short Range
Communication
EBS Electronic Braking
System
ECBS Electronically
Controlled Braking System
ECM Electronic/Engine
Control Module
ECU Engine Control Unit/
Electronic Control Unit
EDR Event Data Recorder
EEPROM Electrically-Erasable
Programmable Read-Only Memory
EMI Electromagnetic
Interference
EMS Emergency Medical
Services
ESN Electronic Serial
Number
ESV Enhanced Safety
Vehicle
FAA Federal Aviation
Administration
FARS Fatal Accident
Reporting System
ACRONYM DEFINITION
FCWS Forward Collision
Warning System
FDR Flight Data
Recorder
FHWA Federal Highway
Administration
FMCSA Federal Motor Carrier
Safety Administration
FMVSS Federal Motor Vehicle
Safety Standards
FOT Field Operational
Test
g Acceleration
of Gravity
GES General Estimates
System
GHz GigaHertz
GIS Geographic
Information System
GM General Motors
GMT Greenwich Mean Time
GPRMC Recommended Minimum
Specific GPS/Transit Data
GPS Global Positioning
System
GVWR Gross Vehicle Weight
Rating
HDOP Horizontal Dilution of
Precision
HVAC Heating Ventilation and
Air Conditioning
Hz Hertz
I/O Input/Output
ID Identification
IEEE Institute of
Electrical and Electronic Engineers
IrDA Infrared Data
Association
ISM InterStellar Medium
ISO International
Standards Organization
ITS/JPO Intelligent
Transportation Systems/Joint Program Office
IVI Intelligent
Vehicle Initiative
IWI Independent
Witness Incorporated
JPL Jet Propulsion
Laboratory
kbps Kilobits Per Second
KHz KiloHertz
kW Kilowatt(s)
Lat Latitude
LDWS Lane Departure Warning
System
LED Light-Emitting
Diode
Long Longitude
LRMS Location Reference
Message System
LTCCS Large Truck Crash
Causation Study
MB Megabytes
Mbps Mega-Bits Per Second
MHz MegaHertz
MMUCC Model Minimum Uniform Crash Criteria
MV Motor Vehicle
MVEDR Motor Vehicle Event Data
Recorder
N Newton
NASA National Aeronautical
and Space Administration
NASS National Automotive
Sampling System
ACRONYM DEFINITION
NAV Navigation System
NCHRP National Cooperative
Highway Research Program
NCIC National Crime
Information Center
NCSA National Center for
Statistics and Analysis
NHTSA National Highway Traffic
Safety Administration
NMEA National Maritime
Electronics Association
NTSB National
Transportation Safety Board
NVM Non-Volatile Memory
OEM Original Equipment
Manufacturer
OMC Office of Motor
Carriers
PAR Police Accident
Report
PC Personal Computer
PCMCIA Personal Computer Memory
Card International Association
PCU Pressure Control
Unit
PDA Personal Digital
Assistant
PDOF Principal Direction of
Force
PGN Parameter Group
Number
PID Perimeter
Identification
POI Point of Impact
PSD Power Spectral
Density
PTO Power Take Off
RF Radio Frequency
RH Relative Humidity
ROM Read Only Memory
RP Recommended
Practice
RPM Revolutions Per
Minute
SAE Society of
Automotive Engineers
SCI Special Crash Investigation
SDM Sensing Diagnostic
Module
SPN Suspect Parameter
Number
SRS Supplemental
Restraint System
T&B Truck and Bus
TCD Traffic Control
Device
TMA Truck Manufacturers
Association
TMC Technology and
Maintenance Council
TRB Transportation
Research Board
US United States
USB Universal Serial
Bus
USDOT United States Department
of Transportation
UTC Universal Time
Coordinated
VDC Volts Direct Current
VDR Vehicle Data
Recorder
VIN Vehicle
Identification Number
VRTC Vehicle Research and
Test Center
WG Working Group
EXECUTIVE SUMMARY
This report presents the results of a Federal Highway
Administration (FHWA) Intelligent Transportation Systems/Joint Program Office
(ITS/JPO) project, in collaboration with the Truck Manufacturers Association
(TMA). In this project, a comprehensive requirements analysis defined specific
crash event data recorder (EDR) requirements and functional specifications to
facilitate the reconstruction of crashes involving large trucks. These
requirements and specifications were developed through a review of previous and
on-going EDR work and an analysis of CMV crash data. Using this information,
specific data elements were ranked in the following three tiers to define crash
characteristics in crashes involving commercial motor vehicles (CMVs):
Tier 1 The minimum required data elements for a crash EDR on CMVs.
Tier 2 Additional data elements to the data elements in tier 1 that
would permit further analysis of crashes involving CMVs.
Tier
3 A complete set of data crash elements to
thoroughly analyze crashes involving CMVs, including the data elements listed
in tiers 1 and 2 above.
After the tiers of data
elements were established, a cost effectiveness analysis was conducted to
estimate the costs of the data elements in each of the three tiers and to
determine whether one or more data elements would significantly increase the
cost of an EDR.
Tier 1 data elements
included:
·
Acceleration (Longitudinal, Lateral, and
Vertical)
·
Accelerator Pedal Position/Time History
·
Brake Status/Pressure/Time History
(includes Antilock Brake System)
·
Belt Status
·
Engine Speed
·
Steering Wheel Angle/Time History
·
Time/Date
·
Transmission Gear Selection
·
Vehicle Speed
·
Wheel Speeds
·
Vehicle Identification
·
Vehicle Path
Tier 2 data elements, in
addition to Tier 1 data elements, included:
·
Airbag Status
·
Battery and System Voltage
·
Cruise Control Status
·
Engine Retarder System Status
·
Traction Control Status
·
Clutch Position
·
Headlight Status
·
Running Light Status
·
Turn Signal Status
·
Warning Light Status
·
Windshield Wiper Status
·
Vehicle Load, Stability Control, Yaw and
Tilt Angle (Advanced sensor installation)
Tier 3
included data elements, in addition to Tier 1 and 2 data elements, as well as:
·
Brake Stroke
·
Brake System Pressure
·
Distance to Intersection
·
Driver Eye Glance Position
·
Driver Fatigue Status
·
Horn Use / Status
·
Roadway Surface Friction
·
Running Light Status
·
Side Object Detector
·
Tire Pressure
·
Truck Headway
·
Truck Lane Position
·
Video Imaging Driver
·
Video Imaging Roadside Environment
In addition to the data elements tiers, requirements were also
developed for EDR components, hardware, software, sensors, and databases.
Furthermore, the project addressed issues such as, the physical attributes of
the device, crash/environmental survivability, availability of appropriate
sensors; data storage and retrieval; crash event trigger algorithms; accuracy
and reliability; calibration; and maintainability. In summary, the Development
of Requirements and Functional Specifications for Crash Event Data Recorders
project can provide a foundation for a future design of a crash EDR for
CMVs.
TABLE OF
CONTENTS
Section Page
MODEL MINIMUM UNIFORM CRASH
CRITERIA DATA ELEMENTS REVIEW
IN-VEHICLE NETWORK DATA ELEMENTS
REVIEW
ON-BOARD LAND-VEHICLE MAYDAY
REPORTING INTERFACE REVIEW
TASK 3 DEVELOP FUNCTIONAL SPECIFICATIONS
DATA ELEMENT COST-EFFECTIVENESS
ANALYSIS
Humidity
SAE J1455 and SAE J1211
Immersion
and Splash (Water, Chemicals, and Oils)
SAE J1455
Steam
Cleaning/Pressure Washing SAE J1455
Dust, Sand,
and Gravel Bombardment SAE J1455
Mechanical
Vibration SAE J1455
Steady-State
Electrical Characteristics SAE J1455
Electrical
Noise and Electro-static/-magnetic Compatibility Characteristics
Size,
Weight, and Mounting Method
Interface
Configurations and Data Retrieval Process
Number of
Events Stored in EDR Memory
Multiple
Events and Overlap of Events
System
Calibration and Maintenance
Incorporation
with Fleet Management Tools
List of
Tables
Table Page
1 ...... Crash
Frequency by Body Type for GES Years 2000 and 2001
2 ...... Crash
Frequency by Body Type
3 ...... Crash
Frequency by Crash Configuration 2000 GES
4 ...... Crash
Frequency by Crash Configuration 2001 GES
6
..... Crash Relation to Roadway
7
..... Crash Relation to
Junction
8
..... Crash Manner of
Collision
9 ...... Crash
Roadway Alignment
11
.. Crash Atmospheric
Conditions
12
... Crash Surface Conditions
13
... Crash Lighting
Conditions
15
... Sample of Cases from the
LTCCS
17
... Data Elements and
Frequency of Occurrence in LTCCS Case Analysis
18 .... Summary
of EDR Event Algorithms
21
... SAE J1455 Temperature
Extremes for Heavy-Duty Truck/Tractor
22 .... SAE
J1455 12-Volt and 24-Volt Operating Characteristics
23 .... SAE
J1455 Transient Voltage Characteristics
24 .... Various
SAE Electrical Noise Test Standards
25 .... EDR
Data Survivability Parameters
27 .... EDR
Data Element Record Format
28 .... Examples
of Dual-Use EDR Technologies
List of
Figures
Figure Page
1....... EDR
System Connectivity Block Diagram
2 ...... Simplified
EDR Block Diagram
Crash Event Data Recorders (EDRs) can provide critical information on
crashes involving commercial motor vehicles (CMVs) to improve the current
understanding of vehicle safety and support the development of future crash
countermeasures. This Federal Highway Administration Intelligent Transportation
Systems/Joint Program Office (FHWA ITS/JPO) project, in collaboration with the
Truck Manufacturers Association (TMA), consisted of a comprehensive
requirements analysis, which defined specific EDR requirements and functional
specifications to facilitate the reconstruction of crashes involving large
trucks (gross vehicle weight rating (GVWR) of more than 10,000 pounds).
Specifically, the project built upon the findings of the National Highway
Traffic Safety Administration (NHTSA) sponsored Truck and Bus Event Data
Recorder Working Group (T&B EDR WG).
Three main tasks were performed in this project:
1.
Task 1 Develop
Requirements for an EDR through Crash Analysis
2.
Task 2 Review Previous
and Ongoing Efforts with Respect to EDRs and Vehicle Data Recorders (VDRs)
3.
Task 3 Develop
Functional Specifications for an EDR for CMVs.
Task 1 consisted of
initially analyzing the National Crash Sampling
Systems (NASSs) General Estimates System (GES) data to characterize large truck
(GVWR of more than 10,000 pounds) crashes.
Then, a profile of large truck crashes established through
the use of NASS GES data was used to select crashes from the NHTSA/Federal
Motor Carrier Safety Administration (FMCSA) Large Truck Crash Causation Study
(LTCCS).
133 cases were selected from the LTCCS for in-depth crash analysis. The
analysis of these cases resulted in a list of data elements that could be
recorded by an EDR and be useful for crash reconstruction.
Task 2
consisted of reviewing EDR literature, uses, and recommendations from several
government agencies and other stakeholders. The majority of the recommendations
focused on the types of data elements that should be collected in an EDR. In
addition, the data elements available on the in-vehicle data networks (Society
of Automotive Engineers (SAE) J-1587 and SAE J-1939) were reviewed.
Task 3
involved using the information in Task 1 and 2 to rank data elements in the
following three tiers to define crash characteristics in crashes involving CMVs:
Tier 1 The minimum required
data elements for a crash EDR on CMVs.
Tier 2 Additional data elements
to the data elements in tier 1 that would permit further analysis of crashes
involving CMVs.
Tier 3 A complete set of data crash elements to thoroughly analyze
crashes involving CMVs, including the data elements listed in tiers 1 and 2
above.
After the categories of data elements were
established, a cost effectiveness analysis was conducted to estimate the costs
of the data elements in each of the three tiers and to determine whether one or
more data elements would significantly increase the cost of an EDR. In
addition, operational (environmental and electrical) specifications for an EDR
were created, along with methods of communication with an EDR in order to
off-load an EDRs data.
This section summarizes the work performed on Task 1 Develop Requirements for an EDR through Crash Analysis. The basis for this analysis included previous work from NHTSA, FMCSA, National Transportation Safety Board (NTSB), along with a comprehensive requirements analysis to define specific EDR requirements and functional specifications for the reconstruction of crashes involving large trucks. A requirements-based approach applied large truck crash data from the NHTSA/FMCSA LTCCS to derive requirements for an EDR that would facilitate crash reconstruction. These findings were used to develop functional specifications and requirements for an EDR that could be successfully implemented in large trucks.
In order to select a proper population of truck crashes for analysis, an evaluation of the large truck crash population was performed using the NASS GES. GES data come from a nationally representative sample of police reported motor vehicle crashes of all types, from minor to fatal. The GES began operation in 1988 to identify traffic safety problem areas, provide a basis for regulatory and consumer initiatives, and form the basis for cost and benefit analyses of traffic safety initiatives. The information is used to estimate how many motor vehicle crashes of different kinds take place and what happens when they occur. Although various sources suggest that about half of the motor vehicle crashes in the country are not reported to the police, the majority of these unreported crashes involve only minor property damage and no significant personal injury. By restricting attention to police-reported crashes, GES concentrates on those crashes of greatest concern to the highway safety community and the general public.
GES data are used in traffic safety analyses by NHTSA and other USDOT agencies. In order for a crash to be eligible for the GES sample, a police accident report (PAR) must be completed where the crash involved at least one motor vehicle traveling on a trafficway, resulting in property damage, injury, or death. These crash reports are chosen from 60 areas that reflect the geography, roadway mileage, population, and traffic density of the United States. GES data collectors make weekly visits to approximately 400 police jurisdictions in the 60 areas across the U.S., where they randomly sample about 50,000 PARs each year. The data collectors obtain copies of the PARs and send them to a central contractor for coding. No other data are collected beyond the selected PARs.
Trained data entry personnel interpret and code data directly from the PARs into an electronic data file. Approximately 90 data elements are coded into a common format. Some element modification takes place every other year in order to meet the changing needs of the traffic safety community. To protect individual privacy, no personal information, such as names, addresses, or specific crash locations, is coded. During coding, the data are checked electronically for validity and consistency. After the data file is created, further quality checks are performed on the data through computer processing and by the data coding supervisors.
To
understand an EDRs utilization environment, an evaluation of GES data was
conducted to determine the type of crashes that large trucks are currently
involved in. For this analysis, two years of GES data, from 2000 and 2001, were
examined to determine if the trends observed in the data were consistent across
a two year period or if a spike in the data record. After an examination of
these results, data spikes were not apparent in the data, and the two years of
data were believed to be sufficient for this analysis.
In 2000
and 2001, over 11 million vehicle crashes were recorded in GES. As shown in
Table 1, medium/heavy truck crashes constituted 3.4% and 3.5% of the population
in 2000 and 2001, respectively. (Medium/heavy trucks in GES are
defined as large trucks with a GVWR of more than 10,000 pounds.) The data for
these various large truck body types are
also shown in Table
2. The crash
analysis for this project focused on these vehicles.
Table 1
Crash Frequency by Body Type for GES Years 2000 and 2001
|
Body
Type |
2000
GES Frequency |
2000
GES Percent |
2000
GES Cum. Percent |
|
Automobiles and Derivatives |
6,730,902 |
59.3 |
59.3 |
|
Utility Vehicles |
1,080,662 |
9.5 |
68.8 |
|
Light Trucks |
2,814,394 |
24.8 |
93.6 |
|
Bus School Bus |
26,510 |
0.2 |
93.8 |
|
Bus Transit, Intercity, etc. |
26,749 |
0.2 |
94.0 |
|
Bus Unknown |
2,573 |
0.0 |
94.0 |
|
Medium/Heavy Truck Step Van |
1,786 |
0.0 |
94.0 |
|
Medium/Heavy Truck Straight Truck |
140,769 |
1.2 |
95.2 |
|
Medium/Heavy Truck Motor Home |
3,011 |
0.0 |
95.2 |
|
Medium/Heavy Truck Tractor/Trailer |
208,466 |
1.8 |
97.0 |
|
Medium/Heavy Truck Unknown |
48,885 |
0.4 |
97.4 |
|
Motorcycles |
68,640 |
0.6 |
98.0 |
|
Other/Unknown Body Type |
192,863 |
1.7 |
99.7 |
|
Total |
11,346,210 |
99.7 |
99.7 |
|
Body
Type |
2001
GES Frequency |
2001
GES Percent |
2001
GES Cum. Percent |
|
Automobiles and Derivatives |
6,518,991 |
58.3 |
58.3 |
|
Utility Vehicles |
1,169,740 |
10.5 |
68.7 |
|
Light Trucks |
2,822,651 |
25.2 |
94.0 |
|
Bus School Bus |
25,695 |
0.2 |
94.2 |
|
Bus Transit, Intercity, etc. |
25,925 |
0.2 |
94.4 |
|
Bus Unknown |
2,078 |
0.0 |
94.4 |
|
Medium/Heavy Truck Step Van |
1,844 |
0.0 |
94.4 |
|
Medium/Heavy Truck Straight Truck |
139,880 |
1.3 |
95.7 |
|
Medium/Heavy Truck Motor Home |
828 |
0.0 |
95.7 |
|
Medium/Heavy Truck Tractor/Trailer |
195,888 |
1.8 |
97.5 |
|
Medium/Heavy Truck Unknown |
47,379 |
0.4 |
97.9 |
|
Motorcycles |
72,089 |
0.6 |
98.5 |
|
Other/Unknown Body Type |
164,956 |
1.5 |
100.0 |
|
Total |
11,187,944 |
100.0 |
100.0 |
Table 2
Crash Frequency by Body Type
|
Body
Type |
2000
GES Frequency |
2000
GES Percent |
2000
GES Cum. Percent |
|
Medium/Heavy Truck Step Van |
1,786 |
0.4 |
0.4 |
|
Medium/Heavy Truck Straight Truck |
140,769 |
34.9 |
35.3 |
|
Medium/Heavy Truck Motor Home |
3,011 |
0.7 |
36.0 |
|
Medium/Heavy Truck Truck/Tractor |
208,466 |
51.7 |
87.7 |
|
Medium/Heavy Truck Unknown |
48,885 |
12.1 |
99.8 |
|
Total |
402,917 |
99.8 |
99.8 |
|
Body
Type |
2001
GES Frequency |
2001
GES Percent |
2001
GES Cum. Percent |
|
Medium/Heavy Truck Step Van |
1,844 |
0.5 |
0.5 |
|
Medium/Heavy Truck Straight Truck |
139,880 |
36.2 |
36.7 |
|
Medium/Heavy Truck Motor Home |
828 |
0.2 |
36.9 |
|
Medium/Heavy Truck Truck/Tractor |
195,888 |
50.8 |
87.7 |
|
Medium/Heavy Truck Unknown |
47,379 |
12.3 |
100.0 |
|
Total |
385,819 |
100.0 |
100.0 |
Table 3
Crash Frequency by Crash Configuration 2000 GES
|
Cat. No. |
Code |
Category |
Configuration |
Description |
Frequency |
Percent |
|
|
- |
0 |
No Impact |
N/A |
|
11,548 |
|
|
|
|
|
|
|
Total: No Impact |
11,548 |
4.9 |
|
|
I |
1 |
Single Driver |
A: Right Roadside Departure |
Drive off road |
16,320 |
|
|
|
|
6 |
Single Driver |
B: Left Roadside Departure |
Drive off road |
4,237 |
||
|
|
11 |
Single Drive R |
C: Forward Impact |
Parked vehicle |
17,204 |
||
|
|
|
|
|
Total: Single Driver |
37,761 |
15.9 |
|
|
II |
20 |
Same Trafficway, Same Direction |
D: Rear End |
Stopped |
44,637 |
|
|
|
II |
34 |
Same, Same Direction |
E: Forward Impact |
This vehicles strikes another vehicle |
30 |
||
|
II |
44 |
Same e Dir |
F: Sideswipe/Angle |
Straight ahead on left |
54,565 |
||
|
II |
Total: Same Trafficway,
Same Direction |
99,232 |
41.9 |
||||
|
III |
50 |
Same Trafficway, Opposite Direction |
G: Head on |
Lateral move (left/right) |
1,462 |
|
|
|
III |
54 |
Same |
H: Forward Impact |
This vehicle strikes another vehicle |
8 |
||
|
III |
64 |
S |
I: Sideswipe/Angle |
Lateral move (left/right) |
7,638 |
||
|
III |
Total: Same Trafficway, Opposite Direction |
9,108 |
3.8 |
||||
|
IV |
68 |
Changing Trafficway, Vehicle Turning |
J: Turn Across Path |
Initial opposite direction (left/right) |
25,048 |
|
|
|
IV |
76 |
Vehicle Turning |
K: Turn Into Path |
Turn into same direction (turning left) |
16,117 |
||
|
IV |
Total: Changing
Trafficway, Vehicle Turning |
41,165 |
17.4 |
||||
|
V |
86 |
Intersecting Paths (Vehicle damage) |
L: Straight Paths |
Striking from the right |
7,450 |
|
|
|
V |
Total: Intersecting
Paths (Vehicle damage) |
7,450 |
3.1 |
||||
|
VI |
92 |
Miscellaneous |
M: Backing |
Backing vehicle |
30,563 |
|
|
|
VI |
|
|
|
Total: Miscellaneous |
30,563 |
12.9 |
|
|
|
|
|
|
Total |
236,827 |
99.9* |
|
*Sum not equal to 100% due to rounding.
Table 4
Crash Frequency by Crash Configuration 2001 GES
|
Cat. No. |
Code |
Category |
Configuration |
Description |
Frequency |
Percent |
|
|
- |
0 |
No Impact |
N/A |
|
15,092 |
|
|
|
|
|
|
|
Total: No Impact |
15,092 |
6.8 |
|
|
I |
1 |
Single Driver |
A: Right Roadside Departure |
Drive off road |
11,135 |
|
|
|
|
6 |
Single Driver |
B: Left Roadside Departure |
Drive off road |
3,751 |
||
|
|
11 |
Single Drive R |
C: Forward Impact |
Parked vehicle |
10,961 |
||
|
|
|
|
|
Total: Single Driver |
25,847 |
11.6 |
|
|
II |
20 |
Same Trafficway, Same Direction |
D: Rear End |
Stopped |
44,049 |
|
|
|
II |
34 |
Same, Same Direction |
E: Forward Impact |
This vehicle strikes another vehicle |
349 |
||
|
II |
44 |
Same e Dir |
F: Sideswipe/Angle |
Straight ahead on left |
51,573 |
||
|
II |
Total: Same Trafficway,
Same Direction |
95,971 |
43.2 |
||||
|
III |
50 |
Same Trafficway, Opposite Direction |
G: Head on |
Lateral move (left/right) |
818 |
|
|
|
III |
54 |
Same |
H: Forward Impact |
This vehicle strikes another vehicle |
46 |
||
|
III |
64 |
S |
I: Sideswipe/Angle |
Lateral move (left/right) |
10,549 |
||
|
III |
|
|
|
Total: Same Trafficway, Opposite Direction |
11,413 |
5.1 |
|
|
IV |
68 |
Changing Trafficway, Vehicle Turning |
J: Turn Across Path |
Initial opposite direction (left/right) |
22,695 |
|
|
|
IV |
76 |
Vehicle Turning |
K: Turn Into Path |
Turn into same direction (turning left) |
14,470 |
||
|
IV |
Total: Changing
Trafficway, Vehicle Turning |
37,165 |
16.7 |
||||
|
V |
86 |
Intersecting Paths (Vehicle damage) |
L: Straight Paths |
Striking from the right |
5,624 |
|
|
|
V |
Total: Intersecting
Paths (Vehicle damage) |
5,624 |
2.5 |
||||
|
VI |
92 |
Miscellaneous |
M: Backing |
Backing vehicle |
31,162 |
|
|
|
VI |
|
|
|
Total: Miscellaneous |
31,162 |
14.0 |
|
|
|
|
|
|
Total |
222,274 |
99.9* |
|
*Sum not equal to 100% due to rounding.
GES crash data records also provided insight into the roadways where large truck crashes occur. Table 5 illustrates the distribution of vehicle crashes between the interstate highway system and other roadways. (An Interstate Highway is an FHWA designation for those roadways that are part of the Dwight D. Eisenhower System of Interstate and Defense Highways.) According to this data, approximately 21% of large truck crashes occurred on the interstate highways.
|
Interstate Highway |
2000
GES Frequency |
2000
GES Percent |
2001
GES Frequency |
2001
GES Percent |
|
No |
317,335 |
78.8 |
303,459 |
78.7 |
|
Yes |
85,210 |
21.2 |
82,109 |
21.3 |
|
Total |
402,545 |
100.0 |
385,568 |
100.0 |
Table 6 provides additional data on the location of large
truck crashes. The Relation to Roadway Variable in the GES system provided data
on the location of the first harmful event where the first impact occurred. The
results provided data that is linked to the trucks operational profile. While
the predominant location for the first harmful event is on the roadway, several
crashes occurred in the parking lane or on the roadside.
Table 6
Crash Relation to Roadway
|
Relation to Roadway |
2000
GES Frequency |
2000
GES Percent |
2001
GES Frequency |
2001
GES Percent |
|
On roadway |
341,780 |
84.8 |
334,860 |
86.8 |
|
On shoulder |
5,926 |
1.5 |
3,659 |
0.9 |
|
On median |
3,868 |
1.0 |
3,700 |
1.0 |
|
On roadside |
24,068 |
6.0 |
18,420 |
4.8 |
|
Outside trafficway |
4,141 |
1.0 |
3,216 |
0.8 |
|
Off-road, location unknown |
4,989 |
1.2 |
6,788 |
1.8 |
|
In parking lane |
16,377 |
4.1 |
14,414 |
3.7 |
|
Gore |
612 |
0.2 |
368 |
0.1 |
|
Separator |
585 |
0.1 |
28 |
0.0 |
|
Unknown |
571 |
0.1 |
367 |
0.1 |
|
Total |
402,917 |
100.0 |
385,820 |
100.0 |
As shown in
Table 7, additional descriptive data regarding crash locations was provided by
the Relation to Junction Variable within the GES. In 2000 and 2001,
approximately 50 percent of large truck
crashes occurred between intersections in non-interchange, non-junction areas.
Table 7
Crash Relation to Junction
|
Relation to Junction |
2000
GES Frequency |
2000
GES Percent |
2001
GES Frequency |
2001
GES Percent |
|
Non-interchange, non-junction |
192,646 |
47.8 |
193,608 |
47.6 |
|
Non-interchange, intersection |
60,736 |
15.1 |
60,900 |
15.8 |
|
Non-interchange, intersection-related |
80,677 |
20.0 |
80,131 |
20.8 |
|
Non-interchange, drive, alley |
35,223 |
8.7 |
26,476 |
6.9 |
|
Non-interchange, ramp |
2,461 |
0.6 |
1,533 |
0.4 |
|
Non-interchange, rail crossing |
1,895 |
0.5 |
1,732 |
0.4 |
|
Non-interchange, bridge |
2,425 |
0.6 |
2,065 |
0.5 |
|
Non-interchange, cross-over related |
1,154 |
0.3 |
804 |
0.2 |
|
Non-interchange, other |
636 |
0.2 |
2,115 |
0.5 |
|
Non-interchange, unknown |
2,332 |
0.6 |
2,217 |
0.6 |
|
Interchange, non-junction |
3,662 |
0.9 |
3,090 |
0.8 |
|
Interchange, intersection |
2,798 |
0.7 |
2,473 |
0.6 |
|
Interchange, intersection related |
1,180 |
0.3 |
1,120 |
0.3 |
|
Interchange, ramp |
14,129 |
3.5 |
16,006 |
4.1 |
|
Interchange, bridge |
170 |
0.0 |
75 |
0.0 |
|
Interchange, cross-over related |
52 |
0.0 |
0 |
0.0 |
|
Interchange, other |
155 |
0.0 |
1,016 |
0.3 |
|
Interchange, unknown |
289 |
0.1 |
49 |
0.0 |
|
Unknown |
315 |
0.1 |
409 |
0.1 |
|
Total |
402,935 |
100.0 |
385,819 |
99.9* |
*Sum
not equal to 100% due to rounding.
The
crash configuration distribution for large trucks was analyzed by examining the
Manner of Collision Variable within the GES. The Manner of Collision Variable
(GES Variable A7) indicates the orientation of the vehicles in a collision. Table 8 illustrates this
distribution for large trucks for in 2000 and 2001.
The Manner of
Collision distribution for large trucks was dominated by four configurations;
no collision, rear-end (which includes the truck being hit from behind and
the truck striking the rear of other vehicle), angle, and sideswipe, same
direction. These four crash
configurations accounted for over 94% of large truck crashes in 2000 and 2001.
Table
8
Crash Manner of Collision
|
Manner of Collision |
2000
GES Frequency |
2000
GES Percent |
2001
GES Frequency |
2001
GES Percent |
|
No collision |
104,710 |
26.0 |
90,045 |
23.3 |
|
Rear-end |
103,346 |
25.6 |
102,945 |
26.7 |
|
Head-on |
6,182 |
1.5 |
5,612 |
1.5 |
|
Rear-to-rear |
0 |
0.0 |
644 |
0.2 |
|
Angle |
103,168 |
25.6 |
106,148 |
27.5 |
|
Sideswipe, same direction |
73,198 |
18.2 |
64,799 |
16.8 |
|
Sideswipe, opposite direction |
11,977 |
3.0 |
14,290 |
3.7 |
|
Unknown |
336 |
0.1 |
1,335 |
0.3 |
|
Total |
402,917 |
100.0 |
385,818 |
100.0 |
The
roadway and environmental conditions data provided useful information for the
development of EDR requirements. These statistics revealed that large truck
crashes primarily occurred on straight and level roadways. Table 9 and Table 10 show the distribution of
large truck crashes by roadway alignment and roadway profile.
Table 9
Crash Roadway Alignment
|
Roadway Alignment |
2000
GES Frequency |
2000
GES Percent |
2001
GES Frequency |
2001
GES Percent |
|
Straight |
318,668 |
79.1 |
297,758 |
77.2 |
|
Curve |
45,607 |
11.3 |
42,823 |
11.1 |
|
Unknown |
38,642 |
9.6 |
45,238 |
11.7 |
|
Total |
402,917 |
100.0 |
385,819 |
100.0 |
Table 10
Crash Roadway Profile
|
Roadway Profile |
2000
GES Frequency |
2000
GES Percent |
2001
GES Frequency |
2001
GES Percent |
|
Level |
231,346 |
57.4 |
211,521 |
54.8 |
|
Grade |
72,815 |
18.1 |
67,596 |
17.5 |
|
Hillcrest |
5,345 |
1.3 |
6,964 |
1.8 |
|
Other |
394 |
0.1 |
364 |
0.1 |
|
Unknown |
93,017 |
23.1 |
99,373 |
25.8 |
|
Total |
402,917 |
100.0 |
385,818 |
100.0 |
As shown
in Table
11, the GES data revealed that large truck crashes
primarily occurred in daylight hours with no adverse weather conditions. A
smaller proportion of the crashes occurred in the rain.
Table 11
Crash
Atmospheric Conditions
|
Atmospheric Conditions |
2000
GES Frequency |
2000
GES Percent |
2001
GES Frequency |
2001
GES Percent |
|
No Adverse |
340,959 |
84.6 |
339,860 |
88.1 |
|
Rain |
32,028 |
7.9 |
32,981 |
8.5 |
|
Sleet |
1,199 |
0.3 |
511 |
0.1 |
|
Snow |
17,894 |
4.4 |
7,136 |
1.8 |
|
Fog |
2,156 |
0.5 |
1,630 |
0.4 |
|
Rain & fog |
345 |
0.1 |
0 |
0.0 |
|
Sleet & fog |
357 |
0.1 |
9 |
0.0 |
|
Other |
3,257 |
0.8 |
1,666 |
0.4 |
|
Unknown |
4,721 |
1.2 |
2,027 |
0.5 |
|
Total |
402,916 |
100.0 |
385,820 |
100.0 |
As shown in Table 12, the roadway surface conditions data mirrored the
data from atmospheric conditions. Crashes for large trucks occurred
predominantly on dry roads.
Table 12
Crash
Surface Conditions
|
Surface Conditions |
2000
GES Frequency |
2000
GES Percent |
2001
GES Frequency |
2001
GES Percent |
|
Dry |
316,666 |
78.6 |
320,882 |
83.2 |
|
Wet |
53,348 |
13.2 |
48,197 |
12.5 |
|
Snow or slush |
15,624 |
3.9 |
5,171 |
1.3 |
|
Ice |
11,689 |
2.9 |
7,435 |
1.9 |
|
Sand, dirt, oil |
190 |
0.0 |
585 |
0.2 |
|
Other |
487 |
0.1 |
344 |
0.1 |
|
Unknown |
4,913 |
1.2 |
3,204 |
0.8 |
|
Total |
402,917 |
100.0 |
385,818 |
100.0 |
The lighting conditions under which these crashes
occurred are shown in Table
13. The predominant lighting condition for large truck
crashes was daylight.
Table 13
Crash Lighting
Conditions
|
Light Conditions |
2000
GES Frequency |
2000
GES Percent |
2001
GES Frequency |
2001
GES Percent |
|
Daylight |
320,490 |
79.5 |
314,861 |
81.6 |
|
Dark |
32,602 |
8.1 |
27,898 |
7.2 |
|
Dark, but lighted |
33,452 |
8.3 |
28,987 |
7.5 |
|
Dawn |
9,500 |
2.4 |
7,656 |
2.0 |
|
Dusk |
4,245 |
1.1 |
4,745 |
1.2 |
|
Unknown |
2,628 |
0.7 |
1,673 |
0.4 |
|
Total |
402,917 |
100.0 |
385,820 |
100.0 |
The GES crash data file provided information about the characteristics
of each large truck crash. While not as detailed as the data retrieved from the
LTCCS, this data provided useful information about the kinematic environment
where crashes occur and the severity of the crashes.
The GES
Variable First Harmful Event describes the first property damaging or injury
producing event in the crash. This variable identifies the type of crash such
as, vehicle-to-vehicle, single-vehicle crash, or other type. Table 14 provides data on the first
harmful event for large trucks crashes as listed in the 2001 and 2002 GES data
file. The most harmful event in a large percentage of crashes was collision
with a Vehicle in Transport. This value
described vehicle-to-vehicle crashes between moving vehicles. The percentages
of crashes involving large trucks within this category in 2000 and 2001 were
74.0% and 76.7%, respectively.
Table 14
First
Harmful Event
|
First Harmful Event |
2000
GES Frequency |
2000
GES Percent |
2001
GES Frequency |
2001
GES Percent |
|
Non-collision |
|
|
|
|
|
Rollover/overturn |
12,644 |
3.1 |
11,292 |
2.9 |
|
Fire/explosion |
2,568 |
0.6 |
1,507 |
0.4 |
|
Jackknife |
4,251 |
1.1 |
3,121 |
0.8 |
|
Non-collision injury |
69 |
0.0 |
41 |
0.0 |
|
Road surface irregularity |
10 |
0.0 |
56 |
0.0 |
|
Other non-collision |
13,603 |
3.4 |
19,815 |
5.1 |
|
Thrown/falling object |
291 |
0.1 |
297 |
0.1 |
|
Collision with object not fixed |
|
|
|
|
|
Pedestrian |
1,672 |
0.4 |
910 |
0.2 |
|
Cycle/cyclist |
681 |
0.2 |
641 |
0.2 |
|
Train |
685 |
0.2 |
292 |
0.1 |
|
Animal |
4,419 |
1.1 |
4,482 |
1.2 |
|
Vehicle in transport |
298,207 |
74.0 |
295,774 |
76.7 |
|
Parked vehicle |
18,501 |
4.6 |
15,905 |
4.1 |
|
Other non-motorist |
16 |
0.0 |
246 |
0.1 |
|
Other object not fixed |
4,273 |
1.1 |
2,275 |
0.6 |
|
Object not fixed no description |
425 |
0.1 |
36 |
0.0 |
|
Collision with fixed object |
|
|
|
|
|
Ground |
1,209 |
0.3 |
45 |
0.0 |
|
Building |
592 |
0.1 |
649 |
0.2 |
|
Impact attenuator |
388 |
0.1 |
50 |
0.0 |
|
Bridge structure |
2,436 |
0.6 |
511 |
0.1 |
|
Guard rail |
4,651 |
1.2 |
4,551 |
1.2 |
|
Traffic barrier |
2,070 |
0.5 |
2,314 |
0.6 |
|
Post/pole/support |
11,365 |
2.8 |
6,333 |
1.6 |
|
Culvert/ditch |
1,995 |
0.5 |
2,768 |
0.7 |
|
Curb |
803 |
0.2 |
587 |
0.2 |
|
Embankment |
1,521 |
0.4 |
1,716 |
0.4 |
|
Fence |
2,083 |
0.5 |
676 |
0.2 |
|
Wall |
885 |
0.2 |
384 |
0.1 |
|
Fire hydrant |
1,876 |
0.5 |
875 |
0.2 |
|
Shrubbery/bush |
97 |
0.0 |
268 |
0.1 |
|
Tree |
2,953 |
0.7 |
1,524 |
0.4 |
|
Boulder |
92 |
0.0 |
119 |
0.0 |
|
Other/Unknown |
|
|
|
|
|
Other fixed object |
5,524 |
1.4 |
5,383 |
1.4 |
|
Unknown |
62 |
0.0 |
378 |
0.1 |
|
Total |
402,917 |
100.0 |
385,821 |
100.0 |
To support the development of distinct tiers of the
most critical data elements, real world crash data from the LTCCS were
analyzed to facilitate determining the most beneficial types of recorded data
to reconstruct crashes involving large trucks. The profile of large truck
crashes established through the use of NASS GES data was used to select crashes
from the NHTSA/FMCSA LTCCS.
The LTCCS is the first national study to determine the reasons and associated
factors contributing to serious large truck crashes. Using this information,
agencies within the US Department of Transportation (USDOT) and others could
gain an understanding of crashes and work to implement effective
countermeasures to reduce the occurrence and severity of these crashes.
In
the LTCCS, researchers and State truck inspectors collected information on a
sample of large truck crashes. The NASS-trained researchers worked in unison
with state inspectors at a crash scene to investigate the facts and causes of
the truck-involved crash. The NASS-trained researchers worked with state
inspectors at a crash scene to investigate the facts and causes of the
truck-involved crash. NASS researchers depended on the voluntary participation
and cooperation of law enforcement agencies, hospitals, physicians, medical
examiners, coroners, tow yard operators, garages, vehicle storage facilities,
and the individuals involved in crashes. Cooperation was established with
police agencies and hospitals to provide copies or transcripts of official
records. Tow yards, police impound yards, and crash involved parties were
contacted to obtain permission to inspect vehicles. Personal or telephone
contact was made with interviewees to obtain information about occupant
characteristics and crash circumstances.
A specific set of data was retrieved from each LTCCS
case. Data acquired in each case included, but was not limited to:
·
First Harmful Event
·
Case Summary by Investigator
·
Critical Pre-Crash Event
·
Violations Charged
·
Critical Reason for Critical Event
·
Attempted Avoidance Maneuver
·
Scene Diagram
·
Relation to Roadway
·
Police Reported Travel Speed
·
Relation to Junction
The
selection of crash cases from the LTCCS was a critical step in the development
tiers of data elements for an EDR. The GES profile of large truck crashes
previously developed was used to select a similar profile of cases from the
LTCCS. The ideal situation would be for the LTCCS case profile to match the GES
crash profile previously established. Since the processing of all LTCCS data
was not complete at the time of this effort, the cases used for this analysis
were those that successfully passed all quality assurance steps within the
LTCCS as of March 2003.
The case assessment involved filtering the
available cases by crash type. The crash type variable and configuration codes
in the LTCCS and NASS GES files are identical, which allowed a comparison of
crash populations in both files. Only 213 crash cases were initially available
for use in this assessment. An initial review of these cases reduced the number
of cases to 180. Cases were dropped due to incomplete quality assurance checks,
or the truck was not an active participant in the crash, such as when a truck
is parked on the side of the road with the engine off and no driver present. A
second round of case reviews eliminated further cases. Since the LTCCS had not
completed the release of all data, a number of cases were withdrawn for further
quality assurance procedures.
The final number of LTCCS cases for the EDR
assessment was 133. The description of the crash
compiled by the investigator and the scene diagram were critical in the
identification of data elements for an EDR. Each individual case provided input
for a list of data elements that would assist in the reconstruction of that
case. The summing of the data elements for the various cases would show which
elements would have the most utility in the various crash categories and which
elements would be the least useful.
The
distribution of the crash types and configurations included in the sample was
examined to determine the fit with the previously developed GES profile. Table 15 illustrates the final distribution of the crash types
in the LTCCS cases.
In
the profile established from the GES data, the four most numerous crash
categories were:
·
Same Trafficway, Same Direction
·
Changing Trafficway, Vehicle Turning
·
Single Driver
·
Miscellaneous (Backing)
In
the population of LTCCS cases, these rash categories were the same. Yet, the
remaining three categories (Same Trafficway, Opposite Direction; No Impact; and
Intersecting Paths (Vehicle Damage)) were not in the same order in both crash
profiles. As a result, they were represented in the final LTCCS cases, but not
in the same order.
In
the profile of LTCCS cases, there was an under-representation of Same
Trafficway, Same Direction cases. These cases are typically rear-end or
sideswipe/angle crashes. Although these types were underrepresented, they
comprised a sufficient number for use in the assessment. Also, the No Impact
crash types were not present in the LTCCS cases. These crashes typically
included jack-knife crashes, comprising a small but significant population of
the large truck crash population. Given these constraints, the match of the
LTCCS cases to the GES Crash profile was adequate for a clinical analysis that
would be used to determine tiers of data element for an EDR, in addition to
other information sources.
Table 15
Sample
of Cases from the LTCCS
|
Cat. No. |
Code |
Category |
Configuration |
GES
Percentage 2000/2001 |
Frequency |
Percent |
|
|
- |
0 |
No Impact |
N/A |
|
0 |
|
|
|
|
|
|
Total: No Impact |
4.9/6.8 |
0 |
0.0 |
|
|
I |
1 |
Single Driver |
A: Right Roadside Departure |
|
12 |
|
|
|
|
6 |
Single Driver |
B: Left Roadside Departure |
|
8 |
||
|
|
11 |
Single Drive r |
C: Forward Impact |
|
7 |
||
|
|
|
|
Total: Single Driver |
15.9/11.6 |
27 |
20.3 |
|
|
II |
20 |
Same Trafficway, Same Direction |
D: Rear End |
|
24 |
|
|
|
II |
34 |
Same, Same Direction |
E: Forward Impact |
|
1 |
||
|
II |
44 |
Same e Dir |
F: Sideswipe/Angle |
|
11 |
||
|
II |
Total: Same Trafficway,
Same Direction |
41.9/43.2 |
36 |
27.1 |
|||
|
III |
50 |
Same Trafficway, Opposite Direction |
G: Head on |
|
4 |
|
|
|
III |
54 |
Same |
H: Forward Impact |
|
1 |
||
|
III |
64 |
S |
I: Sideswipe/Angle |
|
2 |
||
|
III |
Total: Same Trafficway, Opposite Direction |
3.8/5.1 |
7 |
5.3 |
|||
|
IV |
68 |
Changing Trafficway, Vehicle Turning |
J: Turn Across Path |
|
17 |
|
|
|
IV |
76 |
Vehicle Turning |
K: Turn Into Path |
|
11 |
||
|
IV |
Total: Changing
Trafficway, Vehicle Turning |
17.4/16.7 |
28 |
21.0 |
|||
|
V |
86 |
Intersecting Paths (Vehicle damage) |
L: Straight Paths |
|
12 |
|
|
|
V |
|
|
Total: Intersecting
Paths |
3.1/2.5 |
12 |
9.0 |
|
|
VI |
92 |
Miscellaneous |
M: Backing |
|
23 |
|
|
|
VI |
|
|
Total: Miscellaneous |
12.9/14.0 |
23 |
17.3 |
|
|
|
|
|
99.9*/99.9* |
133 |
100.0 |
||
*Sum not equal to 100% due to rounding.
The goal of the analysis of LTCCS cases was to develop
a set of data elements for an EDR that would permit the reconstruction crashes
involving large trucks. The elements recorded from the LTCCS cases are shown in
Table 16.
Table 16
Data from LTCCS Cases
|
Form Type |
Variable Number |
|
General Vehicle |
7
Body Type 11 Police Reported Travel Speed 17 Violations Charged 20 Relation to Roadway 21 Relation to Junction 25 Number of Travel Lanes 30 Roadway Alignment 31 Roadway Profile 32 Roadway Surface Type 33 Roadway Surface Condition 40 Light Condition 41 Atmospheric Condition 44 Manner of Collision 45 First Harmful Event 48 Rollover 49 Rollover Initiation Type 50 Location of Rollover Initiation 54 Fire Occurrence 55 Origin of Fire |
|
Crash Event Assessment |
4 Precrash Movement 5 Critical Precrash Event 6 Critical Reason for Critical Event 7 Attempted Avoidance Maneuver 10 Crash Type |
|
Investigators Description of Crash |
|
|
Driver/Surrogate
Description of Crash Event |
|
|
Crash Diagram |
|
In order to support the development of EDR data
element tiers, individual LTCCS cases were examined to determine what data
would provide information that could lead to the reconstruction of each crash
with a high degree of confidence. The cases included information on the
environment, driver actions, and vehicle kinematics that may have caused or
contributed to the crashes. While many of the data elements included on the list
are readily available on existing vehicles and may be acquired by a number of
different means, some data elements are not readily available on all large
trucks. For example, vehicle speed may be acquired through a number of
different means depending on the equipment on the vehicle, which may include:
·
Read-out of vehicle
speed sensor
·
Acquisition of speed
from Global Positioning System (GPS) data
·
Calculation of speed
from vehicle engine speed, gear engaged, and vehicle weight
Other situations exist where the
technology is well established and referenced directly. Each manufacturer may
use different means of acquiring the specific data elements. Also, the accuracy
of the data from data sources may be questionable depending on its use. For
instance, GPS provides information as
it pertains to the receivers antenna as it moves under the GPS satellites.
Concerning GPS-received heading data, it may be erroneously equated to vehicle
heading. The GPS provides the heading of the antenna, which may not be the direction
of the vehicle. This situation is most prevalent when there are big slip
angles, as found in a sliding turn or spin-out.
The summation of the data from the analysis of the
entire population of cases provided a listing of the frequency that a specific
data element occurred in the accident reports for the
reconstruction of the 133 crash cases. A total of 45 data elements were
identified in this analysis. The occurrence in the summed data ranged from 100%
to 0.8%. Table
17 lists the data elements in decreasing order of their
occurrence in the cases.
There was a drop-off in the data element frequency
after the first nine data elements. The remaining data elements have lower
frequency of occurrence values, since this information would be needed to
define specific crashes. The initial set of nine data elements would primarily
be used to describe the initial conditions of the vehicle before the crash
(vehicle speed, path, heading), the actions of the driver (throttle, brake,
steering position history) and the vehicle kinematics during the crash
(lateral, longitudinal tractor accelerations). The tenth data element in the
list was video imaging in front of the truck cab, which may be useful for the
detection of by the other vehicles involved in a crash.
Important
information about the assessment of the data elements is summarized below:
·
A time standard
by which all data can be linked is critically important in an EDR. The
established time standard allows the construction of a crash timeline during
the crash reconstruction effort.
·
Two data
elements that could be provided by onboard safety systems include vehicle
headway from Forward Collision Warning Systems (FCWS) and lane position from
Lane Departure Warning Systems (LDWS). These technologies would not be
available on all large trucks.
·
While video
imaging from the front of the vehicle was high on the listing of data elements,
the imaging of other aspects did not appear high in the listing.
·
Many of the
elements that are easily accessible on the vehicle data bus were not high on
the priority listing developed in this task. Also, conventional data such as
headlight status, engine speed, and transmission gear engaged could be easily
obtained.
·
While tractor
acceleration appears on a high percentage of cases, trailer acceleration does
not. This is primarily due to the dynamics of combination vehicles and the
crash types; the acceleration of the trailer is primarily important in cases
where the driver loses control, or the vehicle jackknifes. In other situations,
the dynamics and acceleration of the combined tractor and trailer are
essentially the same.
·
The data
elements listed in Table 17 were based on engineering judgment in analyzing the
LTCCS data to determine which data elements would have been useful in
reconstructing each crash in the set of 133 crashes.
Table
17
Data Elements and Frequency of Occurrence in LTCCS Case Analysis
|
Rank |
Data Element |
Frequency
(%) |
Possible Data Source |
|
1 |
Time Standard |
100.0 |
Real time
clock chip in EDR |
|
2 |
Vehicle Speed |
99.2 |
Speed
Sensor/Vehicle Network |
|
3 |
Vehicle Path |
99.2 |
GPS |
|
4 |
Throttle Position History |
96.8 |
Engine
ECU/Pedal Sensor/Vehicle Network |
|
5 |
Brake Position History |
96.8 |
Brake
position sensor/ABS ECU/Vehicle Network |
|
6 |
Steering Position History |
96.8 |
Steering
wheel position sensor |
|
7 |
Vehicle Heading |
96.0 |
GPS |
|
8 |
Acceleration Tractor Longitudinal |
96.0 |
Accelerometer/ECU
tractor |
|
9 |
Acceleration Tractor Lateral |
95.2 |
Accelerometer/ECU
tractor |
|
10 |
Video Imaging Vehicle Front |
49.6 |
Video camera |
|
11 |
Vehicle Lane Position |
16.8 |
Lane
tracking system |
|
12 |
Vehicle Headway |
11.2 |
Automatic
Cruise Control - Collision Warning System |
|
13 |
Brake System Pressure |
10.4 |
Pressure Sensor/ABS ECU/Vehicle Network |
|
14 |
Acceleration Tractor Vertical |
10.4 |
Accelerometer/ECU-
tractor |
|
15 |
Yaw Angle/Rate |
8.8 |
Yaw sensor
gyro chip |
|
16 |
Brake Stroke |
4.8 |
Brake stroke
sensor |
|
17 |
Roll Angle/Rate |
4.8 |
Roll/Tilt
sensor gyro chip |
|
18 |
Video Imaging Vehicle Rear |
4.8 |
Video camera |
|
19 |
Video Imaging Vehicle Right |
4.8 |
Video camera |
|
20 |
Video Imaging Vehicle Left |
4.8 |
Video camera |
|
21 |
Turn Signal Status |
4.0 |
Switch
Sensor/Engine ECU |
|
22 |
Transmission Gear Engaged |
3.2 |
Gear Sensor
/Transmission ECU/Vehicle Network |
|
23 |
Warning Light Status |
3.2 |
Switch Sensor/Engine
ECU |
|
24 |
Brake System Status |
2.4 |
ABS
ECU/Brake Pedal Sensor/Vehicle Network |
|
25 |
Engine Speed |
2.4 |
Engine
ECU/Vehicle Network |
|
26 |
Driver Fatigue Status |
2.4 |
Driver
fatigue sensor/PERCLOS |
|
27 |
Acceleration Trailer Vertical |
2.4 |
Accelerometer/ECU
trailer |
|
28 |
Acceleration Trailer Longitudinal |
2.4 |
Accelerometer/ECU
trailer |
|
29 |
Side Object Detection |
1.6 |
Collision
Warning System |
|
30 |
Video Imaging Vehicle Left Rear |
1.6 |
Video camera |
|
31 |
Video Imaging Vehicle Left Front |
1.6 |
Video camera |
|
32 |
Video Imaging Driver |
1.6 |
Video camera |
|
33 |
Headlight Status |
0.8 |
Switch
Sensor/Dash ECU |
|
34 |
Four-Way Flasher Status |
0.8 |
Switch
Sensor/Dash ECU |
|
35 |
Horn Use/Status |
0.8 |
Switch
Sensor/Dash ECU |
|
36 |
Running Light Status |
0.8 |
Switch
Sensor/Dash ECU |
|
37 |
Tire Pressure Status |
0.8 |
Central Tire
Inflation System |
|
38 |
Trailer Speed |
0.8 |
GPS |
|
39 |
Trailer Path |
0.8 |
GPS |
|
40 |
Trailer Heading |
0.8 |
GPS |
|
41 |
Driver Eye Position |
0.8 |
Eye Tracking
System |
|
42 |
Vehicle Distance to Intersection |
0.8 |
GPS |
|
43 |
Roadway Surface Friction |
0.8 |
Surface Friction
Sensor |
|
44 |
Acceleration Trailer Lateral |
0.8 |
Accelerometer/ECU
trailer |
|
45 |
Video Imaging Vehicle Right Rear |
0.8 |
Video camera |
In order
to develop a rationale for the inclusion of specific data elements in an EDR,
the basis of their use in crash reconstruction was investigated. Large truck
crashes were analyzed in the time frame from 2000 to 2001. GES data was
reviewed to develop a profile of crashes by vehicle body type. The profile
indicated that crashes conforming to the Same Trafficway, Same Direction
crash category was the most common for large trucks. Other major crash
categories included Changing Trafficway, Vehicle Turning, and Single
Driver.
The
profile of crashes from the GES data was used to select similar crash cases from
the LTCCS. The analysis of the LTCCS cases focused on the identification of
data on vehicle, driver, and environmental conditions along with the actions of
other drivers that could be recorded on an EDR to facilitate the reconstruction
of the crash. The analysis of the LTCCS data produced a list of 45 candidate
data elements for an EDR.
The purpose of Task 2 was to review past and ongoing efforts in EDR
development. While Task 1 provided a list of useful data elements for crash
reconstruction, the review of past and ongoing EDR development efforts provided
additional, valuable information on the data elements recommended by various
government agencies, researchers, and other organizations. In order to compile a
complete set of all data crash elements to thoroughly analyze crashes involving
CMVs, several sources with information on EDR data elements and criteria were
examined, which included publications, projects, standards, and other criteria.
A literature review was conducted to research past and ongoing EDR
efforts. The following types of documents were reviewed:
·
EDR WG Findings
·
Government documents
·
Technical papers
·
Articles from
periodicals
·
Industry standards and
recommended practices
·
Manufacturers
specifications
EDRs have been used in the aviation industry for several years; therefore, the majority of information collected from these sources was based on aviation practices, aviation experiences, or attempts to transfer aviation EDR knowledge to highway vehicle applications. Other sources focused on work that is currently underway with both light vehicles and large trucks. Several references discussed the survivability, electrical, and mechanical issues involved with automotive EDRs. Other references presented a broader discussion of EDRs and related non-technical issues. Some provided historical information on EDRs and views on data ownership, privacy, and proper use of collected data.
Existing recommendations and other government-backed
research were compiled and compared to categorize what data elements have been
recommended or used in research.
·
NHTSA EDR WG Vol. 1
General Data Element List
·
NHTSA EDR WG Vol. 1 Top 10 Data Element List
·
NHTSA EDR WG Report:
Vol. 2 Supplemental Findings for Trucks, Motorcoaches, and School Buses)
·
NTSB Recommendations (NTSB Document H-99-53)
·
TRB Recommendations
(listed in NHTSA EDR WG Report)
·
FHWA Recommendations
·
National Aeronautical
and Space Administration (NASA) Jet Propulsion Laboratories (JPL) Advanced Airbag Technology Assessment
·
ATA TMC Recommended
Practice 1214
·
NHTSA Experimental
Safety Vehicle Data Elements
·
NHTSA Light Vehicle
Naturalistic Type Driving Study Data Elements
·
Data Elements from
Intelligent Vehicle Initiative (IVI) Field Operational Tests Volvo
·
Data Elements from IVI
Field Operational Tests Freightliner
·
Data Elements from IVI
Field Operational Tests Mack
·
Data Elements from IVI
Field Operational Tests Drowsy Driver Study
·
NHSTA Automatic
Collision Notification (ACN) Field Operational Test (FOT) Data Elements
·
ComCARE Alliance ACN
Recommendations
Throughout
these documents, several of the same data elements may be referred to by
different names. Data elements with slightly different names, but the same
physical meaning, were combined. In addition, data elements with similar names
were combined when possible.
During the timeframe of this project, the Institute of Electrical and
Electronic Engineers (IEEE) and SAE were working on EDR standards. The IEEE
P1616 WG was working on developing a standard, Motor Vehicle Event Data
Recorders (MVEDRs), that will contain data element and interface definitions.
It will define a standard for various EDR manufacturers to produce data in the
same format. The SAE Vehicle Event Data Interface Committee (J1698-1) has
working to establish a common format for the display and presentation of the
data recorded by an EDR. It is also considering common data definitions for
specific data elements, as well as other aspects of EDR standardization. The
initial version of this standard documented current industry practices. Data
standardization would aid in the process of easily identifying, interpreting,
and comparing data retrieved from vehicles.
The findings of the NHTSA T&B EDR WG provided the most
comprehensive examination of EDR functionality, which served as the foundation
for this project. The NHTSA report, EDR
Volume II Supplemental Findings for Trucks, Motorcoaches, and School Buses
(May 2002) presented the output of collaboration between many government
and industry stakeholders. The EDR WGs objective was to facilitate the
collection and utilization of collision avoidance and crashworthiness data from
on-board EDRs. The T&B EDR WG consisted of NTSB experts, EDR manufacturers,
academia, and other government organizations that assessed the need to obtain
EDR data for describing crashes involving CMVs. This group of experts
prioritized data elements that should be included in EDRs for CMVs into three
lists: Priority 1, 2, and 3 (optional).
The
T&B EDR WG determined that twenty-eight data elements should be included in
EDRs for CMVs. These data elements were subdivided into the following lists:
·
The Priority 1 data
elements included:
1.
Acceleration, X (Longitudinal)
2.
Acceleration, Y (Lateral)
3.
Acceleration, Z (Vertical)
4.
Accelerator Pedal Position
5.
Antilock Brake System Status (ABS)
6.
Automatic Transmission Gear Selection
7.
Belt Status (driver)
8.
Brake Position History and Status (Service Pedal, Emergency, Trailer)
9.
Engine RPM
10.
Identification
11.
Time/Date
12.
Vehicle Speed
13.
Wheel Speeds
·
The Priority 2 data
elements included:
1.
Air Bag Deploy Time
2.
Air Bag Lamp Status
3.
Air Bag Status
4.
Battery Voltage
5.
Cruise Control (and Auto Distance)
6.
Heading
7.
Lamp Status
8.
Retarder System Status
9.
School Bus Warning Lamp Status
10.
Steering Wheel Angle
11.
Traction Control
12.
Turn Signal/Hazard Operation
13.
Windshield Wiper Status
·
The optional data
elements included:
1.
Digital Imaging
2.
Vehicle Load
These
lists of data elements formed the basis for the Tier 1 and Tier 2 lists of data
elements for this project. This information served as the foundation for
further research and analysis of crash data.
The following summary
presents an overview of the overall T&B EDR WG findings in their report:
·
In the current fleet of
large vehicles, very few employ EDR technology.
·
Manufacturers of
aftermarket EDRs have had limited success in deploying EDR technology into
large vehicle fleets.
·
Many manufacturers of
engines for use in large vehicles have included memory modules in the engines
electronic control unit (ECU). To date, the data recorded are primarily for
fleet management use.
·
The NTSB has used engine
control module (ECM) data to support crash investigations.
·
The Working Group
defined 28 data variables for inclusion in large vehicle EDRs.
·
Thirteen data variables
were defined as Priority 1.
·
The Working Group
established a set of survivability guidelines specifically tailored for large
vehicle application.
·
The Working Group
established some guidelines for defining when data should be recorded in a
crash event.
·
The Working Group
identified several areas that require additional research. Funding for research
and development of emerging EDR technologies is required.
·
EDRs have the potential
to greatly improve truck, motorcoach, and school bus vehicle safety.
MODEL MINIMUM UNIFORM CRASH CRITERIA DATA ELEMENTS REVIEW
Another way of determining data elements for crash reconstruction was to examine the data elements specified by the Model Minimum Uniform Crash Criteria (MMUCC). The MMUC is a minimum set of crash data elements established by some of Americas most prominent traffic safety experts. The MMUCC defines crash data elements relevant to injury control and highway and traffic safety, and it sets voluntary guidelines to help states collect consistent reliable crash information.
The MMUCC was used to determine how many of these data elements could be obtained from an EDR. Specifically, each data element was examined to determine the possibility recording that data element from an EDR and how the data would be obtained.
Of the 113 MMUCC data elements, 57 data elements have
the potential of being recorded by an EDR. Although only approximately 50% of
the MMUCC could be recorded, an EDR would assist the crash researcher and
compliment the data collected at crash scenes. Several data elements would
require cooperative data sharing with responsible jurisdictions and
municipalities to determine geographical information system (GIS) data. Some
jurisdictions would not have this geo-coded information.
IN-VEHICLE NETWORK DATA ELEMENTS REVIEW
Many data elements are available on the truck data buses or in-vehicle
data networks. Two in-vehicle network specifications were examined:
1.
SAE J1587 Electronic
Data Interchange Between Microcomputer Systems in Heavy-Duty Vehicle
Applications (Low-Speed Network)
2.
SAE J1939 Recommended
Practice for Control and Communications Network for On-Highway Equipment
(High-Speed Network)
These specifications listed the data elements potentially available in
an in-vehicle data network.
Of the 982 data elements reserved in SAE J1587 and J1939, 82 elements are currently available or will be available within five years. Of the 436 data elements having potential merit in an EDR, 71 are currently available on newly produced vehicle networks.
ON-BOARD LAND-VEHICLE MAYDAY REPORTING INTERFACE REVIEW
SAE Document J2313, On-Board Land-Vehicle Mayday Reporting Interface
was reviewed to determine which data elements defined in the standard are also
useful in crash reconstruction. This document defined the messages and data
elements used for Mayday ACN systems. The majority of the data elements would
be useful for crash reconstruction, since most of this data conveys crash and
vehicle occupant data.
The review of the aforementioned projects,
publications, specifications, and criteria provided important information
regarding the feasibility and usefulness of the data elements to fully describe
the crash characteristics. This review resulted in a complete list of 571 EDR
data elements.
TASK 3 DEVELOP FUNCTIONAL SPECIFICATIONS
Using the complete list of 571 potential data elements that could be
recorded by an EDR, crash analyses results, and previous and ongoing EDR
information, EDR data elements were defined in detail that would comprise a
list of Tier 1, 2, and 3 data elements for thoroughly analyzing crashes
involving CMVs. These data elements would facilitate crash reconstruction and
enhance the understanding of crashes involving large trucks.
Tier
1 The minimum required elements for an EDR on
CMVs:
·
Acceleration
(Longitudinal, Lateral, and Vertical)
·
Accelerator Pedal
Position/Time History
·
Brake
Status/Pressure/Time History (includes Antilock Brake System)
·
Engine Speed
·
Seat Belt Status
·
Steering Wheel
Angle/Time History
·
Time/Date Standard
·
Transmission Gear
Selection
·
Vehicle Identification
·
Vehicle Path (GPS)
·
Vehicle Speed
·
Wheel Speeds
Tier 2 Additional data
elements to those in Tier 1 that would permit further analysis of crashes
involving CMVs:
·
Airbag Status/Deployment
·
Angular Rate Yaw, Pitch, and
Roll (Stability Control)
·
Battery Voltage
·
Cruise Control Status
·
Engine Retarder System
Status
·
Headlight Status/Running
Light Status
·
Traction Control Status
·
Vehicle Load
·
Warning Light/Turn
Signal Status
·
Windshield Wiper Status
Tier 3 included data elements
in addition to Tier 1 and 2 data elements, as well as:
·
Brake Stroke
·
Brake System Pressure
·
Distance to Intersection
·
Driver Eye Glance
Position
·
Driver Fatigue Status
·
Horn Use / Status
·
Roadway Surface Friction
·
Running Light Status
·
Side Object Detector
·
Tire Pressure
·
Truck Headway
·
Truck Lane Position
·
Video Imaging Driver
·
Video Imaging Roadside
Environment
These tiers were established by reviewing the complete list of 571 data
elements along with recommended data elements from the T&B EDR WG and other
experts. Furthermore, the frequency of occurrence information associated with
each data element from the analysis of crash cases from the LTCCS was used to
develop these tiers. The three tiers of
priority crash data elements were established to provide valuable information
for future designs of crash EDRs for large trucks.
DATA ELEMENT COST-EFFECTIVENESS ANALYSIS
Determining the availability and cost of data sources
for each data element in the three tiers was complex due to the many different
options and cost ranges of data sources available on trucks. Many data elements
are available on truck data buses or in-vehicle data networks. In-vehicle data
networks are used to report vehicle-operating conditions from ECUs gathering
data from sensors already on the trucks. Therefore, the recording of
information from the in-vehicle data networks, SAE J1708/J1587 and SAE J1939,
would be low or no cost. Other data
elements are basic on/off or discrete types of signals from switches, which
can be cost-effectively recorded in an EDR.
Several data elements require costly data sources,
such as GPS receivers, on-board intelligent vehicle safety systems, and video
cameras. Although GPS units and many onboard safety systems are becoming more
common on commercial vehicles, the use of these systems is not widespread
throughout the trucking industry. If available on large trucks, these systems
are often directly connected to the in-vehicle network; therefore, an EDR could
be programmed to record data from these systems without incurring additional
recurrent costs.
An EDR with
the Tier 1 and 2 data elements would be able to record the major vehicle
dynamics and operational conditions of a large truck at the time surrounding a
crash. Many of these data elements may have the dual-functionality for both
crash reconstruction and fleet management applications.
An EDR can only provide useful
crash information if it functions properly and survives crashes. As a result,
an analysis of common industry practices for in-vehicle electronics and for embedded
data acquisition systems was conducted relating to the function and
survivability of an EDR on large trucks. Yet, further research, system design,
and testing would be required to confirm and validate the following information
on large truck EDR functional specifications.
Algorithms refer to the method and
procedure used when an EDR detects an event trigger. Developing a detailed
algorithm for event trigger detection depends on the electronic hardware,
sensors, microprocessor speed and type, and software design of an EDR.
Crash events involving a large
change in velocity or a large acceleration/deceleration pulse over a short
period of time would be relatively easy to detect and trigger EDR data storage
on large trucks. However, many crashes involving large trucks may not be easily
detected due to weight differences between light and heavy vehicles. Also,
vehicle dynamics are important when articulated vehicles are involved in
crashes. For example, if a light vehicle hits a trucks trailer perpendicular
to the long axis of the trailer at the trailers rear axle, an EDR on the
tractor may not detect the impact. In order to detect trailer impacts, a second
EDR could be mounted in the trailer. As a result, additional crashes may be
detected with two EDRs that could record the acceleration and angular rotation
of both the tractor and trailer. An EDR on the trailer could be set up to only
record trailer dynamics and communicate with the primary EDR.
A false alarm may occur when an
event is incorrectly recorded as a crash if the crash detection parameters are
not adjusted properly. Also, crash-like events that occur during normal truck
operations may be difficult to filter out. For example, coupling a tractor to a
fully loaded trailer may be recorded as a rear-impact to the tractor. In order
to minimize the number of false alarms, reliable data pertaining to large truck
vehicle dynamics and operating parameters in various types of crashes, such as
magnitude, duration, and frequency, should be used for the development of crash
detection algorithms.
A manual feature could also be
used to trigger an EDR recording. A driver-initiated event could be recorded
when a driver presses a manual record button. An EDR would record the time that
the button was pressed and store all vehicle dynamics and operational data in
its memory for the time surrounding the event. Since EDR data are stored in a
circular buffer, the recorded pre-trigger data would most likely capture the
event.
Several types
of vehicle sensor/system failures could trigger a vehicle-initiated event on an
EDR. For example, a sudden loss of brake system air pressure could trigger an
EDR recording event. These failures could potentially indicate a crash
causation factor if the system failure event occurs relatively close to the
time an actual crash event occurs. Since many different types of system failure
event triggers could overcomplicate the overall EDR system, this type of event
is recommended to be recorded only when key system failures occur that affect
the safe operation of the vehicle.
A summary of
the different event algorithms is shown in Table 18.
Table 18
Summary of EDR Event Algorithms
|
Event Type |
Examples |
Advantages |
Disadvantages |
|
Crash Events |
Head-on, side-impact,
rear-impact, offset, rollovers, jackknives, etc. |
Main use of EDR Many types of
crash event data can be recorded, which could be used in Automatic Collision
Notification (ACN) systems. |
Some crash types may be
difficult to detect due to the difference in mass between passengers cars and
large trucks. |
|
Driver-Initiated Events |
Panic button for pedestrian
impacts, abnormal vehicle operation, minor vehicle-to-vehicle crashes, etc. |
Supplemental use of EDR
Drivers can initiate the recording of the vehicle state during an abnormal
event, and can record events when witnesses are not present at scene. |
Other EDR events may be
overwritten. Drivers may not remember to use an EDR recording
button due to infrequent use. Drivers may be unwilling to admit fault when an
event has occurred and not use the button. Drivers may not have time to search for the button
due to driving demands. |
|
Vehicle-Initiated Events |
Vehicle-operation based: Failures in brake system air pressure,
fuel pressure, ABS, engine operation, or the charging/starting system, etc. |
Supplemental use of EDR
Fleet management may be enhanced by early diagnosis of vehicle problems. |
Other EDR events may be
overwritten, and it adds complexity to overall event determination software. |
A summary of the operational temperature data from SAE
J1455 is shown in Table
19. Based on the operating temperature ranges for
automotive grade electronics and crash survivability, the interior of the
vehicle is recommended as an optimum location for an EDR in a large truck.
Therefore, the EDR should survive the normal operating temperature range in a
vehicle cab of -40°C (-40°F) to 85°C (185°F).
Table 19
SAE J1455 Temperature Extremes for Heavy-Duty Truck/Tractor
|
Location |
Temperatures Minimum |
Temperatures
Operating |
Temperatures
Maximum |
|
Engine
compartment |
-40°C |
- - - |
56°C over ambient |
|
Engine
compartment |
-40°C |
- - - |
222°C over ambient |
|
Engine
compartment |
-40°C |
- - - |
56°C over ambient |
|
Interior floor* |
-40°C
(-40°F) |
27°C
(81°F) |
75°C
(167°F) |
|
Interior instrument panel |
-40°C
(-40°F) |
24°C
(75°F) |
85°C
(185°F) |
|
Interior headliner |
-40°C |
24°C |
79°C |
|
Interior bunk area |
-40°C |
24°C |
93°C |
|
Interior storage area |
-40°C |
24°C |
74°C |
|
Chassis forward |
-40°C |
- - - |
121°C |
|
Chassis rear |
-40°C |
- - - |
93°C |
* Shaded rows represent ideal EDR mounting locations (interior-floor and interior-instrument panel).
SAE J1211 states that the most extreme humidity occurs
at 98% RH at 38°C (100°F) and references the following three methods of
humidity testing:
1.
Active
temperature/humidity cycling under accelerated conditions (most common)
2.
10-day soak at 95% RH
and 38°C (100°F) temperature
3.
8 to 24 hour exposure at
103.4 kPa (15 psi) in a pressure vessel
Electronic
equipment mounted on a vehicle chassis, exterior, and underhood may be exposed
to a salt spray environment from sea breezes and road salt. If an EDR is
mounted inside the truck cab, salt exposure would be limited. If an EDR is
mounted on the exterior of the truck, then the SAE J1455 Salt Atmosphere
Standard would be recommended for EDR testing.
Immersion and Splash (Water, Chemicals, and Oils) SAE J1455
Immersion and splash by other fluids is a common
problem on the exterior of the vehicle. During normal operation, an exterior
mounted EDR would come in contact with any fluid used by the tractor such as
diesel fuel, coolant, oil, power steering fluid, hydraulic brake fluid, and
windshield washer fluid. An externally mounted EDR should also withstand
exposure to road spray and the contaminants that are transported in the spray.
If an EDR is mounted inside the cab, exposure to these
fluids is less likely, yet possible. Many truck drivers carry beverages and
spare quantities of tractor fluids inside the cab, increasing the potential of
leaks or spills in the area around an EDR. SAE Standards J1455 and J1211
specify a similar test method for immersion and spray.
Steam Cleaning/Pressure Washing SAE J1455
The intense heat from cleaning sprays and the caustic
nature of chemical agents used in washing solutions create a severe environment
for devices and associated wiring and connectors mounted in the engine
compartment, on the chassis, and on exterior areas. Exterior mounted EDRs
should be tested in accordance with SAE J1455.
Fungi may affect a systems performance by degrading
the material and causing physical/chemical changes or electrical failures. Two keys to avoiding susceptibility to
fungus are to minimize the nutritive value of EDR materials, particularly, the
case, paint, connectors, and seals, and to ensure that an EDR is properly
sealed.
Dust, Sand, and Gravel Bombardment SAE J1455
Dust creates a harsh environment for chassis,
underhood, and exterior-mounted devices, and it can be a long-term problem in
interior locations, such as under the dash and seats. Sand is an important
environmental consideration for components mounted in the chassis, exterior,
and underhood areas. Bombardment by gravel is significant for chassis, lower
engine, and exterior-mounted electronic components.
Two recommended dust test methods for an interior
mounted EDR are:
1.
The EDR is placed in a
dust chamber where dust is moved to maintain a concentration of 0.88 grams per
cubic meter (g/m3) for a period of 24 hours, or
2.
4.54 kg of powered
cement is placed in a 91.4 cm cubical box. At intervals of 15 minutes, the dust
is agitated by compressed air for 2 seconds, and blown in a downward direction.
The cycle is repeated for 5 hours.
The effects of altitude on electronic systems include:
1.
Reduction in convection
heat transfer efficiency
2.
Change in mechanical
stress on parts with internal cavities
3.
Reduction in the high
voltage breakdown characteristics of systems with electrically stressed
insulators, conductors, or air surfaces
In accordance with the SAE J1455 Standard, an EDR
should operate in altitudes up to 3.6 km (12,000 ft), and survive non-operating
up to 12.2 km (40,000 ft). These conditions correspond to absolute pressures of
62.0 kPa (9 psi) and 18.6 kPa (2.7 psi), respectively.
Mechanical Vibration SAE J1455
Mechanical vibration is another key factor for vehicle
electronic component design in a large truck environment. The amount of
vibration varies significantly depending on the EDR mounting location and
method, vehicle suspension, and types of roads traversed. SAE Standard J1455
provides examples of vibration environments in commercial vehicles. Section 4.9
of that standard explains how to test a device for mechanical vibration.
Three recommended mechanical vibration test methods
are:
1.
Swept Sine Vibration
Tests An EDR is placed on a shaker and ramped from low frequency to high
frequency with an amplitude seen at the mounting location of the vehicle. The
frequency ramp should be slow enough to allow for mechanical resonances to
occur. This test should be performed in all three orthogonal axes.
2.
Random Vibration Tests
If the power spectral density (PSD) of the mounting area is known, then a
random vibration test can be performed. An EDR is mounted to a shaker, and a
test excitation frequency containing the PSD of the mounting location is
applied to the EDR.
3.
Vehicle Tests With the
EDR mounted in the correct location on the vehicle, the vehicle is driven over
several different test tracks to simulate real-world conditions. While this is
a good final test, it is not an effective test during initial shakedown,
because intermittent failures often go away when the vibration excitation is
removed.
The automotive shock environment can be divided into
four classes:
1.
Shipping and Handling
Shocks These shocks are similar to those encountered in non-vehicle
applications. Two tests are recommended for this type of shock: 1) Handling
Drop Test, which impacts the device on three orthogonally different faces, and
2) Shipping Drop Test, which tests the device packed in its shipping container
on various corners and faces.
2.
Installation Harness
Shock A common production line practice is lifting and carrying components by
their harness. Therefore, the harness design should incorporate secure
fastening and suitable strain relief. The test would repeatedly swing the EDR
by its wiring harness and check the harness and its strain relief area for
damage.
3.
Operational Shock The
shocks encountered during a vehicles life caused by curbs, potholes, etc., can
be severe. These shocks vary widely in amplitude, duration, and number, and
test conditions can only be generally simulated. Trailer coupling or low speed
loading dock collision provides a severe horizontal shock in truck operation.
The complex profile used to derive an operational shock test consists of a rise
in the roadway followed by a depression or dip. Upon leaving the dip at 48
km/hr (30 mph), the vehicle can become airborne. Severe shock may be
experienced when the vehicle returns to the roadway. Another severe vertical
shock is encountered in dump body trucks when loaded with rock and soil.
4.
Crash Shock This shock
is included as an operating environment for safety systems. The operational
requirements for these systems are limited to longitudinal shock at the present
time. Only limited and preliminary data on the effects of crash shock on the
vehicle electronic component environment are available. However, a
representative deceleration profile for a 48 km/hr (30 mph) barrier crash is
shown in Figure 13 of SAE J1455. The following factors vary with each
installation and should be considered in a pretest analysis:
a.
Vehicle electronic
component
b.
Mounting system
c.
Structure of the
associated vehicle (crash distance, rate of collapse, etc.)
d.
Particular engine
package
e.
Direction of crash
Full details for these operating specifications and
related tests are given in SAE Standard J1455.
Steady-State Electrical Characteristics SAE J1455
A normal
operating vehicle will maintain supply voltages ranging from +11 to +16 VDC.
However, under certain conditions, the voltage may fall to approximately 9 VDC.
This voltage drop might occur in an idling vehicle with a large electrical load
and a fully discharged battery. Therefore, depending upon the application, the
designer/user may specify the +9 to +16 VDC range. For specific vehicle
electronic components, such as those components that must function during
engine start, voltage may be specified as appropriate.
Cold cranking
of an engine with a partially depleted battery at -40°C (-40°F) can reduce the
nominal 12 V to 6.5 V minimum at the battery terminals. At the starter motor
terminals, because of the voltage drop on the battery cabling, the voltage
typically varies sinusoidally from 5.2 to 7.8 V at a low frequency about 4 Hz
(56 rpm, 8 cylinder engine) due to the engine compression load variation during
the crank cycle.
Another
condition affecting the DC voltage supply occurs when the voltage regulator
fails, causing the alternator to drive the system at 18 V or higher. Extended
18 V operation will eventually cause boil-off of the battery electrolyte,
resulting in voltages as high as 75 to 130 V. Other charging system failures
can result in lower than normal battery voltages. General steady-state voltage
regulation characteristics for 12 V and 24 V systems are shown in Table 20.
Garages and
emergency road services have been known to utilize 24 V sources for emergency
starts, and there are reports of 36 V being used for this purpose. High
voltages such as these are applied for up to 5 minutes and sometimes with
reverse polarity. The use of voltages that exceed the vehicle system voltage
can damage electrical components, and the higher the voltage, the greater the
likelihood of damage.
These
specifications should be used for testing an EDR. In addition, combinations of
temperatures and supply voltages that are designed to represent the worst case
stresses on control components are recommended. See SAE Standard J1455, Section
4.11.1 for more details.
Table 20
SAE J1455 12-Volt and 24-Volt Operating Characteristics
|
Electrical
Parameter |
12-Volt
Systems |
24-Volt
Systems |
|
Normal operating vehicle |
16 V maximum 14.2 V nominal 9 V minimum |
32 V maximum 28.4 V nominal 18 V minimum |
|
Cold cranking at -40 °C (-40 °F) |
At the starter motor terminals: 5.2 V to 7.8 V At the battery terminals: 6.5 V minimum |
At the starter motor terminals: 10.6 V to 16.0 V At the battery terminals: 13.3 V minimum |
|
Jumper starts |
+24 V |
+48 V |
|
Reverse polarity |
-12 V |
-24 V |
|
Voltage regulator failure |
9 to 18 V |
18 to 36 V |
|
Battery electrolyte boil-off |
75 to 130 V |
75 to 130 V |
Voltage Transients SAE J1455
Three
principal types of transients are encountered on truck/tractor wire
harnesses: load dump, inductive
switching, and mutual coupling, which generally occur simultaneously. Table 21 describes these transient waveforms for both 12- and
24-volt systems.
Load Dump Load dump occurs when the
alternator load is abruptly reduced. This sudden reduction in current causes
the alternator to generate a positive voltage spike. The most severe case load
dump is caused by disconnecting a discharged battery when the alternator is
operated at a rated load. Using the discharged battery load to create the load
dump creates the worst situation for two reasons:
1.
The battery normally
acts like a capacitor and absorbs transient energy when it is in the circuit.
2.
The partially discharged
battery forms the single greatest load on the alternator. Therefore,
disconnecting it creates the greatest possible step load change.
Inductive Switching Inductive
transients are caused by solenoid, motor field, air conditioning clutch, and
ignition system switching, which occur during vehicle operation whenever an
inductive accessory is turned off. The severity depends on the magnitude of
switched inductive load and line impedance.
Mutual Coupling Coupling is
a mechanism that is capable of introducing transients into circuits not
directly connected to the transient source. Three general coupling modes are in
the vehicle: magnetic, capacitive, and conductive. Coupling problems are caused
by long harnesses, non-shielded conductors, and common ground return
impedances. When a number of wires are bundled into a harness and a step change
in current or voltage occurs, inductive or capacitive coupling between the
conductor experiencing the change and the other wires can result. Multiple
ground returns with different potentials cause "ground loops" and
result in conductive coupling of transients.
Table 21
SAE J1455 Transient Voltage Characteristics
|
Test
Type |
Lines |
Source
(Ohms) |
Rise (µS) |
Open
Circuit Response (12 VDC) |
Open
Circuit Response (24 VDC) |
Repetition |
Energy |
|
Load Dump |
Power |
0.4 |
100 |
14 + 86e(-2.5t) |
28 + 122e(-2.5t) |
5 pulses @ 10s interval |
Note 2 Note 3 |
|
Inductive Switching |
Input/Output (I/O) (Note1) |
20 |
1 |
14 ± |
14 ± |
10 pulses @ 1s interval |
Note 1 Note 3 |
|
Mutual Coupling |
I/O All |
50 |
1 |
14 ± |
14 ± |
10 pulses @ 1s interval |
Note 3 |
Note 1: This transient applies to those I/O lines which may be connected to unclamped inductive loads. In addition, the energy available will be 0.5LI2 , where I is the current through the inductor amps and L is the inductance in henries.
Note 2: The alternator is capable of outputting much more energy than can be absorbed by used electronic clamping devices. Therefore, when clamping devices are used in electronic modules, caution must be used in the design of the vehicle electrical system to insure the energy limitations of each clamping device are observed.
Note 3: The transient waveforms described previously in mathematical form may actually be implemented by diode allowing a DC and transient voltage.
Electrical Noise and Electrostatic/Electromagnetic Compatibility Characteristics
Normal
accessory noise and vehicle transceiver feedback are two common interference
sources that are covered under SAE Standards J1113 sections on conducted
susceptibility, listed in Table
22. Electromagnetic Interference (EMI) is
electromagnetic energy which interrupts, obstructs, or otherwise degrades or
limits the effective performance of components, subsystems, and systems. EMI
may be transient, intermittent, or continuous in nature arising from sources
such as transmitters or other equipment located either on-board or adjacent to
the vehicle.
Table
22
Various SAE Electrical Noise Test Standards
|
SAE
Standard Number |
Standard
Title |
|
J1113-1 |
Electromagnetic Compatibility Measurement Procedures and Limits for Vehicle Components (Except Aircraft) (60 Hz to 18 GHz) |
|
J1113-2 |
Electromagnetic Compatibility Measurement Procedures and Limits for Vehicle Components (Except Aircraft) Conducted Immunity, 30 HZ to 250 kHz--All Leads |
|
J1113-3 |
Conducted Immunity, 250 kHz to 5000 MHz, Direct Injection of Radio Frequency (RF) Power |
|
J1113-4 |
Immunity to Radiated Electromagnetic Fields Bulk Current Injection (BCI) Method |
|
J1113-11 |
Immunity to Conducted Transients on Power Leads |
|
J1113-12 |
Electrical Interference by Conduction and Coupling Coupling Clamp and Chattering Relay |
|
J1113-13 |
Electromagnetic Compatibility Measurement Procedure for Vehicle Components Part 13 Immunity to Electrostatic Discharge |
|
J1113-21 |
Electromagnetic Compatibility Measurement Procedure for Vehicle Components Part 21 Immunity to Electromagnetic Fields, 10 kHz to 18 GHz, Absorber-Lined Chamber |
|
J1113-22 |
Electromagnetic Compatibility Measurement Procedure for Vehicle Components Part 22 Immunity to Radiated Magnetic Fields from Power Lines |
|
J1113-23 |
Electromagnetic Compatibility Measurement Procedure for Vehicle Components Immunity to Radiated Electromagnetic Fields, 10 kHz to 200 MHz, Strip Line Method |
|
J1113-24 |
Immunity to Radiated Electromagnetic Fields; 10 kHz to 200 MHz Crawford TEM Cell and 10 kHz to 5 GHz Wideband TEM Cell |
|
J1113-25 |
Electromagnetic Compatibility Measurement Procedure for Vehicle Components Immunity to Radiated Electromagnetic Fields, 10 KHz to 500 MHz - Tri-Plate Line Method |
|
J1113-26 |
Electromagnetic Compatibility Measurement Procedure for Vehicle Components Immunity to Alternating Current (AC) Power Line Electric Fields |
|
J1113-27 |
Electromagnetic Compatibility Measurement Procedure for Vehicle Components Part 27 Immunity to Radiated Electromagnetic Fields |
|
J1113-41 |
Limits and Methods of Measurement of Radio Disturbance Characteristics of Components and Modules for the Protection of Receivers used On-Board Vehicles |
|
J1113-42 |
Electromagnetic Compatibility Component Test Procedure Part 42 Conducted Transient Emissions |
With an internal back-up power source, an EDR would
only record data from its internal sensors. Using a rechargeable internal battery or internal
ultra-capacitor, an EDR could receive power if primary power is interrupted for
approximately one minute. These internal back-up power sources solutions are
industry-standard, cost-effective, and mature technologies.
Using
removable data storage media may be problematic, since devices, such as mini
floppy drives or hard disk drives, are susceptible to dust, moisture,
mechanical shock, and vibration. Using removable solid state media, such as
PCMCIA cards or solid state hard disks, are also problematic, since these
devices may be jarred loose from vehicle vibration or the impact from a crash
event. In addition, the connectors used for these devices may corrode over
time.
A non-removable
solid state memory, such as Electrically-Erasable Programmable Read-Only Memory
(EEPROM) or Flash Read Only Memory (ROM) should ensure data availability for
future downloading. Battery-backed EDR memory could be used to store this data;
however, the current state-of-the-art in non-volatile solid-state memory
eliminates the need for a battery. Memory technologies, such as EEPROM or Flash
Memory, will store its data for an indefinite period of time. The data remains
in the memory until it is actively changed or erased.
Size, Weight, and Mounting Method
The size and
weight of an EDR are subject to limitations. A trade-off between small size and
heat dissipation may be necessary to allow an EDR to operate at the desired
high-end of the operating temperature range. Light units are advantageous,
because they will not add appreciable weight to the vehicle. In addition, a
lighter unit will likely be subject to less inertia when the vehicle undergoes
severe vibration or deceleration due to a crash. Since an EDR must also be able
to survive the large truck environment and a crash, a balance between weight
and ruggedness should be considered for EDR survivability.
EDR mounting
involves two main concerns:
1.
Accurate recording of data If an EDR
is mounted in an area prone to vibration or towards the front of the vehicle,
it will be subject to a crash pulse different from one felt by vehicle
occupants. As a result, an EDR mounted in a rigid area in or near the occupant
compartment is recommended for a more accurate crash pulse history to be
recorded.
2.
Prevention of EDR damage in crash events Since an
EDR should be able to withstand a significant crash force, it should be
installed in a location that is not prone to extensive crash damage. An EDR
must function after the event trigger to record and store post-trigger data
until it can be off-loaded. If a severe impact occurs directly in the area
where an EDR is installed, an EDR mounting method could be designed to release
the EDR from the mounting surface.
In addition to
environmental conditions, EDRs must survive crashes. Table 23 lists survivability parameters for EDRs. For
comparison, the table includes the IEEE P1616 WG Preliminary Draft
Recommendations, NHTSA Truck & Bus Findings, Federal Motor Vehicle Safety
Standards (FMVSS) 208/214 views on data survivability, NTSB specifications for
the survivability for aircraft Flight Data/Cockpit Voice Recorders, and
recommended survivability requirements for locomotive and rail passenger EDRs.
Further research and testing of these survivability parameters would be
required prior to advocating a particular survivability parameter.
Table 23
EDR Data Survivability Parameters
|
Parameter |
IEEE P1616 MVEDR Draft
Recommendation |
NHTSA Truck & Bus Findings |
FMVSS 208/214 |
Flight Data/Cockpit Voice Recorder |
Locomotive Event Recorder |
Rail Passenger Equipment Recorder |
|
Impact Shock |
150 g, 50 ms, ½ sine wave pulse, applied separately in each of the
three principal axes. Rationale: The NHTSA Pulse (300 g, 50 ms)
results in a ΔV of 165 mph and a crush of 75 inches. The FMVSS Pulse (50
g, 150 ms) results in a ΔV of 82 mph and a crush of 110 inches. The recommended pulse of 150 g, 50
ms results in a ΔV of 82 mph and a crush of 38 inches, which may be more
reasonable. Applying the pulse in all three
axes is necessary because an EDR may be mounted in any orientation. |
300 g, 50 ms |
50 g, 150 ms |
3400 g for 6.5 ms, ½ sine wave
pulse |
23 g for 250 ms or equivalent
energy |
55 g peak, 100 ms duration, 2.85
g-sec area under curve energy, ½ sine crash pulse, separately in the
direction of each of the three principal axes. |
|
Penetration |
5 ft. drop of 100 lbs., 0.25 inch diameter point, separately in each
of the three principal axes. Rationale: The FDR drop has a potential energy
of 6,783 J. The light rail recorder has a potential energy of 339 J. The
NHTSA T&B drop has a potential energy of 814 J. The recommended pulse has a
potential energy of 678 J, which is twice the amount of energy as the light
rail drop and uses a lighter weight which will make the testing easier. The recommended 0.25 inch diameter
point is consistent with an EDRs from other modes. 814 J over a 0.5 inch diameter
point results in a 4,145 J/ in2 impact. 678 J over a 0.25 inch
diameter point results in a 13,812 J/ in2 impact which is 3.33
times higher than the NHTSA recommendation. |
3 ft. drop of 200 lbs., 0.5 inch
diameter point |
Not specified |
10 ft. drop of 500 lbs., 0.05 in2
point (0.25 inch diameter) |
Not required |
Penetration 50 lbs. (23 kg) weight
with a protruding 0.25 inch (6.4 mm) diameter steel pin dropped from a height
of 5.0 ft. (1.5 m) separately in the
direction of each of the three principle axes. |
|
Static Crush |
1,500 lbf, 5 minutes, each face and diagonals Rationale: Given that the weight of a large
truck is much less than a rail engine or aircraft, a reduction of the applied
force makes sense, but 500 lbs. may be low. Adding the force application
duration adds consistency to the recommendation. Diagonals add completeness,
and crush forces may be applied
perpendicular to an EDR faces in a crash. |
500 lbs. |
Possibly some, depending on
location of EDR |
5,000 lbf, 5 min., faces and
diagonals |
25,000 lbf for 5 min., each face |
25,000 lbs. (110 kN) for 5 minutes
separately in the direction of each of the three principle axes. |
|
Fire Resistance, High |
1,000 °C (1,832°F) for 5 minutes Rationale: Recordings of crashes with fires
may be important because the vehicle and other evidence may be destroyed. 30 minutes was the estimated
duration of an intense vehicle fire. |
Small percentage of crashes, not
specified |
Not specified |
1,100 °C (2012°F) for 30 min, 100%
coverage, 50k BTU/ ft2hour |
1,000 °C (1,832°F) for 60 minutes |
1,200°F (650°C) for 30 minutes, followed by 570°F (300°C)
for 60 minutes, followed by 212°F
(100°C) for 5 hours. |
|
Fire Resistance, Low |
260 °C (500°F) for 30 minutes Rationale: Recordings of crashes with fires
may be important because the vehicle and other evidence may be destroyed. 30 minutes was the estimated
duration of an intense vehicle fire. |
Small percentage of crashes, not
specified |
Not specified |
260 °C (500°F), 10 hours |
260 °C (500°F) for 10 hours |
1,200°F (650°C) for 30 minutes, followed by 570°F (300°C) for
60 minutes, followed by 212°F (100°C) for
5 hours. |
|
Immersion, Fuel/Fluids |
Immersion in all of the following individually for 8 hours: gasoline,
diesel fuel, lubricating oil, water, fire extinguishing fluids. Rationale: These fluids are commonly found in
or around the vehicle. An 8-hour period was chosen as it is likely that after
a crash, the fluids would be removed/flushed/cleaned up. EDR electrical components may be
damaged if fluids reach its interior circuitry and the unit is powered up. |
Shallow immersion for a short
period of time |
Not specified |
48 hours |
48 hours |
Immersion in any of the following
individually for 48 hours: Grade 1 and 2 diesel fuel, regular and salt water,
and lubricating oil. |
|
Battery/Power |
Enough reserve power to complete all data acquisition after a trigger
event has been detected (30-60 seconds) Data should remain intact for 1 year Rationale: Thirty to sixty seconds of reserve
power should allow an EDR to record the entire event including the
post-trigger part of the event. In the case of a severe crash, the vehicles
power system can be damaged and the in-vehicle data network will go down, but
an EDRs internal sensors will continue to monitor the vehicles dynamics
until the vehicle comes to a complete stop. Non-volatile memory (memory that
does not require external power) is typically low-cost and commonly used in
all aspects of electronics. |
Enough reserve to record for 1
minute Data should remain intact for 30
days |
As long as it takes to record it As long as it takes to retrieve it |
6 year shelf life 30 day operation |
Not specified |
Not specified |
*Sources: 1) Summary of Findings by the NHTSA EDR WG Volume II Supplemental Findings for Trucks, Motorcoaches, and School Buses, DOT HS 809432, May 2002.
2) Design of a Crash Survivable Locomotive Event Recorder, Thomas Stevens, Robert E. Onley, and Robert S. Morich, L-3 Communications, Electrodynamics, Inc., Rolling Meadows, IL.
3)
NTSB FDR /Cockpit Voice Recorder (CVR) Website:
http://www.ntsb.gov/aviation/CVR_FDR.htm.
4) A New Event Recorder Standard for Passenger Rail Equipment, Christopher J. Holliday, P.E., STV, Incorporated.
5) EDR Survivability Crosswalk Comparing T&B EDR WG Findings with Proposal to Tie Survivability to FMVSS Crash Tests, J. Hinch (NHTSA), S. McComb (NTSB), IEEE P1616 WG Presentation, April 2003.
Figure
1 shows a simple block that includes the major EDR
connections throughout the vehicle.
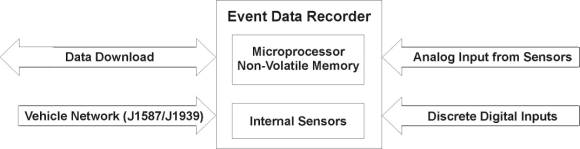
Figure 1
EDR System Connectivity Block Diagram
As shown in Figure 1, five types
of data measurement connections or sensors make up the entire EDR measuring
chain:
1. Internal
Sensors Internal sensors are located inside an EDR when data
is not available to be read directly from other sources on the truck. These
sensors typically include: longitudinal, lateral, and vertical accelerometers;
yaw, pitch, and roll angular sensors; and a GPS receiver, if the vehicle does
not have a GPS receiver on its in-vehicle data network.
2. Analog Input
from Sensors Analog input from sensors refers to the electrical
output of analog (i.e., continuous, 1 to 5 Volts Direct Current (VDC)) sensors
that can be located in various locations on the vehicle. An example of an
analog sensor is the throttle position sensor.
Any analog inputs
from the vehicle directly into an EDR are undesirable, because the analog
signal may degrade due to long wire lengths, which will reduce the signal
strength, place an additional load on the sensor which may alter its reading,
and increase noise on the line. Most analog sensors used for engine control
have data placed on the in-vehicle data network.
3. Discrete
Digital Inputs Discrete digital inputs refer to connections
throughout the vehicle to on/off devices. Brake lights, turn signals, horn,
running lights, and headlights are examples of this type of signal. Determining
the state of discrete digital inputs is cost effective and will not effect the
operation of the device. The wiring required to tap into the signals is simple,
and the physical connection can be made by the use of a simple crimp-style wire
splice.
4. Vehicle
Network Another cost effective method of obtaining vehicle
data is via the vehicle network. Two in-vehicle data networks commonly found in
large trucks: 1) a low-speed network (SAE J1708/J1587) and 2) a high-speed
network (SAE J1939). When both networks are present, the low-speed network
conveys general vehicle operating data, and the high-speed network carries
engine control data.
Obtaining
vehicle data via the vehicle networks is cost efficient, because one network
interface allows all operating data available on the network to be accessed by
an EDR. Since the network protocols are well-defined and standardized, the same
network messages will exist across many types of vehicles.
5.
Data Download Data
download is the process of transferring data stored in an EDR to another
device, which serves as the only two-way connection interface. Using a data
download connection, an EDR receives commands from a device (e.g., a laptop),
and transmits data to it. Checksums are transferred by an EDR and analyzed by
the off-loading device to ensure there are no errors in data transmission. In
addition, this link can be used to upload new operating software to an EDR.
This connection is a type of serial link (e.g., RS-232, USB, Firewire, etc.),
which could be a wireless link.
An EDR should operate with minimal driver and fleet manager interaction
unless an EDR provides additional functionality (e.g., daily maintenance or
other operational data). If an EDR detects an internal error, the user should
be notified via an EDR status light initiated when the ignition is turned-on,
and the light should turn off, if error-free. When the user has to off-load EDR
data, then the interaction should be simple and relatively quick.
Interface Configurations and Data Retrieval Process
Three categories of data retrieval
interface configurations can be used to transfer EDR data to another
device:
1.
Wired Data Download This interface
configuration requires a direct connection from an EDR to the device that will
store EDR data. While a direct connection is required, an EDR may be in a
different location than where the download connection is made. For example, an
EDR may be mounted under the driver seat, but the interface connection may be
in the dash. An EDR may also be removed from the vehicle for a direct
connection. Wired data download methods may include: RS-232, Universal Serial
Bus (USB), FireWire, or other serial data transfer methods. Wired data download
methods may include:
a.
RS-232 The RS-232 is an older serial
data communication method, and its ports still exist in laptop and desktop
computers. If the EDR contains an RS-232 port, it should be configured so that
its connection to the data download device (i.e., laptop computer) requires a
standard 9-pin straight-through cable. The EDR should be capable of
transferring data at a rate of 115,200 baud, which is the typical maximum of
RS-232 ports found on computers.
b.
USB The USB is the successor to RS-232 and comes in two
varieties: USB 1.1 and USB 2.0. USB 1.1 supports 12 mega-bits per second (Mbps)
data transfer rate, and USB 2.0 supports 480 Mbps. EDRs can support either
type, and USB 1.1 is fast enough to transfer an entire EDR event in less than
one second. If the EDR contains a USB port, it should have a Type B or Mini
Type B connector.
One
implementation of a USB interface would be to make the EDR appear as a USB mass
storage device. Windowsâ supports
these devices without the installation of special communication drivers. Using
this implementation with the EDR connected to the computer, a folder appears on
the computer screen listing the data files available for download, allowing the
user to drag the files from the EDR folder to a folder located on the computer.
FireWire FireWire is also referred to as
IEEE 1394. It is the newest serial transfer protocol. There are two types of
FireWire: FireWire 400 supports data transfer rates of 400 Mbps, and FireWire
800 supports 800 Mbps. EDRs can support either type, and FireWire is fast
enough to transfer an entire EDR event in less than one second. It should be
noted that FireWire is common on newer Appleâ computers, but
is relatively uncommon on Windows- and Linux-type computers.
If the EDR
contains a FireWire port, it can be configured with either a 6-pin or a 4-pin
FireWire connector. An advantage of a FireWire interface would be to make the
EDR appear as a FireWire mass storage device.
2.
Local Wireless Data Download EDR data may
be transferred to another device via a local wireless communication protocol.
The receiving device is in close proximity (less than 200 ft) to an EDR, and cabling between an EDR and uploading
device is not necessary for data transfer. However, wireless communication
methods cost more than wired methods. Local wireless data download methods may
include: Infrared, Bluetooth, IEEE 802.11b, or other local wireless data
transfer methods.
a.
Infrared Infrared communication is used
by the majority of laptops and personal digital assistants (PDAs). The Infrared
Data Association (IrDA) consortium specifies a way to wirelessly transfer data
via infrared radiation. IrDA devices communicate using infrared Light-Emitting
Diodes (LEDs). The wavelength used is 875 nm ±30 nm (production tolerances).
Receivers utilize PIN photodiodes in generation. There are two
publicly-available IrDA standards. IrDA devices conforming to standards IrDA
1.0 and 1.1 work over distances up to 1.0 m, but they must see each other
directly and be within a 30° viewing angle of each other for successful
communication to occur.
Transmission
speeds for IrDA 1.0 range from 2400 to 115,200 kbps. IrDA v. 1.1 defines speeds
0.576, 1.152, and 4 Mbps. Because the EDR will have a relatively large amount
of data to transfer, a minimum of 115,200 kbps should be supported.
b.
Bluetooth Bluetooth is a new technology
using short-range radio links, intended to replace the cables connecting
portable and/or fixed electronic devices. Bluetooth radio modules operate in
the unlicensed InterStellar Medium (ISM) band at 2.4 GHz, and avoid
interference from other signals by hopping to a new frequency after
transmitting or receiving a packet. Compared with other systems in the same
frequency band, the Bluetooth radio hops faster and uses shorter packets. The
transmission range of Bluetooth is 10 m (33 ft).
c.
IEEE 802.11b IEEE 802.11b, Wi-Fi, uses
radio for its communication medium. It is rapidly gaining acceptance with OEMs
such as Apple, Dell, IBM, and Symbol. While the newer Bluetooth is suitable for
wireless connections within 10 meters, Wi-Fi allows portable devices to be
connected to other systems at distances as great as 100 meters. Wi-Fi supported
data transfer at speeds up to 11 Mbps.
3.
Remote Wireless Data Download Another
method of transferring data from an EDR to another device is via a remote
wireless data download method. Although cabling is not needed between an EDR
and uploading device, wireless communication methods are more costly than wired
data downloads.
Since remote
wireless data download is relatively expensive and would likely be used in
conjunction with a wired or local wireless download method, the remote wireless
modem would be a separate device that communicates with an EDR via a direct, wired,
serial connection (e.g., an RS-232 port). Remote wireless data download methods
may include: radio modems, cellular modems, satellite modems, or other wireless
data transfer methods. ACN is one aspect of an EDR with remote wireless data
download capability and can be used to notify local authorities almost
immediately in the event of a large truck crash. When an EDR detects an event
trigger, the event data could automatically be transmitted to a remote
receiver.
4.
Remote Wireless Data Download A third
method of transferring data from the EDR to another device is via a remote
wireless data download method where the EDR could be thousands of miles away
from a remote receiver. An advantage of using this type of data transfer is
that cabling is not required between the EDR and uploading device to complete a
data transfer. Another aspect of an EDR with remote wireless data download
capability is ACN and can be used to notify local authorities almost
immediately after a crash.
Yet, the ease
of remote data transfer is associated with increased system cost, since
wireless communication methods cost more than wired methods. Due to the high
cost, remote wireless data download would likely be used in conjunction with a
wired or local wireless download method. The remote wireless modem would be a
separate device that communicates with the EDR via a direct, wired, serial
connection (e.g., an RS-232 port).
There are
several types of remote wireless download protocols that can be used in a
standard way. Remote wireless data download methods may include:
a.
Radio Modems Radio modems use a local radio
network to transfer data between devices. The range of these networks is
limited to approximately 10 miles, and a radio modem must be located at both
the EDR and receiver locations. One disadvantage is only one device may
communicate on the network at a time. Another disadvantage is the radio network
communication rate is typically limited to 19.2 kbps, which means that the
transfer of data may take several minutes. Since there is no connect time, a
direct cost is not associated with the transmission of data between devices.
Cellular Modems Cellular modems are cell phones with data transfer
capability. There are several different types of cell modems with different
data rate capabilities and operating modes. Some types of cellular
communication have connect time and/or byte count charges where each EDR data
transfer incurs additional costs. While most of the continental U.S. has
cellular coverage, cellular modem communications do not function in some areas.
b.
Satellite Modems Satellite
modems communicate directly with satellites that are in orbit around the earth.
One satellite system has a data communication rate of 9.6 kbps. However,
satellite communication can be costly due to byte count/connect time charges.
The software protocol used to
retrieve data from an EDR protocol will vary depending upon the communication
interface present in an EDR. Two data retrieval protocols are:
1.
Mass Storage Emulation Whenever
possible, the transfer of EDR event data files should appear as a file transfer
from a mass storage device (e.g., hard disk). For instance, if an EDR has a USB
interface, the computer would be connected to it and a folder would appear on
the computer where the user would drag EDR event files onto the computers hard
disk. This approach is possible for USB and FireWire interfaces and would not
require any additional software to be loaded on the receiving device. If
RS-232, IrDA, IEEE 802.11b, or Bluetooth are used, then this mode would be
possible, but the receiving device would need an EDR communication driver when
it detects the presence of an EDR.
2.
Interactive Communication When remote
wireless data download protocols are being used, an EDR can contact the remote
site or vice versa.
One method of
assuring vehicle owner access only is through use of an EDR system password to
extract data, as specified in the TMC RP 1212, Personal Computer (PC) to User Interface Recommendations for Electronic
Engines Data.
An EDR data file format has the
flexibility for EDR manufacturers to include new data elements in their EDRs
where the data retrieval software would be able to receive and properly process
the new data types. When an EDR data file has been decoded, the actual event
data can be examined. The EDR data file consists of a series of data records.
Each record represents data for a particular data element and consists of
several fields that completely define the data element. EDR data element
records should follow the format shown in Table
24.
Table 24
EDR Data Element Record Format
|
Field Number |
Description |
Format |
Example |
|
1 |
Data Element Name (abbreviation) |
ASCII string |
AccPos
|
|
2 |
Sampling Rate (in Hz) |
ASCII number |
10 |
|
3 |
Sample Size (bytes per sample) |
ASCII number |
1 |
|
4 |
Resolution (physical unit per bit) |
ASCII number |
0.4 |
|
5 |
Unit of Measure (e.g., psi, deg-f, on/off) |
ASCII string |
% |
|
6 |
Data Unavailable Value (e.g., pre-trigger buffer not
full yet) |
ASCII number |
254 |
|
7 |
Sensor Error/Fault Value (e.g., vehicle network
down) |
ASCII number |
255 |
|
8 |
Sample Number Prior to Event Trigger* |
ASCII number |
150 |
|
9 |
Estimated Time from Sample to Trigger* (in ms) |
ASCII number |
5 |
|
10 |
Number of Samples for This Data Element |
ASCII number |
451 |
|
11 |
Data (a contiguous string of bytes) |
Binary |
N/A |
*EDR Data Record Fields 8 (Sample
Number Prior to Event Trigger) and 9 (Estimated Time from Sample to Trigger)
are used to align the data record with the event trigger time so all EDR data
element records can be time synchronized.
Number of Events Stored in EDR Memory
An EDR is recommended to store three crash events in a multi-event
crash. If three crash events have been recorded, then an EDR could signal the
user via an EDR Status Light that its buffer is full and event data should be
off-loaded. When the data are off-loaded, the events may be manually cleared.
For multi-trigger events, it may require gathering all of the pre-trigger data
(up to 15 seconds before the
first trigger) and all of the post-trigger data.
Multiple Events and Overlap of Events
An EDR may record several events
as illustrated in the following examples:
1.
The vehicle is involved
in a minor crash, but one large enough to trigger an EDR. It proceeds for a
number of seconds and then has another major impact with another vehicle.
Afterward, the vehicle careens off the road and down an embankment.
2.
The driver detects that
the vehicle is operating abnormally and pushes the EDR record button. After
several seconds, a major mechanical failure occurs, the driver looses control
and the vehicle rolls over.
As a result,
for multi-trigger events, gathering pre-trigger data and post-trigger data
would be important.
Two main areas concerning accuracy
issues involve numerical data and timing accuracy. For data obtained from the
vehicle network, the accuracy of the data may be difficult to determine, since
the vehicle sensors and signal conditioning are supplied by the vehicle
manufacturer or an aftermarket system supplier. Accuracy determination can be
made only by examining the functional specifications of the vehicle and its
systems.
The accuracy of an EDRs internal
sensors is more easily controlled, since the sensors can be calibrated during
manufacturing. In addition, accelerometers and angular rotation sensors include
integrated temperature sensors to minimize the effect of changes in
temperature. With factory calibration and temperature compensation, the
internal sensors should have an accuracy of 2% full scale.
Timing accuracy is also important.
The timing of the data received from the in-vehicle network is somewhat
uncontrolled, since the network datas value cannot be correlated to an exact
moment in time. The timing can be roughly estimated between two successive
readings. Internal EDR timing is more clearly defined and controlled, yet the
actual timing of the data will vary slightly from manufacturer to manufacturer.
An EDR manufacturer should publish the sample timing for their EDR for events
to be accurately reconstructed from the data.
Overall, EDR data should be
repeatable. The event timing, event trigger detection, and data from the
internal sensors should be repeatable, since the sensors should produce the
same values given the same input, and the software event trigger detection
algorithms should remain constant over time.
An EDR should be manufactured
using components that remain stable over time and the expected operating
temperature range. The crystals used to regulate data sampling should be high
quality to maintain accurate timing.
Data obtained from the vehicle
network should be repeatable, but since there is no direct control over the
performance of vehicle sensors and other aftermarket equipment which may
provide vehicle network data, this may not necessarily be the case.
System Calibration and Maintenance
An EDR is typically calibrated at
the factory, and all calibration parameters should be stored in an EDRs
non-volatile memory. An EDRs internal sensor electronics (and all other analog
signal conditioning circuitry) should be designed to remain stable over the
expected operating life of a large truck from 5 to 10 years.
An EDR is a sealed unit that would
not typically require regular maintenance, since it would not require internal
or external adjustments. If an EDR fails, the entire unit would likely be
replaced and programmed with the vehicles VIN.
Incorporation with Fleet Management Tools
On-board fleet management tools
include:
·
Vehicle operating data
·
Driver logs
·
Driver and fleet manager
links
These tools are primarily
available in three forms:
1.
Data recorders that
record basic vehicle operating data
2.
Electronic records of
duty status for hours-of-service regulations
3.
Driver data terminals
for fleet operations and logistics applications
Some of these systems are
integrated, yet the majority of these systems are highly customized, closed
systems which are not designed to interact with another manufacturers system.
They do not provide standardized methods to exchange information. Table 25 lists some examples of dual-functionality EDR data
elements.
Table 25
Examples of Dual-Use EDR Technologies
|
Technology Type |
Use in Crash Reconstruction |
Use in Fleet Management & Administration |
Stakeholder Beneficiary |
|
GPS |
Vehicle Path |
Fuel Tax
Determination |
Fleet
Manager |
|
Route
Planning |
Fleet
Manager |
||
|
Proof of
Location |
Driver |
||
|
Accurate
Time |
Fleet
Manager, Driver |
||
|
Longitudinal Acceleration |
Crash Pulse |
Braking
Analysis |
Maintenance
Manager |
|
Vehicle
Dynamics |
Panic Stop
Analysis |
Fleet
Manager |
|
|
Lateral Acceleration |
Crash Pulse |
Roll-Over
Alarm |
Fleet
Manager, Driver |
|
Vehicle
Dynamics |
Drowsy
Driver Alarm |
Fleet
Manager, Driver |
|
|
Vehicle
Databus Communication |
Vehicle
Indicated Speed, VIN |
Various
Operating Parameters |
Maintenance
Manager |
Some fleet management systems
contain data that would be useful to EDRs, such as vehicle location, speed, and
heading data from a GPS data source. One standardized way to transfer GPS data
from a fleet management system to an EDR is by placing the GPS data on the
in-vehicle data network. SAE standards J1587 and J1939-71 specify how GPS data
should be transmitted over the network, and an EDR could be programmed to
receive this data. As a result, one GPS receiver could provide data to the
fleet management system and an EDR. The SAE Standards include messages for
other fleet management functions, including trip data, vehicle maintenance
data, and driver logs.
An EDR may also contain data that
could be useful for fleet management systems. Internal EDR data could be
transmitted to other in-vehicle systems over the in-vehicle data network, SAE
Standards J1587 and J1939-71. Also, the fleet management systems communication
link could be used to transfer EDR data from the vehicle to the fleet managers
home base. For example, if the vehicle was involved in a crash, the event data
could automatically be transmitted to the fleet manager via ACN functionality.
Establishing a link between these two systems could relay crucial data when an
EDR records an event.
Adding new types of data elements into an EDRs event
memory can expand an EDRs functionality; however, the following expandability
aspects could also be addressed:
·
Signal Type Is the signal analog, digital
(discrete), variable frequency, or pulse-wide modulated? Is it available on the
in-vehicle data network?
·
Electrical Interface If the new
data is coming from a wired connection, is it in a voltage range an EDR can
accept? Does the signal require any special conditioning before it can be run
into an EDR? Can the signal be tapped into without affecting the integrity of
the signal?
·
Storage Requirements Does an EDR
have the ability to read the data at the desired sampling rate? Does an EDR
have sufficient memory to store it?
To accommodate additions and
changes to an EDRs functionality, its internal program should be modifiable.
In addition, errors may exist in EDR software, which may be corrected by
uploading a new EDR program by using the same communication interface (wired or
local wireless) used to obtain EDR event data.
An EDR has both program and data
memory. Program memory holds an EDRs internal program of the commands that
gives an EDR its specific functionality. Data memory holds all of an EDRs
event data. When event data is transferred from an EDR to another device, the
event data is read from data memory.
Both the program and data memory
may be the same type or technology, because both memories need to be
non-volatile, i.e., they should be able to retain their values in the event of
a power failure. Battery-backed memory could be used; however, low cost, flash
memory would be beneficial for both program and data memory.
The amount of memory available in
a chip is increasing, and the cost per byte of flash memory is decreasing. To
accommodate memory expandability after an EDR is developed, only two-thirds of
the memory space is recommended to be used with one-third of the memory
available for future use.
Despite planning for future
requirements, obsolescence may occur when an EDRs components are no longer
available from the manufacturer. One way of avoiding this risk is to use
relatively new technologies. Another type of obsolescence may occur when new
technology is installed in the vehicle. For example, existing EDRs may not be
able to read data from a new in-vehicle network protocol without the correct
electrical connection or appropriate electronic drivers.
Of the hundreds of potential
data elements that could be used in an EDR, the following data elements
collected by an EDR can enhance the crash reconstruction process, along with
offering useful data to aid in injury prediction, vehicle defect analysis,
crash causation, and other uses.
Tier
1 The minimum required elements for an EDR on
CMVs:
·
Acceleration
(Longitudinal, Lateral, and Vertical)
·
Accelerator Pedal
Position/Time History
·
Brake
Status/Pressure/Time History (includes Antilock Brake System)
·
Engine Speed
·
Seat Belt Status
·
Steering Wheel
Angle/Time History
·
Time/Date Standard
·
Transmission Gear
Selection
·
Vehicle Identification
·
Vehicle Path (GPS)
·
Vehicle Speed
·
Wheel Speeds
Tier 2 Additional data
elements to those in Tier 1 that would permit further analysis of crashes
involving CMVs:
·
Air bag
Status/Deployment
·
Angular Rate Yaw, Pitch, and
Roll (Stability Control)
·
Battery voltage
·
Cruise Control Status
·
Engine Retarder System
Status
·
Headlight Status/Running
Light Status
·
Traction Control Status
·
Vehicle Load
·
Warning Light/Turn
Signal Status
·
Windshield Wiper Status
Tier 3 additional data
elements to those in Tier 1 and Tier 2:
·
Brake Stroke
·
Brake System Pressure
·
Distance to Intersection
·
Driver Eye Glance
Position
·
Driver Fatigue Status
·
Horn Use / Status
·
Roadway Surface Friction
·
Running Light Status
·
Side Object Detector
·
Tire Pressure
·
Truck Headway
·
Truck Lane Position
·
Video Imaging Driver
·
Video Imaging Roadside
Environment
Two key subsystems, the GPS receiver and vehicle
network connection, allow many data elements to be collected from the same data
source. A connection to the vehicle network gives an EDR access to a wealth of
data elements that are used to report vehicle operating conditions. As a
result, any data on the vehicle network could easily be added to this list.
Several of the other data elements are basic on/off or discrete types of
signals. This type of data can be cost-effectively recorded in an EDR. An EDR
would also contain several internal sensors, such as accelerometers and
rotational motion sensors.
Conceptually, a block diagram for an EDR as described
in this report would look like Figure 2 below.
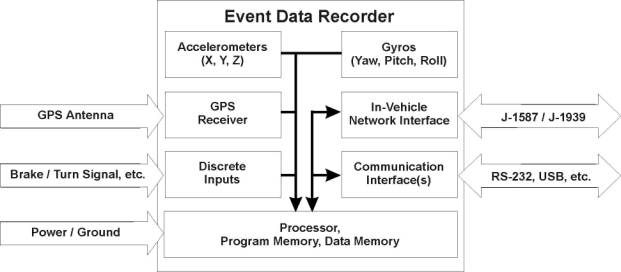
Figure 2
Simplified EDR Block Diagram
The development of an
EDR for large trucks would encompass a wide-range of survivability and
operational parameters. For the environmental and electrical operational
parameters, SAE standards illustrate industrys best practices, yet further
design and testing of a technically accurate and feasible EDR on large trucks
would be necessary to validate the analysis in this report.
The actual development of a technically accurate and economically feasible EDR may be a challenge. However, EDR data has the potential to improve highway safety by aiding research related to driver, passenger, vehicle, and highway safety; improving occupant-protection systems; and enhancing the accuracy of crash reconstructions.