4. CRRAFT Evaluation Results
This chapter describes on the results of the evaluation. The results are organized not in terms of the evaluation activities that were performed, but in terms of the different types of impacts CRRAFT had on the transit agencies. Thus, the subsections describe the results of all evaluation activities that relate to the following topics:
- Impact of CRRAFT on Invoicing and reporting (Hypotheses 1, 2, 3 and 4)
- Impact of CRRAFT on Trip scheduling (Hypotheses 5 and 6)
- Impact of CRRAFT on Trip authorization (Hypothesis 7)
- Impact of CRRAFT on Vehicle maintenance (Hypothesis 8)
- Impact of CRRAFT on Operating efficiency and costs (Hypothesis 9)
- The costs and benefits of CRRAFT (Hypotheses 10 and 11)
- Interagency communication and coordination (Hypothesis 12)
4.1 The Impact of CRRAFT on Invoicing and Reporting
This subsection describes the impact CRRAFT has had on the invoicing and reporting process. It includes the timeline of invoice submissions and the extent to which the submitted invoices contain errors. It also covers the time transit providers spend producing invoices and reports. The extent to which CRRAFT helps the funding agencies research and collect the information they need is also discussed. Associated with this impact are hypotheses 1 through 4.
The transit agencies must submit a months' invoice by the 25th of the following month. For example, the invoice for July 2005 must be submitted by August 25th 2005. Often, the invoices are submitted later than the deadline, the time between the deadline and the actual submission date is called the Submission Lag. When the invoice is submitted, the PTPB reviews it and if any errors are found, they contact the transit agency to solve the problem. Often, this encompasses an invoice re-submission. Once the invoice is accepted by the PTPB, they enter it into their system and process it. When third level approval is given to the invoice, it means the invoice has been approved for payment. Figure 4-1 shows a schematic of this invoice submission, review, and approval process.

Figure 4-1. Invoicing Timeline
4.1.1 Hypothesis 1
Use of the system saves transit providers time invoicing and reporting to funding agencies.
To assess this hypothesis, the Evaluation Team relied on an analysis of the actual invoice submission dates, an answer to one question in the survey to transit agencies, and the interviews and discussions with staff at transit agencies. No quantitative data were collected specifically regarding the time spent preparing invoices. However, the submission dates for all invoices during FY02 and FY04 were collected allowing the Evaluation Team to calculate the Submission Lag as
Submission Lag = Actual initial invoice submission date - Submission deadline
The Submission Lag may be regarded as a proxy for the time required to prepare the invoices because if an invoice is submitted with longer delay it could be assumed that it took longer to prepare it.
The invoice submission dates for some months were missing in several of the providers Logs. As a result, only 82% in FY02 and 80% in FY04 of the expected data points were available. However, the Evaluation Team considered that approximately 80% of data completeness was sufficiently representative to conduct this analysis. Figure 4-2 presents the frequency and cumulative distributions of the Submission Lag before (FY02) and after (FY04) the implementation of CRRAFT.
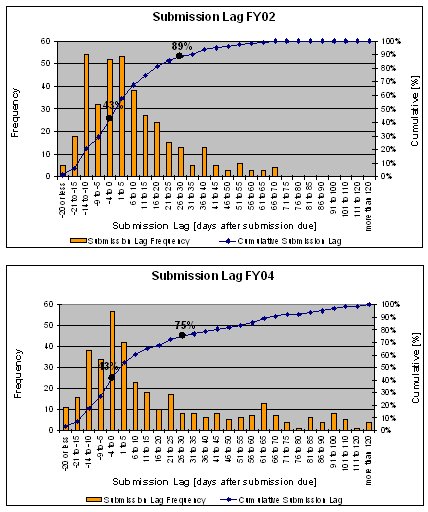
Note: A negative Submission Lag indicates that the
invoice was submitted on-time (before the deadline)
Figure 4-2. Ratings of the Effect of CRRAFT on Time Preparing Invoices/Reports
As observed, the shape of the distributions changed between the two years. In FY02, the frequency distribution is more skewed towards the left, which implies that more invoices were submitted on-time or with less delay than in FY04.
The data show that the same proportion of invoices (43%) was submitted on or before the deadline in both years. However, for the remaining 57% that were submitted late in both years, the average delay in FY02 is 18 days while in FY04 is 36 days. While in FY02, 11% of the invoices were submitted more than 30 days late, in FY04 that number went up to 25%. Furthermore, in FY02 the longest Submission Lag was 70 days while in FY04 it was more than 120 days. Thus, according to the data on Submission Lag, it may be concluded that on average, the time required to prepare invoices in FY04 increased with respect to FY02.
The survey question regarding this topic and the interviews with the transit agencies' staff, provided some insight into this situation. In the CRRAFT survey, transit agency users were asked the question “To what extent do you think the CRRAFT system affects the time you spend preparing the monthly invoices and reports that you must submit?.” Using a five-point rating scale (ranging from one, “It takes a lot longer with CRRAFT” to five, “It takes a lot less time with CRRAFT”, and three means The time required is about the same with or without CRRAFT"), transit agency users were divided on the impact of CRRAFT on the amount of time spent preparing invoices and reports.
The survey results showed that approximately 53% of the respondents thought it took longer to prepare monthly invoices with CRRAFT, about 43% thought it took less time, and about 4% indicated it took about the same amount of time. The distribution of responses is shown in Figure 4-3. To investigate why transit agencies had divided opinions, an analysis was done to examine if there were differences in the invoice preparation time ratings based on the number of trips provided in FY04 and type of route service. (The type of funding was also examined but the sample sizes were deemed too small to make meaningful comparisons.)
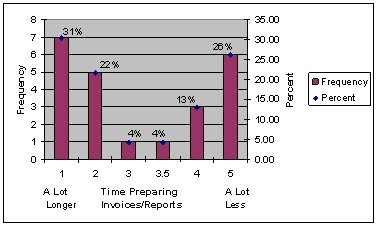
Figure 4-3. Ratings of the Effect of CRRAFT on Time Preparing Invoices/Reports
Figure 4-4 shows the ratings as a function of 2004 ridership. A trend line overlaying the graph slopes to the right and has a negative correlation (R=-0.34), indicating that there is an inverse relationship between number of trips and invoice preparation time rating. In other words, the greater the number of trips a transit agency provided the more likely it was to rate invoice preparation times as taking longer using CRRAFT. Or conversely, transit agencies with fewer riders tended to rate invoice preparation times as being less with CRRAFT.
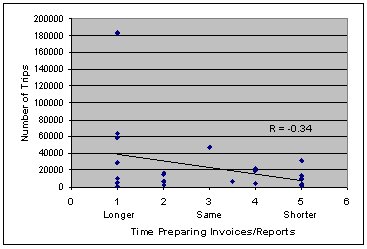
Figure 4-4. Ratings of Time Preparing Invoices for All Transit Agencies
Although the small sample sizes limit the statistical analyses, an analysis was also conducted to investigate whether a relationship existed between invoice preparation ratings and the type of routes (i.e., demand responsive, fixed route, or mixed) a transit agency provided. Examining the survey ratings for invoice preparation time (where one indicates “A lot longer”, three indicates “About the same”, and five indicates “A lot shorter”) as a function of type of route did not explain the differences in invoice preparation time ratings.
As shown in Table 4-1 the average invoice preparation time ratings for transit agencies providing demand responsive routes and mixed route service indicates “the time is about the same” (ratings of 2.93 and 2.94, respectively). Further complicating the analysis was the fact that only a single rating (1.00) was available for transit agencies providing fixed route service. However, when transit agency ridership data were included, a trend became evident for transit agencies providing demand response service. Figure 4-5 (a) and (b) shows the invoice preparation time ratings as a function of the number of trips in 2004. The trend line in Figure 4-5 (a) indicates that the greater the number of trips the more an Agency was inclined to rate invoice preparation times as taking longer with CRRAFT (R=-0.52). Although the small sample size makes the results dubious, Figure 4-5 (b) shows an opposite trend for transit agencies providing both fixed-route and demand-response services (R=0.386).
| Demand Responsive | Fixed Route | Both Types of Services | |
|---|---|---|---|
| Average Invoice Preparation Time Rating* | 2.93 | 1.00 | 2.94 |
| Number of Transit Agencies Responding | 14 | 1 | 8 |
| Table Notes: *Rating between 1 and 5 where 1 indicates “A lot longer”, 3 indicates “About the same”, and 5 indicates “A lot shorter” time to prepare invoices with CRRAFT. | |||
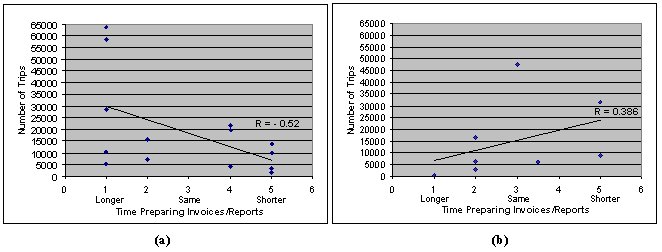
Figure 4-5. Ratings for CRRAFT Invoice Preparation Times for (a) Demand Responsive Only and (b) Mixed Route Service Transit Agencies by Number of Trips
Discussions with CRRAFT stakeholders seem to support these results. Through the interviews, meetings, and discussions with stakeholders the Evaluation Team learned that in preparing monthly invoices, transit agencies must enter different types of ridership information depending on the type of service they offer to their riders. Agencies providing demand responsive route service must enter information on each rider into CRRAFT to build a log of scheduled pick-ups/drop-offs. The CRRAFT planned schedule is then later reconciled with the actual pick-up/drop-off information. Transit agencies with a fixed-route or both types of services require less data entry. In the case of fixed-route service, agencies are required to enter only totals and not the detailed pick-up/drop-off information.
During the interviews and discussions, CRRAFT users also explained that some transit providers are still using and maintaining records in Excel spreadsheets like before they were required to use CRRAFT. As a result, the double record-keeping requires extra resources and may be causing an increase in invoice preparation time and consequently preventing them from submitting invoices on time.Hypothesis assessment
The analysis of invoice submission dates showed that on average, providers submitted their invoices in FY04 (when CRRAFT had already been implemented) with longer delays than in FY02, which may imply that the use of CRRAFT has not facilitated the preparation of their invoices. The survey and discussion with transit agencies yielded that transit agencies with higher ridership and with demand responsive service are more likely to find that their invoice preparation time has increased since the implementation of CRRAFT. The Evaluation Team found that, on average, the use of CRRAFT has not saved transit providers time invoicing and reporting to the PTPB. In fact, transit agencies with higher ridership and demand responsive service may have had the opposite experience and are spending more time preparing invoices after the implementation of CRRAFT.
4.1.2 Hypothesis 2
Use of the system results in funding agencies having faster access to reports.
To assess this hypothesis, the Evaluation Team relied on two questions asked in the survey to transit agencies and in the interviews with NMDOT staff, and the analysis of the actual invoice submission dates. The Submission Lag results presented in the previous section are also indicative of how fast the funding agencies have access to invoices and reports before and after CRRAFT. Funding agencies have access to the information when the invoice and its attached reports are submitted. The funding agencies may observe online the numbers entered by the transit agencies up to some point in the month, but is not until the transit agency finalizes its numbers and submits the invoice that the final figures are known.
As presented in Figure 4-2, the data show that the same proportion of invoices (43%) was submitted on or before the deadline in FY02 and FY04 years. For the remaining 57% that were submitted late in both years, the average delay in FY02 is 18 days while in FY04 is 36 days. These results imply that the funding agencies are not having faster access to invoices and their attached reports, in fact they may be obtaining them with longer delays.
This finding contrasts with the perceptions of NMDOT staff. In the CRRAFT survey for NMDOT users, NMDOT was asked the question “To what extent do you think the CRRAFT system affects whether these monthly invoices and reports are submitted by the submission dates?” Using a five-point rating scale (ranging from “With CRRAFT, a lot fewer reports are submitted by the submission date” to “With CRRAFT, a lot more reports are submitted by the submission date”), NMDOT users felt that with CRRAFT more reports were submitted by the submission dates. NMDOT estimated that before CRRAFT was implemented, about 80% of invoices were submitted by the submission date. Now with the implementation of CRRAFT about 95% of the invoices were being submitted on time. Comparing these perceptions with the results of the data analysis (i.e. only 43% of the invoices in both years were submitted on time), it appears that the staff at the NMDOT were optimistic about the impact of CRRAFT on on-time submission of invoices.
Two similar questions were also posed to the transit agencies. Although their estimates of percentages of invoices submitted on-time does not match the actual number found through the data analysis, their general perception that reports were submitted with longer delay after CRRAFT seems to support the results obtained by the data analysis.
In the transit agency survey, users were asked the question “To what extent do you think the CRRAFT system affects your ability to submit the monthly invoices and reports by the submission dates?” Using a five-point rating scale (ranging from “A lot less likely to submit by the submission date with CRRAFT” to “A lot more likely to submit by the submission date with CRRAFT”), transit agency users were divided on the impact of CRRAFT on submitting invoices and reports by the submission dates.
The survey results shown in Figure 4-6 shows that approximately a third of the respondents thought CRRAFT made it less likely to submit an invoice on-time, a third thought it took about the same amount of time, and a third thought CRRAFT made it more likely to submit by the due date.
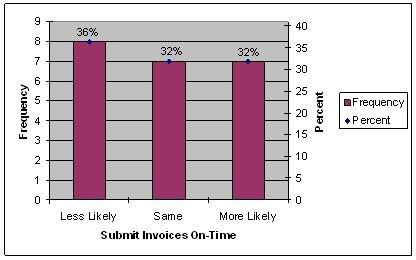
Figure 4-6. Ratings of the Effect of CRRAFT on Ability to Submit Invoices by Submission Date
The CRRAFT users were also asked to estimate the percentage of time invoices were submitted on time both before and after CRRAFT. They were asked:
“What percentage of time do you think these reports were submitted by the submission date before and after you started using CRRAFT?
Before CRRAFT, reports were submitted on time about ___ % of the time
After CRRAFT, reports were submitted on time about ___ % of the time”
Twenty transit agencies provided both before and after CRRAFT percentage estimates. Based on these estimates, Before CRRAFT, reports were submitted on time about 85% of the time. After CRRAFT, reports were submitted on time about 76% of the time.
Hypothesis assessment
Despite the perceptions at NMDOT that more invoices were submitted on-time after CRRAFT implementation, the data show that, in fact, the same percentage of invoices was submitted on-time and that those invoices that are late, are being submitted with longer delays. The perceptions at the transit agencies seem to support the results of the data analysis.
The Evaluation Team found that on average, the use of CRRAFT has not resulted in funding agencies having faster access to reports. With the online system however, funding agencies may be able to monitor the numbers that transit agencies are entering into the system throughout the month, but some agencies seem not to be using the system on a day-to-day basis. Instead, they just enter the data required at the end of the month to submit the invoice.
4.1.3 Hypothesis 3
Reports created by the system are accurate and reliable. Use of the system reduces the time funding agencies spend checking and correcting reports, and reduces money incorrectly allocated or invoiced.
To assess this hypothesis, the Evaluation Team relied on the analysis of the quantitative data regarding the number of errors encountered in invoices, the time spent solving those errors, and the answers to two questions asked in the survey to transit agencies and in the interviews with NMDOT staff.
The PTPB receives the invoices submitted by the transit providers and they often find errors or missing backup information. In that case, the PTPB spends some time solving the problem with the invoice and in several cases a new invoice must be submitted. This review time was calculated as follows:
Review Time = Final Invoice Submission date - Initial invoice submission date
In some cases, when the initial invoice is correct, there is no Review Time. The Evaluation Team reviewed the Invoice Submission Logs to analyze the notes recorded on them regarding errors and problems with the invoices. The Evaluation Team found that the overall number of problems with initial invoices was significantly reduced from 20% of the cases in FY02 to 11% of the cases in FY04.
During the Preliminary Assessment and Evaluation Plan stages of this project, the Evaluation Team's understanding was that the CRRAFT system would not allow incorrect invoices to be submitted. Therefore, it was assumed that there would not be re-submissions using the CRRAFT system, which would provide the basis for comparison to FY02 data. However, as mentioned before, it was found that still 11% of the invoices were submitted with some type of problem and required the attention of the PTPB to resolve it.
The most common problems found with the invoices were those that led to invoice re-submissions, such as charges to line items with no balance, which required a budget adjustment. Another common problem was the lack of back up information, missing ridership reports, and missing quarterly operations report. In FY02, 55% of the problems with invoices required an invoice re-submission and 45% were other types of problems, mostly missing information. In FY04, those numbers changed to 67% and 33%, respectively (see Table 4-2).
In addition to a lower number of invoices with problems, the Review Time was also reduced in FY04. The average number of days required to finalize an invoice with problems was 33 in FY02 (standard deviation: 25 days) and 9 in FY04 (standard deviation: 5 days).
| FY02 Number | FY02 % of problems |
FY04 Number | FY04 % of problems |
|
|---|---|---|---|---|
| Invoices that required re-submission (e.g. budget adjustment required) | 41 |
55 |
28 |
67 |
| Invoices with other problems (e.g. missing back-up information) | 34 |
45 |
14 |
33 |
| Total Problem Invoices | 75 |
20 (overall) |
42 |
11 (overall) |
The results obtained from the data analysis were, to some extent, supported by the answers obtained from the NMDOT and transit agencies during the surveys and interviews. In the CRRAFT survey for NMDOT users, NMDOT was asked the question “To what extent do you think the CRRAFT system affects the accuracy of the monthly reports that are submitted?” Using a five-point rating scale (ranging from “A lot less accurate with CRRAFT— to “A lot more accurate with CRRAFT”), NMDOT users indicated that they thought using CRRAFT made the submitted reports a lot more accurate. NMDOT estimated that Before CRRAFT was implemented, up to about 60% of the reports required corrections. However, after use of CRRAFT became mandatory only about 10% of reports required corrections. As a result, NMDOT users estimated that because of CRRAFT, the time spent checking and correcting reports has gone from approximately one week per month before CRRAFT down to about one hour per month with CRRAFT.
These percentages, however, contrast with the percentages obtained by the data analysis, which yielded that before CRRAFT about 20% of the invoices were submitted with errors, instead of the 60% estimated by NMDOT users. This overestimation for FY02 may be due to the fact that although only 20% of the invoices were submitted with errors, solving the problems consumed a lot of time and resources and it may have seemed that the number of invoices with problems was higher.
Transit agency users were also asked about the accuracy and problems with the invoices, and their answers point to the same direction of the data analysis and NMDOT perspectives. In the transit agency survey, users were asked the question "To what extent do you think the CRRAFT system affects the accuracy of the monthly reports that are submitted?" Using a five-point rating scale (ranging from “A lot less accurate with CRRAFT” to “A lot more accurate with CRRAFT”), transit agency users were divided on the impact of CRRAFT on the accuracy of the submitted invoices.
The survey results shown in Figure 4-7 shows that half of the respondents thought CRRAFT made the monthly reports more accurate, a little over a third thought CRRAFT made them less accurate, and about 14% thought invoice accuracy was about the same.
The transit agencies were also asked to estimate the percentage of time submitted invoices required corrections both before and after CRRAFT. They were asked:
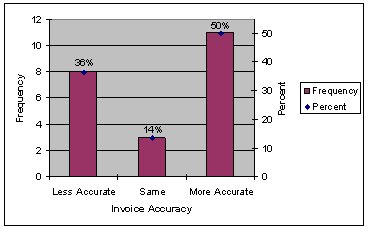
Figure 4-7. Ratings of the Effect of CRRAFT on Invoice Accuracy
“What percentage of time, before and after you started using CRRAFT, did submitted reports require later revisions to correct problems with the reports?
Before CRRAFT, reports required corrections about ___ % of the time
After CRRAFT, reports required corrections about ___ % of the time”
Nineteen transit agencies provided both before and after CRRAFT percentage estimates. The estimates were nearly identical, with transit agencies reporting that reports required corrections about 15.7% of the time Before CRRAFT and about 15.4% of the time After CRRAFT.
Two additional comparisons were made to show user estimates of how CRRAFT affected the accuracy of invoices submitted with CRRAFT. Figure 4-8 (a) and (b) shows before and after percentages for users that indicated (a) that invoices were less accurate with CRRAFT and (b) that invoices were more accurate with CRRAFT.
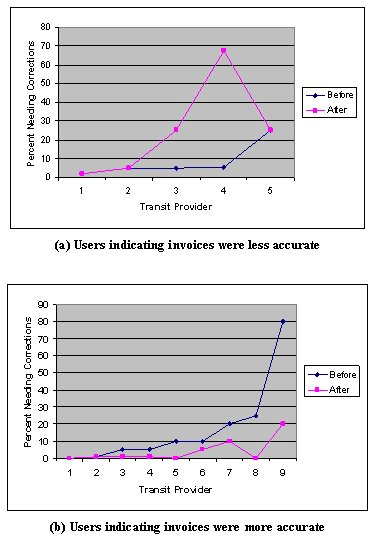
Figure 4-8. Percentages of Invoices Needing Corrections
Hypothesis assessment
The data analysis showed that the number of problems with submitted invoices and the time required to solve them was reduced from FY02 to FY04. The surveys and interviews with both, Transit and funding agencies seem to support this finding.
The Evaluation Team found that the use of CRRAFT has resulted in more accurate invoices and has saved time from funding agencies during the reviewing process. The fact that transit agencies know at all times their remaining balance in each line item seems to have helped reduce the number of incorrect amounts on invoices.
4.1.4 Hypothesis 4
Use of the system reduces the time funding agencies spend researching and collecting information.
The assessment of this hypothesis was based on the analysis of the quantitative data regarding the time spent by the PTPB reviewing and approving invoices, and questions asked during the interview with staff from NMDOT's PTPB.
Once a correct invoice has been received by the PTPB, an internal approval process takes place at the Bureau. The time required for this approval was calculated as:
Approval Time = 3rd level approval date - Final Invoice Submission date
Figure 4-9 shows the frequency distribution of the approval time in FY02 and FY04. As observed, there was a significant decrease in the time required to process and approve final invoices in FY04 with respect to FY02. While in FY04, 80% of the invoices were processed and approved within 12 days of their submission, in FY02 within 12 days of submitted only 44% of the invoices had been processed. The average time to process and approve the invoices by the PTPB was 16 days in FY02 and 9 days in FY04.
These results, obtained from the data analysis, were supported by the answers obtained from staff at the PTPB.
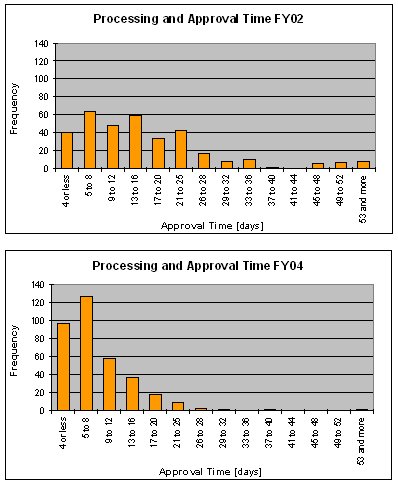
Figure 4-9. Frequency Distribution for Approval Time in FY02 and FY04
In the CRRAFT survey for NMDOT users, NMDOT was asked the question “To what extent do you think the CRRAFT system affects the time you spend reviewing and verifying the monthly invoices and reports that are submitted by transportation providers?” Using a five-point rating scale (ranging from “It takes a lot longer with CRRAFT” to “It takes a lot less time with CRRAFT”), NMDOT users indicated that using CRRAFT took a little bit to a lot less time to review and verify the transit agency invoices and reports. NMDOT estimated that before CRRAFT was used, each error-free invoice took about 15-20 minutes to review, and now with CRRAFT it takes about 10 minutes for each invoice. Despite this efficiency, the NMDOT CRRAFT users stated during interviews that CRRAFT could still be improved to help both NMDOT and transit agency users. One such improvement mentioned by NMDOT was the ability to use CRRAFT to process capital invoices instead of doing them manually. Other examples of suggested improvements are described in Section 4.6.2.
The time reduction per invoice seemed to be caused by the fact that, if an invoice is submitted correctly, all the information required by the PTPB to approve is stored in the CRRAFT system and they seldom have to contact the agencies to request for back-up information. If an invoice is incorrect, the fact that both agencies (i.e. transit and funding agencies) can view and manipulate the data online results in faster adjustments of invoices.
Hypothesis assessment
The data analysis shows that the PTPB staff has been able to process more invoices within a shorter period of time after the implementation of CRRAFT. Based on the interviews with the PTPB staff, this reduction seems to be linked directly with the CRRAFT implementation because the system provides them with consistent invoices that have back up information stored in the system. Hence, the Evaluation Team found that the use of CRRAFT has in fact reduced the time funding agencies spend researching and collecting information to approve invoices.
4.2 The Impact of CRRAFT on Trip Scheduling
This subsection of the report focuses on the extent to which CRRAFT has affected the efficiency of scheduling a trip and the efficiency of operating the trips scheduled with CRRAFT for demand responsive service. Hypotheses five and six are associated with this impact.
4.2.1 Hypothesis 5
Use of the system reduces the overall time required for transit providers to schedule demand response trips
The assessment of this hypothesis was based on the analysis of questions asked to the transit agencies during the surveys. In the transit agency survey, users were asked the question “To what extent do you think the CRRAFT system affects the time spent scheduling demand-response trips?” Using a five-point rating scale (ranging from “A lot longer with CRRAFT” to “A lot less time with CRRAFT”, where a three indicates “The time required is about the same with and without CRRAFT”), transit agency users were divided on the impact of CRRAFT on the time spent scheduling demand-response trips, but inclined towards an increase in the scheduling time after CRRAFT's implementation.
In Figure 4-10, the survey results show that 70% of the transit agencies (14 of 20 respondents) indicated that scheduling demand-response trips took longer using CRRAFT. Five percent (or one Transit agency which provided multiple ratings that averaged 3.5 out of 5) indicated that scheduling demand-response trips was about the same or a little bit less. Twenty-five percent (five out of twenty) of transit agencies indicated that scheduling demand response trips took a little less/ a lot less time.
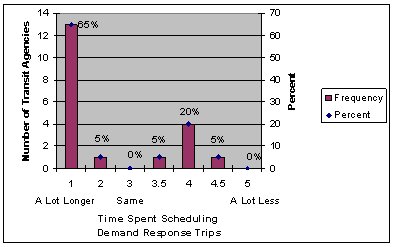
Figure 4-10. Ratings of the Effect of CRRAFT on Time Spent Scheduling Demand Response Trips
The transit agencies in the “scheduling demand response trips took longer” group tended to consist of larger transit agencies (in terms of the number of trips provided in 2004). The average number of trips for this group was about 17,900 trips in 2004. In contrast, the transit agencies in the “scheduling demand response trips took less time” group tended to be smaller agencies providing fewer trips than the “took longer” group. The average number of trips for the “took less time” group was about 7,600 trips in 2004.
The CRRAFT users were also asked to estimate the time required to schedule demand responsive trips. They were asked “How much time (minutes per day) did it take you to schedule demand responsive trips before you started using the CRRAFT system, and how long does it take you now?” Average times were computed by the type of funding program a transit agency used with CRRAFT (i.e., 3037, 5311, or both) and it was found that scheduling demand responsive trips was reported to take about twice as long with CRRAFT. The average times (in minutes per day) from the 16 transit agencies that provided responses to both questions are shown in Table 4-3.
| Category | 3037 Funding | 5311 Funding | Both | Average |
|---|---|---|---|---|
| Before CRRAFT | 72 |
35 |
176 |
104 |
| After Using CRRAFT | 196 |
66 |
315 |
217 |
Eleven of the 14 respondents from the “scheduling demand response trips took longer” group also provided estimates of the time required to schedule demand responsive trips. Figure 4-11 shows that although the minutes per day vary by transit agency, in nearly all the cases, time estimates for after CRRAFT were nearly twice as long as before CRRAFT.
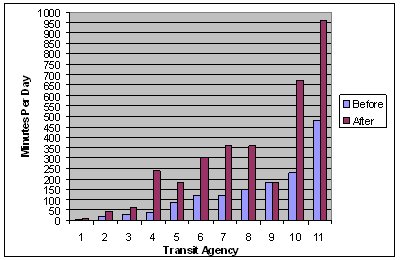
Figure 4-11. Scheduling Time Estimates from “CRRAFT Took Longer” Group
All five of the respondents from the “scheduling demand response trips took less time” group also provided estimates of the time required to schedule demand responsive trips. Figure 4-12 shows the estimated minutes per day transit agencies reported saving using CRRAFT. Note, the range for the Minutes Per Day scale in Figure 4-12 is considerably less than in Figure 4-11. This is attributed to the transit agencies in Figure 4-12 having fewer trips in 2004 (than those agencies included in Figure 4-11) therefore they spent less time per day scheduling demand response trips.
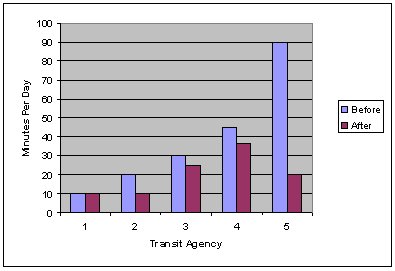
Figure 4-12. Scheduling Time Estimates from “CRRAFT Took Less Time” Group
Hypothesis assessment
The analysis of transit agency perceptions shows that for a majority of users (70 percent or 14 of 20) scheduling demand-response trips took longer using CRRAFT. These CRRAFT users, on average, indicated that the amount of time spent scheduling trips takes approximately twice as long with CRRAFT. Those transit agencies that thought CRRAFT took less time to schedule demand response trips tended to be smaller in that they provided fewer trips. The transit agency interviews supported these findings in that the larger the number of trips a transit agency provides, the greater the burden in entering demand response trips into the CRRAFT scheduler module.
The use of CRRAFT has increased the time to schedule demand response trips for a majority of transit agencies and the impact is particularly evident for Agencies entering schedule data for many trips.
4.2.2 Hypothesis 6
Use of the system results in more efficient schedules for demand response trips
To assess this hypothesis, the Evaluation Team relied on the analysis of standard operating performance metrics data (e.g. passengers per revenue hour) before and after CRRAFT and answers to one question asked of the transit agencies during the surveys and follow up discussions with them.
More efficient schedules would be reflected in performance metrics such as passengers per revenue hour, passengers per revenue mile, passengers per vehicle trip, and ultimately cost per passenger. Due to the data problem with vehicle miles (see Section 3.3.1 - Monthly Invoices for FY02 and FY04) the passengers per revenue mile analysis was not conducted. In addition, a vehicle occupancy analysis (passengers per vehicle trip) was not conducted either because no data on vehicle trips were available-only passenger trips were recorded. Hence, for this analysis we only considered passengers per revenue hour and cost per passenger to determine the impact on schedule efficiency.
The average number of passengers transported per revenue hour operated decreased slightly from FY02 to FY04, from 3.8 to 3.6 . However, the cost per passenger decreased from $24 in FY02 to $16 in FY04 for passengers funded under the 3037 program and from $6 in FY02 to $5 in FY04 for passengers funded under the 5311 program. For a more detailed analysis on operating costs, see Section 4.5. It is difficult to draw a conclusion in terms of the efficiency of the schedules based on these results because while the average passengers per hour decreased slightly, the cost per passenger decreased. Also, the cost reduction may have been caused by factors other than a more efficient schedule. To complement this analysis the evaluation team explored the answers of the agencies regarding the efficiency of the schedules.
In the transit agency survey, users were asked the question “To what extent do you think the CRRAFT system affects the efficiency of the scheduled demand-response trips?” Using a five-point rating scale (ranging from “Trips scheduled with CRRAFT are a lot less efficient” to “Trips scheduled with CRRAFT are a lot more efficient”), transit agency users were divided on the efficiency of the trips scheduled with CRRAFT.
The survey results shown in Figure 4-13 shows that about a third of the respondents thought CRRAFT made it less efficient, a third thought CRRAFT made it more efficient, and about a third thought efficiency of trips was about the same.
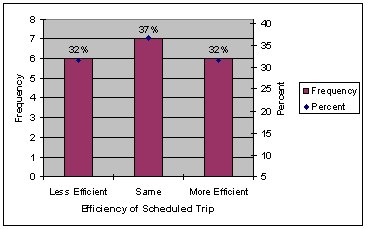
Figure 4-13. Ratings of Demand Responsive Trip Scheduling Efficiency With CRRAFT
No other discriminating factor could be identified to explain the distribution of these ratings. The association between the efficiency of scheduled trips rating was not found to be related to number of trips, type of service (demand response, fixed, mixed), or type of funding (3037, 5311, or both).
The fact that at the time of our evaluation (December 2004 to May 2005) CRRAFT did not have a schedule module which developed a route plan seems to support the finding that 7 of 19 Agencies thought that efficiency was the same both before and after CRRAFT.
For those users indicating CRRAFT made it less efficient, follow-up interviews, survey comments, and anecdotal information seem to suggest that some users may have been referring to particular aspects of the CRRAFT schedule module, for example, the CRRAFT Daily Driver Log (paper schedule) developed by the dispatcher for use by the drivers. Often the Daily Driver Log used a different format and did not contain the same information that had been previously used by the Agency. As a result the CRRAFT schedule made it more difficult for drivers to find specific information or make adjustments (like adding a trip) to the CRRAFT printed schedule. Several Agencies stated they no longer used the Daily Driver Log and had reverted back to their original method of developing paper schedules.
For users indicating that CRRAFT made it more efficient, it may be the case that efficiency was improved for Agencies that provide fewer trips, as four of these six Agencies provided a relatively small number of trips (average of 4,312 trips in 2004 versus 19,325 trips for those indicating CRRAFT made it less efficient).
Hypothesis assessment At the time of our evaluation (December 2004 to May 2005) CRRAFT did not have a schedule module which developed a route plan. Consequently, it is not unexpected that transit agencies had mixed perceptions of the efficiency of CRRAFT scheduled trips. Based on the interviews, it seems reasonable to assume that, without a scheduler that develops a route plan, CRRAFT most likely did not have much of an effect on the efficiency of scheduled trips. This conclusion appears to be supported by the quantitative analysis of performance metrics, which shows a slight decrease in the average number of passengers per hour and a reduction on the cost per passenger. The Evaluation Team concludes that for most users, CRRAFT did not have a positive impact on scheduling demand-responsive trips. The operating efficiency of the scheduled service may have improved only for a few smaller transit agencies.4.3 The Impact of CRRAFT on Trip Authorization (Hypothesis 7)
Hypothesis 7 - Use of the system reduces the number of unauthorized trips
The assessment of this hypothesis was based on the analysis of the answers to questions asked to the transit agencies and NMDOT during the surveys and interviews.
NMDOT users were asked to provide an estimate of the number of unauthorized trips both for before and after CRRAFT. They were asked the question:
“How many unauthorized trips per month do you think were made by transportation providers before and after CRRAFT?
Before CRRAFT, the number of unauthorized trips was ___ trips per month
After CRRAFT, the number of unauthorized trips was ___ trips per month”
CRRAFT users at NMDOT stated that without a detailed audit there was no way to determine the number of unauthorized trips. However, NMDOT estimated that Before CRRAFT was used approximately 40% of the trips per month were misclassified, and now with CRRAFT, misclassified trips were down to about 5% per month.
A similar question was asked to transit agencies: “To what extent do you think the CRRAFT system affects the number of unauthorized trips that are taken?” Using a five-point rating scale (ranging from "Unauthorized trips occur a lot more often with CRRAFT" to “Unauthorized trips occur a lot less often with CRRAFT” where a three indicates “CRRAFT has little effect on the number of unauthorized trips”), transit agency users varied in their opinions on the impact of CRRAFT on the number of unauthorized trips. The survey results shown in Figure 4-14 shows that although responses ranged from “A lot more often” to “A lot less often”, about 40 percent of respondents indicated that CRRAFT has little or no effect on the number of unauthorized trips.
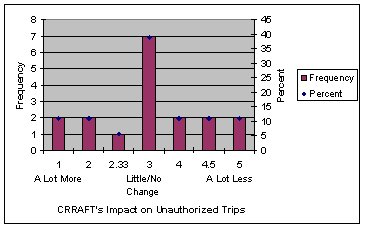
Figure 4-14. Ratings of the Effect of CRRAFT on Number of Unauthorized Trips
In addition to the survey and as stated in the Evaluation Plan, the HSD-ISD Management Evaluation was also reviewed to help determine the number of unauthorized trips. This Management Evaluation was conducted in June 2002 including an audit of nine transit providers. The section on quarterly fiscal reporting included documentation of discrepancies between what providers billed NMSHTD and what they were reimbursed. These discrepancies were explained in a letter from the NMSHTD PTPB to the HSD in June 21, 2002. Based on those explanations, the Evaluation Team concluded that the agencies involved were rightfully reimbursed, thus there were no unauthorized trips during that period.
Hypothesis assessment
Transit agencies had a wide range of opinions on the effect of CRRAFT on the number of unauthorized trips-25% thought that there were more unauthorized trips, 40% thought that CRRAFT had little or no impact on the number of unauthorized trips, and 35% thought that the number of unauthorized trips was less after CRRAFT's implementation. In addition, NMDOT users felt that without a more detailed audit it was impossible to determine the number of unauthorized trips before or after CRRAFT implementation. Therefore, we conclude that CRRAFT did not have a clear and decisive impact on the number of unauthorized trips.
4.4 The Impact of CRRAFT on Vehicle Maintenance (Hypothesis 8)
Hypothesis 8 - Use of the system reduces number of in-service mechanical breakdowns
In the transit agency survey, users were asked the question “To what extent do you think the CRRAFT system affects the number of in-service vehicle mechanical breakdowns?” Using a five-point rating scale (ranging from “CRRAFT results in a lot more vehicle breakdowns” to “CRRAFT results in a lot fewer vehicle breakdowns”), the majority (85%) of transit agency users indicated that CRRAFT had no effect on the number of vehicle breakdowns. These survey results are depicted in Figure 4-15.
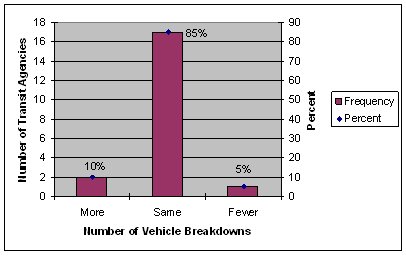
Figure 4-15. Ratings of CRRAFT Impact on Vehicle Breakdowns
Hypothesis assessment
The majority of transit agencies indicated that CRRAFT has no effect on the number of vehicle breakdowns. Therefore, we conclude that CRRAFT did not have an impact on the number of in-service vehicle breakdowns.
4.5 The Impact of CRRAFT on Operating Efficiency and Costs (Hypothesis 9)
This subsection of the report discusses the effect CRRAFT has had on transit providers' operating efficiency and operating cost. It focuses on potential changes in productivity (number of passengers per revenue mile or revenue hour) and cost effectiveness (operating cost per revenue mile or revenue hour). Hypothesis 9 is associated with this impact.
Hypothesis 9 - Use of the system reduces the operating cost of transit services.
To assess this hypothesis, The Evaluation Team relied on the analysis of the operating costs and characteristics obtained from the FY02 and FY04 invoices, the answer to one question asked to the transit agencies during the surveys, and follow-up discussions with them.
In the transit agency survey, users were asked the question “To what extent do you think the CRRAFT system affects the total operating cost of transit services?” Using a five-point rating scale (ranging from “CRRAFT results in a lot higher operating costs" to “CRRAFT results in a lot lower operating costs”), and a sixth choice “I Don't Know”, five of the 24 transit agency users indicated that they did not know how CRRAFT affected total operating cost of transit services.
In Figure 4-16, 47% (9 of 19) transit agencies indicated that they thought CRRAFT resulted in higher operating costs. On the other hand, 16% (3 of 19) transit agencies indicated that CRRAFT resulted in lower operating costs. The remaining 37% (7 of 19) indicated that CRRAFT has no significant effect on operating costs.
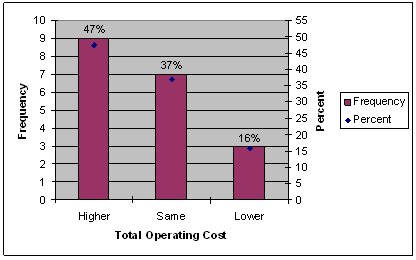
Figure 4-16. Ratings of CRRAFT Impact on Operating Cost
Additional analyses were conducted to investigate whether there was an association among the ratings of CRRAFT's impact on operating cost and the number of trips, type of service (i.e., demand responsive, fixed route, or mixed), and type of funding (3037, 5311, or both) provided by transit agencies. The number of trips and type of service showed a trend for transit agencies providing demand response service. Figure 4-17 shows the CRRAFT impact on operating cost ratings as a function of the number of trips in 2004 for agencies providing demand response service. The trend line indicates that the greater the number of trips, the more an Agency was inclined to rate that CRRAFT results in higher operating costs (R=-0.30).
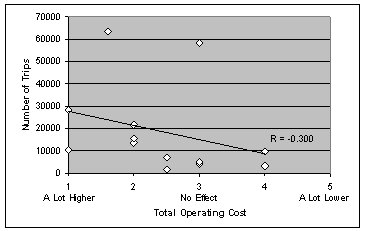
Figure 4-17. Ratings of CRRAFT Impact on Operating Cost by Number of Trips for Demand Response Transit Agencies
Due to the small sample sizes, no other associations between Total Operating Cost rating and type of service (demand responsive, fixed route, or mixed) and funding (Section 3037, 5311, or both) could be identified to explain the distribution of these ratings.
In addition to the answer to the survey question to capture the perspectives of transit agencies, the Evaluation Team analyzed the actual operating costs and operating characteristics of the providers. The FY02 data were obtained from the invoices kept on file at the PTPB. The FY04 data were obtained from CRRAFT in December 2004. Operating costs include:
- Salaries and benefits of supervisors, drivers, dispatchers, and mechanics;
- Vehicle maintenance expenses such as fuel, oil, tires, painting, and replacement parts;
- Shop maintenance and supplies;
- Cell phones;
- Licenses and fees; and
- Staff training.
Figure 4-18 shows the total operating costs invoiced by the providers during FY02 and FY04, ordered by the number of trips of the providers in FY04.
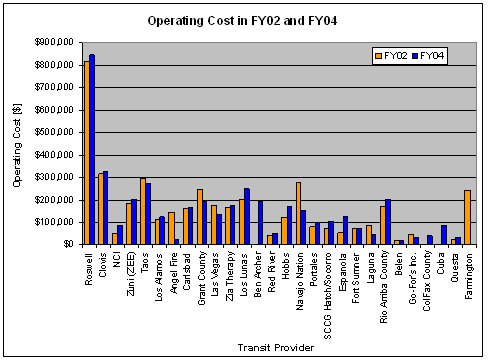
Figure 4-18. Operating Costs
The previous figure does not reflect a particular pattern regarding the difference in operating costs from FY02 to FY04. Twenty-four of the 28 providers had operations during both years. Sixteen of those 24 providers saw an increase in their operating costs, and the remaining eight reduced their operating costs. The total operating cost for all agencies in FY02, including 3037 and 5311, was $4.20 million and in FY04 was $4.24 million. The changes in operating costs may be explained by the use of CRRAFT or other factors including changes in ridership and changes in their operating performance.
Figure 4-19 shows the percentage change in operating cost and in ridership from FY02 to FY04 for the 24 agencies operating during both years. Three general cases are observed:
- An increase/decrease in operating costs with a corresponding and similar increase/decrease in ridership (e.g. Roswell, Clovis, Taos, Angel Fire, Carlsbad, Grant County, Las Vegas, Red River, Hobbs, Navajo Nation, and Laguna).
- An increase/decrease in operating costs with a corresponding increase/decrease in ridership but of a different order of magnitude (e.g. NCI, Zia Therapy, Los Lunas, SCCG Hatch/Socorro, Go Fors, and Questa)
- An increase/decrease in operating costs with an opposite decrease/increase in ridership (e.g. Zuni, Los Alamos, Portales, Espanola, Fort Sumner, Rio Arriba County, and Belen).
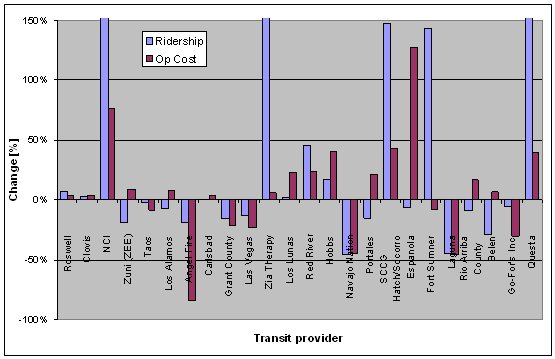
Figure Notes: a. Ridership change values for NCI: 5773%, Zia Therapy: 253%, Questa: 400%.
b. Transit providers in descending order by number of trips.
Figure 4-19. Change in Operating Cost and Ridership between FY02 and FY04
The last two cases, which include the majority of the providers, suggest that changes in other aspects of the service may be driving the changes in ridership and operating costs. For example, increased congestion in the service area may result in an increase in operating costs and reduction in ridership due to a less reliable and slower service. During follow-up discussions, some providers were asked about the extreme changes in service characteristics between FY02 and FY04. Errors in the CRRAFT database were most commonly mentioned as the causes for the extreme figures in FY04.
The relationship between operating costs and ridership can also be seen in terms of the operating cost per trip in FY02 and FY04, which is shown in Figure 4-20. Note that there does not seem to be a relationship between operating costs, ridership, and their changes between FY02 and FY04. In addition, neither seems to be correlated with the size of the transit provider. Hence, other "forces" may have driven the changes observed in these characteristics between FY02 and FY04.
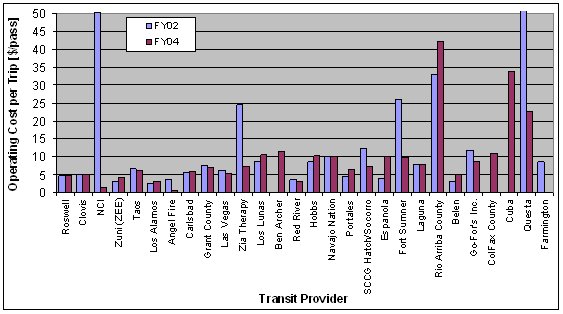
Figure Notes: a. FY02 Operating cost per trip for NCI: $50.2, Questa: $81.
b. Transit providers in descending order by number of trips.
Figure 4-20. Operating Cost per trip in FY02 and FY04
The changes in operating costs may also be explained by changes in operating characteristics such as higher vehicle miles and vehicle hours. However, the quality of the data for vehicle miles for FY04 was poor, as explained in Section 3.3.1, thus only vehicle hours were analyzed. Figure 4-21 shows the change in operating cost between FY02 and FY04 and the change in vehicle hours between the same years. Although a slightly better correlation can be observed between these two metrics than between cost and ridership, there are still some occurrences (i.e. Roswell, Clovis, Los Lunas, Portales) in which an increase in one metric is coupled by a decrease in the other or vice versa. These results further support the theory that other "forces" or a combination of the previously discussed may have driven the changes observed in operating cost between FY02 and FY04, and it is difficult to relate those changes to CRRAFT alone.
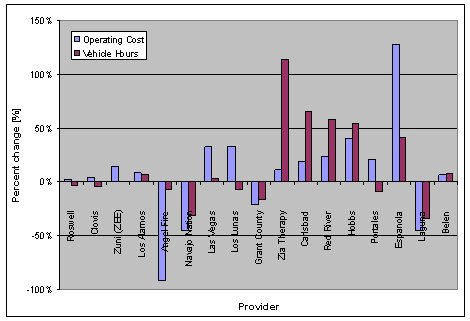
Figure Note: Transit providers in descending order by number of trips.
Figure 4-21. Change in Operating Cost and Vehicle Hours between FY02 and FY04
Hypothesis assessment
The survey results indicated that transit agencies providing a larger number of demand response trips were more likely to think that CRRAFT results in higher operating costs. Viewed in conjunction with the earlier findings on the impact of CRRAFT on the time spent scheduling demand response trips, it seems likely that those transit agencies spending more time scheduling demand response trips also have higher operational costs.
The data analysis did not provide conclusive results about the relationship of CRRAFT with changes in operating cost alone or operating cost per trip.
4.6 The Costs and Benefits of CRRAFT
This subsection summarizes the results of perceived costs and benefits of using the CRRAFT system. As archived cost data were unavailable, the emphasis is on the opinions of the transit providers and funding agencies on whether the CRRAFT benefits outweigh its costs. The following results are based on the surveys and interviews of CRRAFT users at NMDOT, NMHSD and the transit agencies. Hypotheses 10 and 11 are associated with this impact.
4.6.1 Hypothesis 10
Use of a Web-based system has minimized the time and cost of deployment, technical support, and maintenance
The intent of Hypothesis 10 was to investigate the efficacy of implementing CRRAFT as a web-based application. However, because the ATRI report on relative costs is not available, the analysis could not be performed as originally intended and the analysis of CRRAFT's time and cost of deployment, technical support, and maintenance was not performed. Nevertheless, through the interviews and follow-up discussions with users at NMDOT and the transit agencies, the Evaluation Team did obtain some insight into the advantages and disadvantages of the web-based application. The following is a list of the frequently mentioned positive and negative aspects regarding the web-based nature of CRRAFT based on comments from the survey, interviews, and other anecdotal information.
The positive aspects mentioned are as follows:
- CRRAFT is useful for generating reports, supporting audit activities, and enables easy distribution of funds from various funding agencies.;
- Financial management data can be viewed by both transit agencies and NMDOT when addressing invoice issues; and
- Though not currently possible, online data could be used to develop customized queries and reports.
The negative aspects are as follows:
- Adequate server response time is dependent on the type of internet connection (e.g., dial-up, high-speed) and server load;
- A busy server can result in very slow response times when entering data;
- If the internet connection drops out, data may have to be re-entered;
- Multiple modules and user interface issues make realtime entry of trip schedules difficult for many users; and
- Many transit agencies are still using pre-CRRAFT methods to develop schedules and support their own operational requirements.
Hypothesis assessment
Although no cost data were available for this analysis, the surveys, interviews, and discussions with users produced many insights into the positive and negative aspects of CRRAFT. CRRAFT appears to be useful for generating invoices and supporting auditing activities, but has resulted in many transit agencies doing additional work to use CRRAFT in support of NMDOT reporting/invoicing requirements.
4.6.2 Hypothesis 11
Transit providers and funding agencies perceive that the benefits of the system outweigh its costs
To assess this hypothesis, the Evaluation Team asked four questions in the survey to CRRAFT users at NMDOT and the transit agencies. The questions investigated user opinions about the most useful CRRAFT features, what other features users like to see added, which features should be improved or changed, and users overall opinion of CRRAFT. The following describes the results and findings from the user responses.
Most useful CRRAFT features
CRRAFT users were asked the question "What three features of CRRAFT do you find most useful? (Number the three most useful features 1, 2, and 3 with 1 being the most useful)" The list of features for NMDOT included:
- Features for tracking ridership
- Features for generating reports
- Supporting audit activities
- Other
The NMDOT ranking of most useful features were (in decreasing order of importance): Features for generating reports, Supporting audit activities, and Features for tracking ridership.
Because CRRAFT provided many features for transit agency users, the list of features was more extensive than for NMDOT users. The list of features for transit agencies included:
- Features for tracking referrals
- Electronic benefits transfer card
- Features for tracking ridership
- Features for tracking client trip usage and authorizing a trip
- Features for generating reports for internal use
- Features for tracking vehicle attributes and maintenance
- Features for submitting monthly reports
- Features for tracking employee training and certifications
- Features for tracking client information and eligibility
- Other
The transit agency ranking of most useful CRRAFT features from the 24 transit agencies is shown in Figure 4-22. Due to inconsistencies in the number of respondents (more than one survey) from some transit agencies and respondent rankings (some respondents indicated three or more features as equally useful), the figure shows the number of transit agencies that voted for each of the features. Tracking Ridership and Submitting Monthly Reports tied in the rankings for most useful feature both receiving 66 percent (or 16 out of 24) of the transit agency votes. A second group of slightly less popular features were: Generating Reports for Internal Use (10 of 24 votes), Tracking Client Information and Eligibility (10 of 24), and Tracking Client Trip Usage and Authorizing a Trip (9 of 24). The CRRAFT features that received the fewest votes were Tracking Employee Training and Certifications (3 of 24 votes), Tracking Vehicle Attributes and Maintenance (3 of 24 votes), and Electronic Benefits Transfer Card (2 of 24 votes). It should be noted that at the time of the survey the ICTransit Smartcard system was still under development and not yet implemented.
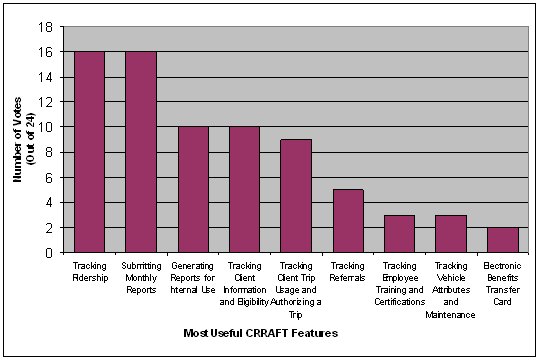
Figure 4-22. Transit Agency Ranking of Most Useful CRRAFT Features
CRRAFT users were asked the open-ended question "What other features would you most like to see added to CRRAFT?" The question provided an opportunity for respondents to describe, in as much detail as they desired, those features which would improve CRRAFT. Because many of the responses were specific (faster data entry in scheduler) and some were generic ("faster, faster, faster"), the responses were reviewed and grouped by common theme into several topic categories. Figure 4-23 shows the number of times (votes) a feature category was mentioned by the 21 transit agencies providing responses.
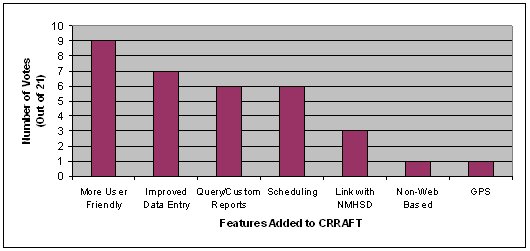
Figure 4-23. Transit Agency Ranking of Most Desired Added Features
The most commonly mentioned features Transit users wanted added to CRRAFT were improvements to the user friendliness of the existing features. In particular, examples of these user friendly features include:
- Ability to work in a spreadsheet format to view and add more data entries without having to generate a report or deal with limits to the number of records that can be entered at one time
- Faster switching between modules,
- Intuitive memory--Not having to reset/re-enter dates,
- Scrolling lists showing more than 4 accounts,
- View more than 3 entries in revenue report and reimbursement report fields,
- Take the header off to let reports print on one page without adjustment.
The second most commonly mentioned feature, data entry improvements, could be considered a subcategory of user friendliness, was cited in several contexts:
- Faster, less time consuming way to enter data,
- Allow entry of more than eight in scheduler,
- Faster page to page switching.
When asked this same question, NMDOT and NMHSD identified two features consistent with the transit agency responses. NMDOT and NMHSD would like to see features added to CRRAFT that would provide additional reports and direct access queries for information in support of generating their respective in-house reporting needs. NMDOT mentioned having a feature which would allow on demand reports and reports for other funding programs such as Section 5310 funding for Disabled and Elderly programs. NMHSD also desired more advanced query capabilities of the number of non-duplicated riders, average mileage, and vehicle mileage by transit provider and county or counties to support inquiries from supervisors, legislators, and DOT requestors.
CRRAFT Features that Users Would Like to See Improved or ChangedThe survey for both the funding agencies (NMDOT and NMHSD) and the transit agencies asked the open-ended question "Are there any features of CRRAFT that you would like to see improved or changed? Please explain." The question provided an opportunity for users to describe CRRAFT features which they would like to see improved or changed. The open-ended responses were grouped into topic categories by common theme and the “votes” were counted. Figure 4-24 shows the number of times (votes) a feature category was mentioned by the 20 transit agencies providing responses.
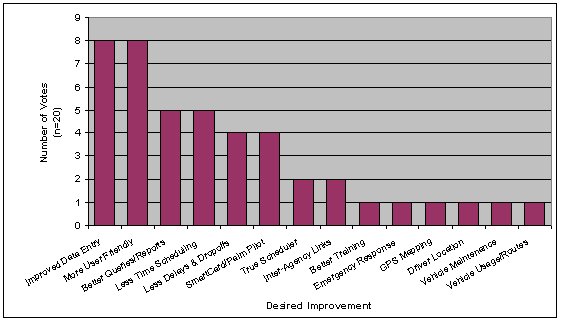
Figure 4-24. Transit Agency Ranking of Most Desired Improvements
As was found in the previous question, the most popular features cited were improvements related to data entry and improvements to the user friendliness, each of which were mentioned by about 40 percent (8 out of 20) of the transit agencies. Better queries and reports and less time scheduling were mentioned by about 25 percent (5 out of 20) of the transit agencies. Less drop-offs and Smartcard/Palm Pilot were mentioned by about 20 percent (4 out of 20) of the transit agencies.
Examples of comments include:
- Make it easier for data entry, it is currently very time consuming,
- On the master log for the daily scheduled trips, I would like to have it where you can update information on a client's trip as a whole instead of going in and updating one ride at a time (i.e., update multiple records when need to change a related data item),
- If data is entered incorrectly, it is difficult to go back and find the error unless a report is printed,
- Would like to review/revise reports before submitting,
- Features to produce spreadsheets to compare specific data,
- No mechanism to check for double counts,
- Ability to integrate other packages for scheduling.
Overall Opinion of CRRAFT
The survey for both the funding agencies (NMDOT and NMHSD) and the transit agencies asked the question “What is your overall opinion of CRRAFT?” A five-point rating scale was used, ranging from “CRRAFT has been very unsuccessful-the costs far outweigh the benefits" to “CRRAFT has been very successful-the benefits far outweigh the costs,” and where a three indicates “CRRAFT has been neither particularly unsuccessful or successful.”
NMDOT users were somewhat mixed on their overall opinion of the success of CRRAFT. On one hand, CRRAFT was rated as neither particularly successful or unsuccessful because it was felt that, although it is being used, the system is not yet a finished product and it does not meet the operational needs of the transit agencies.
On the other hand, CRRAFT was also viewed as being progressively successful. NMDOT users acknowledged that problems have existed since the deployment but things seem to be getting better as individual issues get resolved, users have become better acquainted with the system and have gained experience using CRRAFT.
NMHSD does not directly use the CRRAFT system but is able to request information that is entered and stored by the system. Consequently, NMHSD's perspective is that CRRAFT has been successful and they are overall happy with the CRRAFT system.
Transit agency users were nearly evenly split on their overall opinion of the success of CRRAFT. Figure 4-25 presents the distribution of transit agency ratings. About 44% (10 of 23) of respondents indicated that overall CRRAFT has been unsuccessful or very unsuccessful, and that the costs outweigh the benefits. On the other hand, about 48% (11 of 23) of the transit agencies indicated that overall, CRRAFT has been successful or very successful and that the benefits outweigh the costs. About 8% (or 2 of 23) thought CRRAFT was neither particularly successful or unsuccessful.
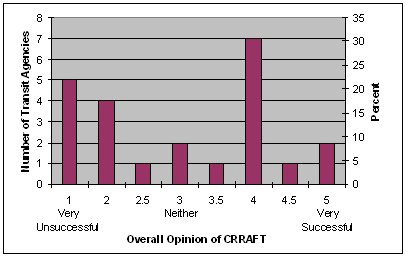
Figure 4-25. Ratings of Overall Opinion of CRRAFT
Additional associations between ratings of CRRAFT's impact on operating cost and the number of trips, type of service (i.e., demand responsive, fixed route, or both), and type of funding (3037, 5311, or both) were investigated. The CRRAFT Overall Opinion rating appears to be associated with the number of trips, especially in the case of transit agencies providing demand response-type routes. Figure 4-26 shows the relationship of Overall Opinion rating as a function of the number of trips. The correlation of these two variables (R=-0.331) indicates that transit agencies that said that CRRAFT has been unsuccessful and that the costs outweigh the benefits, tended to have a larger number of trips than Agencies that indicated CRRAFT has been successful and that the benefits outweigh the costs. The relationship between overall opinion and number of trips was most apparent with transit agencies providing demand response service. Figure 4-27 shows the association of these factors and the corresponding correlation (R=-0.437). Due to the small sample sizes, no other associations between overall opinion ratings and the type of funding (Section 3037, 5311, or both) could be identified to explain the distribution of these ratings.
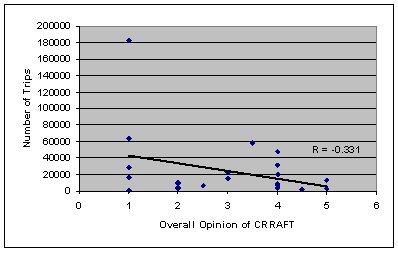
Figure 4-26. Number of Trips as a Function of Overall Opinion Ratings of CRRAFT
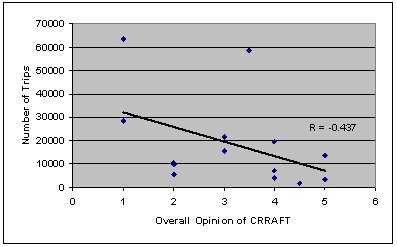
Figure 4-27. Demand Response Number of Trips as a Function of Overall Opinion Ratings of CRRAFT
Hypothesis assessment
NMDOT and NMHSD are generally pleased with the benefits of CRRAFT and generally agree that the benefits outweigh the costs. The transit agencies have mixed views. While larger agencies, particularly those providing demand response service, were more likely to indicate that CRRAFT has been unsuccessful and that the costs outweigh the benefits, smaller agencies were more likely to indicate that CRRAFT has been successful and that the benefits outweigh the costs.
4.7 The Impact of CRRAFT on Communication and Coordination (Hypothesis 12)
This subsection focuses on the extent to which CRRAFT has improved communication and coordination between agencies, particularly communication between transit providers and funding agencies. This subsection addresses Hypothesis 12 in the Evaluation Plan.
Hypothesis 12 - Use of a single system improves communication between diverse agencies
To assess this hypothesis, the Evaluation Team relied on answers to survey questions to CRRAFT users at NMDOT and to transit agencies.
In the NMDOT survey, two questions were asked to investigate the level of communication and coordination. In the communication question, NMDOT users were asked "To what extent do you think the CRRAFT system has affected the level of communication between your agency and the transit service providers?" A five-point rating scale was used (ranging from "CRRAFT results in a lot worse communication" to "CRRAFT results in a lot better communication"), and where three indicates "CRRAFT has no significant effect on the extent of communication."
NMDOT users indicated that CRRAFT resulted in better communication. Although not all communication has been good, use of the system has allowed NMDOT to more easily work to correct invoice problems. For example, if NMDOT finds a problem in an invoice, they can call the transit agency and both parties can look at the CRRAFT invoice to discuss the problem. Consequently, this cooperative, interactive approach can reduce the time lag in correcting some invoice problems.
In the coordination question, NMDOT users were asked "To what extent do you think the CRRAFT system has affected the level of coordination between human service transportation providers?" A five-point rating scale was used ranging from "CRRAFT results in a lot worse coordination" to "CRRAFT results in a lot better coordination," and where a three indicates "CRRAFT has no significant effect on the level of coordination."
CRRAFT users at NMDOT indicated that CRRAFT resulted in a lot better coordination. In NMDOT's opinion working with the transit agencies in the design, build, and implementation of CRRAFT, coordination has improved in conjunction with the better communication. NMDOT also feels they now have a better idea of what the transportation providers want and desire in a system.
In the transit agency survey, two questions were asked to investigate interagency communication and coordination. In the communication question, users were asked "To what extent do you think the CRRAFT system has affected the level of communication between your agency and other agencies, such as PTPB, HSD-ISD?" A five-point rating scale was used (ranging from "CRRAFT results in a lot worse communication" to "CRRAFT results in a lot better communication" and where a three indicates "CRRAFT has no significant effect on the extent of communication").
Although 46% (10 of 23) of transit agency users indicated that the level of communication was about the same, 41% (9 of 23) felt that CRRAFT improved the level of interagency communication. The survey results are shown in Figure 4-28.
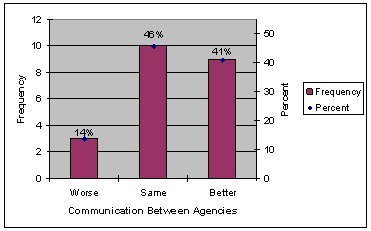
Figure 4-28. Ratings of CRRAFT Impact on the Level of Communication Between Agencies
In the coordination question, users were asked "To what extent do you think the CRRAFT system has affected the level of coordination between your agency and other human service transportation providers?" A five-point rating scale was used (ranging from "CRRAFT results in a lot worse coordination" to "CRRAFT results in a lot better coordination" and where a three indicates "CRRAFT has no significant effect on the level of coordination").
Nearly two-thirds of transit agency users (64% or 14 of 22) indicated that the level of coordination was about the same, about one-third (32% or 7 of 22) felt that CRRAFT improved the level of coordination. The survey results are shown in Figure 4-29.
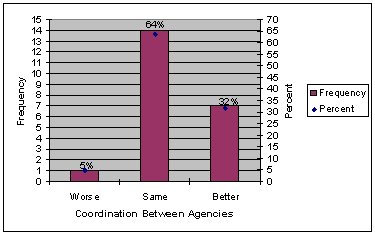
Figure 4-29. Ratings of CRRAFT Impact on Coordination Between Agencies
Hypothesis assessment
Surveys and interviews with NMDOT indicated that they view communication and coordination to have improved as a result of CRRAFT. In particular, NMDOT cites better communication and coordination when working together with transit agencies in correcting problems related to submitted invoices.
A majority of transit agencies indicated that the level of communication was about the same (10 of 23) or better (9 of 23). Nearly two-thirds (14 of 22) indicated that the level of coordination among human service transportation providers was about the same as before CRRAFT.
In conclusion, it appears that for NMDOT, CRRAFT has resulted in better communication and coordination with transit agencies. For transit agencies, communication and coordination remained about the same or better.
