
4. Test Results and Findings
4.1 Introduction
This section provides the test results and subsequent findings for the Electronic Toll Collection/Electronic Screening Interoperability Pilot Project. Supplementary information is contained in the Attachment I: Electronic Toll Collection/Electronic Screening Interoperability Pilot Project Appendices, provided under separate cover. The supplementary appendices include the following sections:
- Section 1 - Evaluation Methodology
- Section 2 - ETC/E-Screening Facility Descriptions
- Section 3 - Test Results and Findings
- Section 4 - Total Truck Counts by Facilities
- Section 5 - Safety Documents Summary
- Section 6 - Motor Carrier Survey
- Section 7 - Literature Review - Environmental Assessment
4.2 Mobility Test
To conduct the mobility test, travel times and truck counts were collected in three states: New York (NY); Maryland (MD); and Connecticut (CT).
- In New York, travel times and truck counts were collected on Interstate 90 outside of Albany at the Barrier 23 and 24 toll facilities and at two toll bridges in New York City (George Washington and Tappan Zee bridges). No data from weigh stations were collected in New York.
- In Maryland, travel times and counts were obtained at one toll facility and four weigh stations.
- In Connecticut, travel times and counts were collected at the weigh stations in Union and Greenwich.
Table 4-1 summarizes the State, location, facility type, and data collection dates of travel times and truck counts.
| State | Location | Facility | Collection Dates |
|---|---|---|---|
NY |
Albany: I-90 at Exits 23 and 24 | Toll |
October 16-17, 2002 |
| NYC: I-95 George Washington Bridge | Toll |
Archived data from Port Authority of NY-NJ for 2002
through 2003 inclusive; also from January - August 2004 |
|
| NYC: I-87/I-287 Tappan Zee Bridge | Toll |
December 14, 2004 | |
MD |
Perryville: I-95 near Exit 93 | Toll |
October 23 - 24, 2002 |
| Perryville: I-95 near Exit 93 | Weigh Station |
October 22 - 23, 2002 | |
| Hyattstown: I-270 near Exit 22 | Weigh Station |
December 2 - 3, 2002 | |
| West Friendship: I-70 near Exit 80 | Weigh Station |
December 9 - 10, 2002 | |
| New Market: I-70 near Exit 62 | Weigh Station |
January 21 - 22, 2003 | |
CT |
Union: I-84 near Exit 73 | Weigh Station |
May 19, 2003 |
| Greenwich: I-95 near Exit 2 | Weigh Station |
May 21, 2003 |
The main goal of the data collection effort was to obtain a sample of travel times and counts for traffic conditions during a typical work week. To minimize the effects of weekend travel, the Evaluation Team collected data at all sites during a standard work week (no holidays), and either on Monday, Tuesday, or Wednesday. With the exception of the George Washington and Tappan Zee bridges, and the Union Weigh Station, data were collected during four time periods (Morning, Noon, Evening, and Night) to obtain a sampling of travel times at various times of the day. The time span for day and times were identified as: Morning (7:30 to 9:30 a.m.); Noon (11:30 a.m. to 1:30 p.m.); Evening (4:30 to 6:30 p.m.); and Night (9:30 to 11:30 p.m.).
Time savings per toll facility are summarized in Figure 4-1. Albany Exits 23 and 24 both show significant time savings from the use of E-ZPass, with thruway exit time savings (actual payment of tolls) being substantially higher than thruway entry times. In general, thruway exits have a higher number of E-ZPass dedicated lanes, which explains the higher time savings. The time savings at Perryville is relatively low compared to the Albany exit time savings. This reflects the initial lack of CMV E-ZPass only lanes, with the result that the time savings realized from the use of E-ZPass was obtained only through the electronic payment transaction.
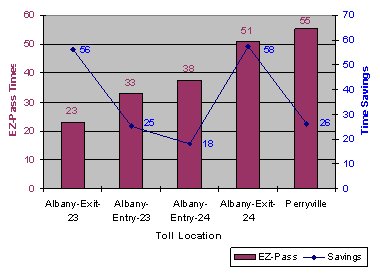
Figure 4-1. Time Savings per Toll Facility in Seconds.14
Time savings per weigh station are summarized in Figure 4-2. Since time savings alone is not meaningful in trying to compare sites, looking at time savings in conjunction with mainline times provides a point of reference for comparing sites and the amount of time savings. For instance, at West Friendship the mainline travel time is 18 seconds, but because of West Friendship-specific conditions (traffic, type of facility, etc.) an E-screening system comparable to a bypassing truck could produce a time savings of 58 seconds per truck. The Greenwich Weigh Station in Connecticut has the most dramatic time savings, as an E-screening system could result in a savings of 302 seconds per truck.
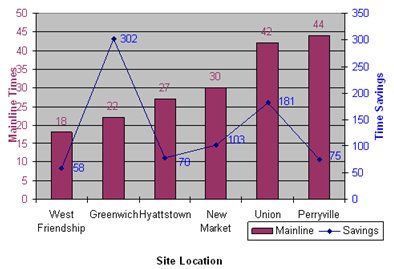
Figure 4-2. Time Savings per Weigh Station in Seconds.14
4.2.1 Summary of Travel Time Analyses at Toll Facilities
Compared to manual payment of tolls, electronic toll collection resulted in shorter delays at the toll plaza and reduced travel times for trucks at both the Albany, New York, and Perryville, Maryland, toll facilities. At Barriers 23 and 24 in Albany, New York, trucks using E-ZPass to enter and exit the Thruway experienced shorter travel times through the toll barrier during all four time periods (Morning, Noon, Evening, and Night). In general, the E-ZPass trucks had a larger time savings when exiting the Thruway (and completing the toll payment transaction). The time savings benefit was most pronounced during the Evening period.
Similar results were observed at the toll facility in Perryville, Maryland. Trucks using electronic toll collection consistently had shorter travel times through the toll plaza and on average saved from 24 to 28 seconds compared to those using manual payment.
4.2.2 Summary of Travel Time Analyses at Weigh Stations
Travel times were examined at six locations in Maryland and Connecticut. At the four sites in Maryland (Perryville, Hyattstown, West Friendship, and New Market), travel times for trucks entering the weigh stations and crossing WIM were compared to times for trucks stopping at the static scale. At two sites in Connecticut (Union and Greenwich), the travel times for trucks entering the weigh stations and crossing the WIM were compared to free-flow mainline travel times.
In Perryville, the trucks bypassing the static scale saved on average of about 75 seconds. Depending on the time of day, trucks saved between 70 to 100 seconds, with the largest time savings benefit (100 seconds) occurring during the Noon period. In Hyattstown, during the Noon and Night periods, trucks saved 85 and 70 seconds, respectively. At West Friendship, trucks saved on average about 99 seconds during the Noon period and approximately 46 seconds during the Morning, Evening, and Night periods. In New Market, trucks bypassing the static scales saved an average of 108 seconds during Morning and Noon periods.
In Greenwich, Connecticut, when comparing the travel times for trucks crossing the weigh station WIM to free-flow mainline travel times, the time savings was estimated to be between 57 and 91 seconds, with the largest time savings benefit during the Noon period. In Union, during the Morning and Noon periods, trucks saved 30 and 34 seconds, respectively.
4.2.3 Conclusions of Mobility Impacts at Toll Facilities and Weigh Stations
In most instances, using the E-ZPass resulted in shorter travel times through the toll facilities. Also, using E-ZPass generally resulted in more reliable travel times through toll facilities.
As would be expected with a fully integrated E-screening system, bypassing static scales resulted in significantly shorter travel times through weigh stations. If an E-screening system allowed trucks to bypass weigh stations at free-flow mainline speeds, travel times past weigh stations would enable trucks to achieve maximum travel time savings.
4.3 Safety Test
Early in the course of the evaluation it became apparent that the levels of transponder use on the part of industry for E-screening would not be sufficient to yield an adequate number of data points to support a statistically valid analysis of safety impacts. An additional concern was the fact that only one weigh station, the Perryville facility, had an operational system, thus further reducing the size of the potential sample available to conduct the safety test.
Since there was insufficient data available, the Evaluation Team recommended two alternative approaches to FHWA and FMCSA for conducting the safety test:
- Compare the Before and After safety ratings, out-of-service rates, and number of inspections for those motor carriers using transponders for E-screening. During follow-up discussions with MDOT, the Evaluation Team learned that MDOT had conducted a similar study and found that there was no significant difference in these metrics for motor carriers participating in E-screening.
- Model projected traffic volumes, projected growth in transponder market penetration, and use the Volpe model that estimates the safety impacts generated from each inspection to estimate potential safety impacts from E-screening. The hypothesis that was to be tested is that trucks using transponders are more likely to receive weigh station bypass notification, and this would enable the enforcement community to target the non-transponder using portion of the motor carrier industry. The hypothesis was derived from anecdotal information obtained during focus groups conducted for the project shows that those carriers currently using transponders are carriers with good safety ratings eligible for green lights. However, since this approach had been used for other evaluations, it was not clear that repeating this methodology would produce meaningful results.
Based on discussions with FHWA and FMCSA, a decision was made to not implement a formal Safety Test using either of the above methodologies. The Evaluation Team has included a recommendation for a follow-on study that would examine the safety impacts of E-screening in greater detail, once the level of transponder market penetration has reached a sufficient level to provide a statistically valid sample size. For the purposes of this evaluation activity, the Safety Test was not completed.
4.4 Efficiency Test
Given the current and projected large volumes of commercial vehicle travel through the I-95 corridor states, private-sector benefits from electronic toll collection and E-screening are and will continue to be realized primarily through travel time savings. These benefits will be realized through reduction in expected en-route delays at the toll facilities and at weigh stations along the corridor.
The benefits were estimated using an identified value of time for a commercial vehicle, defined as $71.05 per hour31 (or equivalent to $0.0197 per second). Monetized estimates (motor carrier operational efficiency) were developed for the projected time savings by applying the identified value of time to the observed time savings. The result of this value of time was then extrapolated to the larger universe of transactions at the toll facilities and weight inspections in the three target states (Connecticut, Maryland, and New York). Table 4-2 presents the per-event value of time savings, summarized as follows:
- For toll facilities, average travel time savings ranged from 13 to 55 seconds per transaction, with a simple unweighted average of 30 seconds time savings, valued at $0.59 per event.
- At the Maryland weigh stations, average travel time savings ranged from 56 to 109 seconds per transaction, with a simple unweighted average of 76 seconds time savings, valued at $1.56 per event.
- At Connecticut weigh stations, average travel time savings ranged from 32 to 68 seconds per transaction, with a simple unweighted average of 50 seconds time savings, valued at $0.99 per event.
- For all weigh stations observed, a simple unweighted average of 68 seconds time savings, valued at $1.33 per event.
| Facility | E-Screening or ETC Average Time Savings |
Value of Time Savings |
|---|---|---|
Toll Facilities |
||
George Washington Bridge |
13 |
$0.26 |
Tappan Zee Bridge |
38 |
$0.77 |
Albany Exit 24 Entry |
16 |
$0.32 |
Albany Exit 24 Exit |
55 |
$1.09 |
Perryville |
25 |
$0.49 |
Weigh Stations |
||
Perryville |
64 |
$1.26 |
Hyattstown |
77 |
$1.52 |
West Friendship |
56 |
$1.11 |
New Market |
109 |
$2.15 |
Union |
32 |
$0.63 |
Greenwich |
68 |
$1.34 |
Extrapolating these time savings to a full deployment scenario for the three subject states is proffered to illustrate potential maximum benefits to motor carriers of the ETC/E-screening programs. In terms of E-screening, based on FHWA data, the approximate average annual number of weight inspections conducted is as follows:
- Connecticut: 400,000
- Maryland: 2,900,000
- New York: 200,000
For the three states, the total is approximately 3.5 million trucks weighed per year. At an imputed value of $1.33 per bypass event, and given 100 percent enrollment and clearance at scales, the maximum estimated value to the motor carrier industry would be roughly $5 million per year.
Given these assumptions and the average commercial vehicle miles traveled in the three states of approximately 11,450 million miles per year, at best, the motor carrier industry would realize a bottom line efficiency savings of electronic screening of $0.001 per mile. This suggests that electronic screening would likely not realize overwhelming penetration into the commercial vehicle market, but remain of value to the premium carriers who have significant exposure based on routes and miles to inspection facilities.
Based on the toll facilities surveyed in this effort, the average annual commercial vehicle volumes and estimated value of the savings are presented in Table 3-8.
| Facility | Average Annual Truck Volume |
Estimated Maximum Time Savings Value (100% Subscription) |
|---|---|---|
| George Washington Bridge | 4.2 million |
$1.1 million |
| Tappan Zee Bridge | 0.125 million |
$0.1 million |
| Albany Exit 24 Facilities | 2.2 million |
$2.4 million |
| Perryville | 1.4 million |
$1.8 million |
Given the current levels of electronic toll collection deployment at the subject facilities and reduced transaction times (cash versus E-ZPass) alone, financial impacts to the industry as a whole are minimal. In terms of participation in electronic toll collection plans, again, motor carrier efficiency benefits will be directly proportional to level of exposure in terms of frequency through toll plazas. What is seen is that commercial vehicle operators, whether cash or E-ZPass customers, are already reaping significant time savings resulting from reduced congestion at toll facilities due to significant subscription rates by the general motoring public.
4.5 Environmental Benefits
Proliferation of ETC mechanisms, such as E-ZPass, has a positive effect in reducing vehicle emissions at toll-plazas due to decreased acceleration, deceleration, and idling events. Speed profiles of vehicles at ETC/E-screening facilities are significantly different for vehicles with and without transponders; vehicles without transponders are required to stop for transaction processing. On-road emission measurement with a sample fleet of instrumented vehicles is perhaps the best way to measure the impacts of ETC/E-screening on heavy-duty truck emissions. Instead, a practical alternative to this costly undertaking is to model ETC/ E-screening activity. However, no such tools exist for modeling emission impacts of ETC/ E-screening facilities on heavy-duty vehicle operations.
Current generation vehicle emission models MOBILE 6.2 and the Comprehensive Modal Emissions Model (CMEM) are limited with respect to their ability to model heavy-duty vehicle emissions. CMEM is incapable of modeling heavy duty vehicle emissions. Emission characteristics of vehicles transiting screening facilities cannot be accurately derived employing traditional modeling methods with MOBILE 6.2. Consequently, few studies have focused on modeling of heavy duty vehicles using ETC/E-screening facilities.
In MOBLE 6.2, modal operations of vehicles are represented as speed bins - collections of uniform speed - at 5-mph increments. Using speed bins enables employment of a speed profile discretization technique (SPD), allocating vehicle miles of travel into various speed bins. By employing an emissions influence zone (EIZ) within which the speed profiles are captured, an estimation of vehicle emissions transiting and ETC/E-Screening facility is possible. Using the SPD technique, emission impacts of heavy-duty trucks were calculated at the toll collection plaza on George Washington Bridge, New York. The following steps describe the methodology using the SPD techniques as previously described to estimate impacts of ETC/E-screening heavy-duty truck emissions:
- Pre-modeling activities include collecting relevant field data to define/derive the following variables for emissions modeling:
- Volume of light and heavy duty trucks at various facilities.
- Processing time for cash, EZ-pass and weighing transactions.
- VMT distribution of small and large trucks in various speed bins.
- Develop a spreadsheet-based sketch-planning tool incorporating the SPD technique.
- Reduce field data to develop input parameters for MOBILE 6.2.
- Obtain emission factors from MOBILE 6.2.
- Analyze field data in conjunction with emission factors derived from MOBILE 6.2.
- Interpret results and report findings.
4.5.1 Travel Time and Truck Count Data Collection
Travel times and truck counts were collected in New York, Maryland, and Connecticut. In New York, travel times and truck counts were collected on I-90 outside of Albany at the Barrier 23 and 24 toll facilities and at two toll bridges in New York City (George Washington and Tappan Zee bridges). No data from weigh stations were collected in New York.
In Maryland, travel times and counts were obtained at one toll facility and four weigh stations. In Connecticut, travel times and counts were collected at the weigh stations in Union and Greenwich. Table 4-4 summarizes the State, location, type of facility, and data collection dates of travel times and truck counts.
| State | Location | Facility | Collection Dates |
|---|---|---|---|
NY |
Albany: I-90 at Exits 23 and 24 | Toll |
October 16-17, 2002 |
| NYC: I-95 George Washington Bridge | Toll |
Archived data from Port Authority of NY-NJ for 2002
through 2003 inclusive; also from January - August 2004 |
|
| NYC: I-87/I-287 Tappan Zee Bridge | Toll |
December 14, 2004 | |
MD |
Perryville: I-95 near Exit 93 | Toll |
October 23 - 24, 2002 |
| Perryville: I-95 near Exit 93 | Weigh Station |
October 22 - 23, 2002 | |
| Hyattstown: I-270 near Exit 22 | Weigh Station |
December 2 - 3, 2002 | |
| West Friendship: I-70 near Exit 80 | Weigh Station |
December 9 - 10, 2002 | |
| New Market: I-70 near Exit 62 | Weigh Station |
January 21 - 22, 2003 | |
CT |
Union: I-84 near Exit 73 | Weigh Station |
May 19, 2003 |
| Greenwich: I-95 near Exit 2 | Weigh Station |
May 21, 2003 |
The goal of the data collection effort was to obtain a sample of travel times and counts for traffic conditions during a typical workweek. Further, to minimize the effects of weekend travel, the data at all sites were collected during a normal workweek (no holidays) and either Monday, Tuesday, or Wednesday. With the exception of the George Washington and Tappan Zee bridges and Union Weigh Station, data were collected during four time periods (Morning, Noon, Evening, and Night) to obtain a sampling of travel times at various times of the day. The time of day and times were: Morning (7:30 to 9:30 a.m.); Noon (11:30 a.m. to 1:30 p.m.); Evening (4:30 to 6:30 p.m.); and Night (9:30 to 11:30 p.m.).
The toll authorities in New York and Maryland provided truck counts which were used in our analyses. At weigh stations in Maryland and Connecticut, tubes and vehicle counters were placed across the roadways to obtain counts of trucks entering the weigh stations.
4.5.2 Field Data Reduction
Toll plaza data and the weigh station data were scrutinized for suitability in modeling emission factors using MOBILE 6. Toll plaza data at George Washington Bridge in New York City was used as the test dataset to apply the study methodology. Table 4-5 provides a summary of transaction times for both E-ZPass and cash operations.
| Main | SPC | SPE | SOC | SOE | LPC | LPE | LOC | LOE |
|---|---|---|---|---|---|---|---|---|
| Std Deviation | 6.99 | 4.95 | 8.66 | -- | 12.66 | 5.20 | 10.34 | -- |
| Median Time | 17.80 | 8.18 | 18.43 | -- | 25.55 | 12.52 | 24.33 | -- |
| Average | 18.69 | 9.90 | 20.19 | -- | 29.25 | 13.28 | 26.72 | -- |
| # of Points | 258 | 43 | 372 | -- | 178 | 20 | 471 | -- |
| UCL | 39.65 | 24.76 | 46.18 | -- | 67.23 | 28.89 | 57.74 | -- |
| LCL | 0 | 0 | 0 | -- | 0 | 0 | 0 | -- |
| 95% Confidence | 19.54 | 11.38 | 21.07 | -- | 31.11 | 15.56 | 27.66 | -- |
| Interval | 17.84 | 8.42 | 19.31 | -- | 27.39 | 11.00 | 25.79 | -- |
| Average | 17.56 | 9.32 | 19.41 | -- | 26.83 | 13.28 | 25.37 | -- |
| # tossed points | 15 | 1 | 0 | -- | 12 | -- | 17 | -- |
| SPC=Small Truck, Peak, Cash; SPE=Small Truck, Peak, E-ZPass; SOC=Small Truck, Off-Peak, Cash; SOE=Small Truck, Off-Peak, E-ZPass; LOE=Large Truck, Off-Peak, E-ZPass; LPC=Large Truck, Peak, Cash; LPE=Large Truck, Peak, E-ZPass; LOC=Large Truck, Off-Peak, Cash; | ||||||||
These average transaction times for small truck and large trucks are used to apportion vehicle miles of travel by each of the 12 speed bin classes specified by MOBILE 6. Following are some of the assumptions related to and parameters used in apportioning VMT in various speed bins:
- All approaching vehicles are traveling at the posted 55 mph speed limit.
- Truck traffic is aggregated into two main categories - small and large trucks.
- Stopping sight distance, deceleration, and acceleration criteria specified in the American Association of State and Highway Transportation Officials (AASHTO) manual on Geometric Design of Highways and Streets is applicable. Accordingly, the following parameters are applied:
- Stopping distance: 325 feet for small trucks and 500 feet for large trucks.
- Small trucks are assumed to accelerate at 1.3 ft/sec2 after the transaction.
- Large trucks are assumed to accelerate at 1.1 ft/sec2 after the transaction.
- For cash transactions, the vehicles have to stop. However, MOBILE 6 does not model idle emissions. For the duration of the transaction, the travel speed of cash transaction, thus, is assumed as 2.5 mph - which is the minimum speed bin for the model.
- For E-ZPass transactions, vehicles were observed to drive at various speeds ranging from 10 to 30 mph. For test purposes only two E-ZPass speeds, 10 mph and 20 mph, were considered.
- The approach deceleration zone is divided equally into 12 speed bins ranging from 2.5, 5, and 10 through 55 mph (with 5 mph increments).
- The departure acceleration is divided based on transaction type as well as based on the reduced speed for E-ZPass transactions. Consequently, there are 12 speed bins for accelerating from complete stop (cash transaction), 9 speed bins for accelerating from 10 to 55 mph (E-ZPass Case 1) and 7 speed bins for accelerating from 20 to 55 mph (E-ZPass Case 2).
- Speed VMT inputs for small and large trucks do not change by hour of day. (This assumption was necessary because the traffic counts by hour of day are not available).
- Only truck traffic will be modeled in the emission factor modeling process.
The Table 4-6 summary presents an estimate of percent reductions in emissions (Nitrogen Oxides [NOX], Carbon Monoxide [CO], and volatile organic carbons [VOC]) in the "emission influence zone" (EIZ) that are attributable to E-ZPass operations. The results indicate that if the E-ZPass allows the vehicles to be processed at 10 mph, the reductions in VOCs due to truck traffic alone could be as high as 50 percent.
| Pollutant | Emissions Due to All Cash Transactions | Emissions Due to Existing E-ZPass Mix | Emissions Due to All Trucks Using E-Z Pass | ||
|---|---|---|---|---|---|
| E-ZPass at 10 mph | E-ZPass at 20 mph | at 10 mph | at 20 mph | ||
| VOC | 10645.30 | 7366.6 | 6877.8 | 6011.0 | 5320.1 |
| % Reduction | 30.8% | 35.4% | 43.5% | 50.0% | |
| CO | 79136.00 | 60563.5 | 55877.3 | 52884.6 | 46260.9 |
| % Reduction | 23.5% | 29.4% | 33.2% | 41.5% | |
| NOX | 45857.46 | 43175.0 | 42242.3 | 42065.9 | 40747.6 |
| % Reduction | 5.8% | 7.9% | 8.3% | 11.1% | |
4.6 Customer Satisfaction
4.6.1 "Before" Project
Background information on the ETC and E-screening programs and interoperability project was obtained through a comprehensive literature review and interviews with project stakeholders. The findings from these activities were used to develop the overall evaluation strategy and specific methodology used to identify both quantitative and qualitative data requirements and sources.
Initially, the Evaluation Team had planned on collecting qualitative data by conducting a series of focus groups with a variety of customers, including enforcement officials, motor carriers, and commercial vehicle drivers. These focus groups were to be followed by a quantitative survey of each customer group.
As the project developed, it became clear that this approach needed modification. For example, the population of enforcement officials in Connecticut and Maryland was so small that it seemed more appropriate to speak with each group of officials in a focus group setting, both before and after the E-screening technology deployment.
Following discussions with industry representatives, it was also determined that administering a driver survey was not a cost-effective means of obtaining data. This decision was based on low market penetration for transponders at the time of the evaluation. Since the evaluation was focused on the interoperability of ETC and E-screening technologies, it is important to be able to identify drivers who had experience with both technologies in order to obtain an accurate assessment of the benefits of interoperability.
It was determined that it would be difficult and costly to identify a large enough sample of drivers to be able to obtain statistically valid results. Due to the low market penetration of the transponders, it was also determined that the results may not be representative of a larger population of drivers. Therefore, the decision was made to survey only the motor carriers for the "After" project assessment. Baseline data for the Customer Satisfaction Test was obtained through a series of "Before" focus groups:
- Maryland motor carriers
- New York motor carriers
- Truck drivers in Baltimore, Maryland
- Truck drivers in Albany, New York
- Maryland enforcement officials
In addition, a survey of enforcement officials in Connecticut was conducted. Though the Evaluation Team attempted to organize a focus group of enforcement officials in Connecticut, the Connecticut Department of Motor Vehicles preferred to participate in a survey rather than a focus group. Therefore, the Evaluation Team developed a survey for the Connecticut enforcement officials.
The purpose of the focus groups and survey was to gain an understanding of the issues important to customers and to use this understanding to design the "After" surveys of enforcement personnel, motor carriers, and commercial vehicle operators.
The MMTA and the NYSMTA recruited participants for the motor carrier and driver focus groups. Both State associations were brought on board as subcontractors to support these activities and the After project motor carrier survey, in particular, the distribution of blank surveys and the collection of completed surveys. The Maryland State Police (MSP) and the MdTA Police identified participants for the law enforcement focus group. For the Connecticut survey, a survey was sent to each enforcement official involved in roadside operations at a weigh station.
4.6.2 "After" Project
Only one "After" project focus group was conducted with the MdTA Police, as this was the only enforcement group that had had experience with E-screening during the course of the evaluation. Due to delays in deploying E-screening capabilities in Connecticut and at the MSP-operated weigh stations, no additional weigh stations were brought online or implemented E-screening during the evaluation's period of performance. The MdTA Police recruited participants for the focus group. This focus group included representatives from motor carrier inspectors, uniformed officers, and information technology staff who had experience with E-screening.
As referenced above, an "After" survey of the motor carrier industry was also conducted to obtain their views on ETC and E-screening. The information gained from the "Before" focus groups and survey was used to develop the post-deployment quantitative surveys. As the preliminary results from the focus groups are qualitative and not representative of the population, the goal of the surveys is to obtain more quantitative information and to survey a sample that will be representative of a particular population of customers, namely those motor carriers belonging to the MMTA and the NYSMTA. The survey was designed to fill information gaps and investigate emerging trends in preliminary data, and included:
- Questions related to industry use and acceptance of the technology.
- Questions related to mobility benefits.
- Questions related to safety benefits (E-screening only).
- Questions related to operational benefits.
- Questions related to cost benefits.
- Questions related to E-ZPass customer service (ETC only).
- Questions related to promotion and registration (E-screening only).
In addition, the After survey was designed to investigate trends that emerged in the preliminary data. For example, with respect to the customers' perceptions of E-screening, the following trends emerged from the data from the focus groups:
- Motor carriers, while less negative than enforcement officials, seem to be "riding the fence" when it comes to the potential benefits of E-screening.
- Although motor carriers reported that they could see the potential advantages of the technology, they had not yet realized the benefits.
Questions were formulated to help investigate whether these trends hold true amongst a larger sample of customers.
Motor carrier survey respondents included members from the MMMTA and NYSMTA. Surveys were distributed to the entire membership of each association, including 910 to the MMTA and 441 to the NYSMTA.
Overall, the results of the motor carrier survey show a reasonable degree of acceptance of ETC on the part of industry. General impressions of E-screening are also favorable, although the results show that the survey respondents do not have extensive experience with E-screening. There is not enough market penetration of E-screening in Maryland to assess motor carriers' perceptions of the technology.
4.6.3 Survey Findings
The Customer Satisfaction Survey findings are summarized as follows:
- ETC Conclusions:
- Motor carriers tend to like ETC.
- 73 percent of respondents are enrolled.
- 68 percent disagreed that they preferred their old system of payment.
- 63 percent were satisfied with their experience with ETC.
- ETC has positive impacts on travel times through toll facilities.
- 47 percent reported decreases in travel times of 1 - 10 percent.
- 42 percent reported decreases in travel times of more than 10 percent.
- 59 percent of motor carriers are satisfied with the travel time benefits associated with ETC.
- ETC has positive impacts on operations.
- 58 percent indicated that ETC has had positive impacts on their operations.
- 60 percent were satisfied with the impacts of ETC on operational efficiency.
- ETC, as compared to previous non-cash methods of toll payment (e.g., ticket books), has had both positive and negative impacts on costs.
- 28 percent of motor carriers reported decreases in fuel usage, while 53 percent reported no impact on fuel usage.
- 42 percent of motor carriers reported decreases in time/cost of maintaining accounts, while 41 percent reported increases.
- 35 percent of motor carriers reported decreases in time/cost of record keeping, while 43 percent reported increases.
- 47 percent of motor carriers disagreed that the costs of participating in ETC outweighed any savings (27 percent agreed).
- Perceptions of overall impact on costs are divided.
- 38 percent of motor carriers were satisfied with the eligibility criteria for obtaining toll discounts, and 28 percent are dissatisfied.
- 44 percent of motor carriers were satisfied with the costs of using ETC, and 20 percent are dissatisfied (31 percent are neutral).
- E-Screening Conclusions:
- The general trend of those that use the technology tend to be divided on their perceptions of the benefits of it.
- Those that do not use it tend to agree that they would enroll if E-screening were available on more routes that they run frequently.
- Enforcement officials in Maryland are not accepting of the E-screening technology:
- They feel it will have adverse long-term impacts on safety.
- It has not been well introduced into their work environment.
- It has not functioned well.
4.7 Institutional and Technical Challenges
This section of the report presents the institutional and technical challenges identified during the evaluation and lessons learned. This section is intended to present only those issues not previously discussed in the Customer Satisfaction test. Institutional challenges were identified and documented via the following methods:
- Stakeholder Interviews - The primary information source for identifying issues and the processes by which they were resolved was accomplished through interviews with project stakeholders on a "Before" and "After" basis.
- Document Review - Interviews were supplemented by reviewing selected documents (meeting minutes, correspondence, and project reports) generated through project activities. Document reviews, in particular, meeting minutes, were used to document the processes by which institutional challenges were resolved.
- Stakeholder Surveys - To the extent feasible, information was obtained through stakeholder surveys. The primary objective of obtaining information through surveys was to gauge stakeholder satisfaction with how a particular challenge was or was not resolved. In addition, surveys were used to gauge how well the stakeholders felt their views or concerns were incorporated into the process by which an issue was addressed.
Overall, the Pilot Project successfully demonstrated that interoperability is both technical and institutionally feasible. The Project Team has shown a highly flexible and adaptive approach to project management and made a number of mid-project adjustments to reflect changes in the business environment for ETC and E-screening. The Project Team has also worked extremely well with the motor carrier industry and has demonstrated that partnerships with industry can be effectively established. Particular examples of this flexible management approach and the working relationship established with the industry include:
- Mid-Term Project Scope Adjustments - The mid-term project assessment and the revision to the Phase 2 and 3 scopes of work made by the Evaluation Team addressed several significant issues identified during project implementation. Based on changes in the business environment, the project team determined that the continued subsidy of the cost of the Mark IV Fusion transponders was not necessary. Rather, the most significant constraint facing the project was the lack of a single registration portal for both ETC and E-screening for motor carriers. Many motor carriers did not understand that enrolling in ETC and obtaining a Mark IV Fusion transponder did not automatically enroll them in E-screening and as a result did not enroll in the Maryland Electronic Screening Program.
Recognizing this, the Project Team made a decision to modify the original project scope and reallocate funds to develop an on-line E-screening enrollment process and explore the feasibility of developing a single enrollment portal that would include both ETC and E-screening. The decision to improve the E-screening enrollment process and to enable the ability of the program to accept enrollment from other programs represent major accomplishments for enhancing interoperability and encouraging motor carriers to enroll in the program. This type of flexible project management, and the willingness to make mid-project adjustments, is a management approach that is critical for the successful deployment of ITS/CVO technologies and systems. - NYSMTA and MMTA Super Accounts - A policy change by the IAGs that took place during the project allowed third party organizations to establish large scale or super accounts and serve a transponder administrator function. Both the NYSMTA and MMTA established super accounts, which have been highly successful in recruiting motor carriers to participate in ETC, and in creating a potential market for E-screening. Using these accounts has also helped smaller carriers and owner-operators who may not qualify for any discount under the ETC system to still obtain a discount by enrolling through each state association's super account, thus offsetting the potential elimination of a significant benefit (toll discounts) of the ETC program, as perceived by the motor carrier industry. In addition, these smaller carriers and owner-operators receive administrative support from each association for enrollment and accounting functions, a significant additional benefit to this segment of the motor carrier industry.
- Working Relationship with NORPASS - The establishment of a working relationship with the NORPASS program further expanded the reach of the Pilot Project and also demonstrated interoperability between E-screening programs.
- Motor Carrier Outreach - Initially, when motor carriers applied for E-ZPass accounts, they were not provided with adequate information about the Maryland Electronic Screening Program and the option of obtaining a Mark IV Fusion transponder. Vendor representatives have since been provided with training and informational materials, and a more comprehensive marketing and outreach program has been established. To this end, the inclusion of the motor carrier industry, in particular the state trucking associations, in promoting the project has been of significant benefit. Outreach efforts have been targeted to association members as well as to E-ZPass account holders, and the industry has played an active role in promoting the program.
Connecticut has not yet deployed an operational E-screening program, due to a number of challenges beyond the control of the Connecticut evaluation team. These have included state-wide budget reductions, which delayed the project startup, and technical challenges such as the State needing to replace all mast arms used on the highway system. The latter included the mast arms being used for the AVI readers at the Union Weigh Station. The institutional and technical challenges related to E-screening are from the Maryland deployment.
As was noted in Section 4.6, Customer Satisfaction, a policy change made by the IAG, while not directly related to the project, has had an impact on the project. The IAG agencies discontinued the use of the ticket books that motor carriers purchased in bulk to obtain a toll discount, thus requiring motor carriers to either enroll in ETC or pay cash. Motor carriers were also required to register for ETC in one state, a base state system similar to that used for IRP and International Fuel Tax Agreement. Previously, motor carriers would purchase ticket books in each state in which they operated and would obtain the issuing state's discount. Concurrent with this, the IAG also reduced the overall discount available to motor carriers and made discounts contingent on transaction volume. Thus, from the perspective of the motor carrier industry, the implementation of ETC resulted in a reduced discount and a higher threshold needed to obtain a discount.
4.8 ETC Implementation Challenges
Technical challenges experienced during the deployment of ETC in Maryland included:
- Placement of cameras used to enforce ETC at the entrance to toll booths - These were placed to photograph rear license plates of passenger cars to identify the owner for any necessary enforcement action. Given that the extended length of a power unit-trailer combination and that the trailer tag may not identify the actual motor carrier operating the power unit, this rear camera positioning created problems with enforcement. The MdTA has moved cameras to the toll booth exit location for the CMV lanes so that the tag on the power unit can be photographed.
- Programming particular vehicle configurations into toll tags - Toll tags were pre-programmed for a particular vehicle configuration. If a power unit with a toll tag did not meet the particular vehicle configuration, either too high a toll (requiring a lengthy process to obtain a refund) or too low a toll (resulting in possible enforcement action) would be assessed. The MdTA has since placed sensors along the access points to toll plazas to identify vehicle configurations and ensure that the system assesses the correct toll for the identified configuration.
4.9 E-Screening Implementation Challenges
The two key challenges that have impacted the Maryland Electronic Screening Program are the lack of continuous operational capability of the E-screening system at Perryville and the lack of other weigh stations deploying E-screening systems throughout the northeast. Additional issues identified during the course of the project include:
An additional consideration is that the State's Systems Development Life Cycle methodology and MDOT's project management processes were not utilized for the project. Using these methodologies and management processes would help ensure that the project is incorporated into Maryland's motor carrier program as a regular component of program operations.
The project has also identified the importance of supporting transponder administrator functions within a state. At present, one staff person responsible for following up on transponder administration also handles the enrollment for the Maryland Electronic Screening Program in addition to other duties beyond supporting E-screening enrollment. Applications are received electronically through the Maryland Motor Carrier Website, but an end-to-end interface that will enable the E-screening system to electronically receive this data is still under development. Application information is then manually entered into the E-screening system. The State is working to develop an interface that will link the Maryland Motor Carrier Website and the E-screening system, but this has not yet been deployed.
As with many deployments of new systems and technologies, many of the institutional and technical challenges that most adversely impacted the project were beyond the control of the Project Team. The primary issue encountered was that of the budget problems encountered by the participating states. Both Maryland and Connecticut were required to cut budgets to maintain State constitution-mandated balance budgets. The result was that funds required for the deployment of electronic screening infrastructure were reduced or not available, and staff resources were reduced, which required the remaining staff to absorb increased workloads to maintain current program activities.
In addition, a new governor was elected in Maryland prior to deploying the electronic screening infrastructure at other weigh stations. The new administration requested that MDOT undertake a review of the E-screening program to determine if further deployments would be cost effective under current budget constraints. This study has been completed, and further delayed the E-screening deployment in Maryland.
The net result of these issues was that no other weigh station along the northeastern section of the I-95 Corridor is equipped for electronic screening beyond the Maryland Perryville facility. This offers no incentive to the industry to participate in electronic screening, as there is no perceived benefit from having access to only one facility.
An additional, and rather curious, consequence of the delay in deploying E-screening has been the impact on maintaining the electronic screening software deployed at Perryville. The initial intent was that this same software would be used by all weigh stations in Maryland to operate the electronic screening system. However, as a result of the deployment delays, Perryville is the only weigh station both using and supporting the software. The anticipated economies of scale, where agencies would be able to share operations and maintenance costs, have not been realized and the software now stands as a custom application rather than a production deployment. This has made it somewhat difficult for the MdTA to obtain the resources needed to properly support the application, as other IT needs that support other day-to-day operations have been given priority.
Another complicating factor has been that participating agencies have seen extensive changes in management and senior staff. While this is not uncommon in a state government setting, the end result has been that each time a new manager arrives, technical staff must provide briefings to bring the manager up-to-date on project activities. In some instances, project stakeholders commented that a subsequent result was that new managers sometimes disagreed with existing requirements or added additional requirements, further complicating development and deployment efforts.
The tragic events of September 11, 2001, and the resulting color-coded security alert system adopted by the Department of Homeland Security also adversely impacted the project. Enforcement personnel reported that any time the security alert was elevated to Code Orange, all bypassing of trucks at weigh stations, in particular hazardous materials carriers, was suspended and all trucks were ordered to enter weigh stations. From a national security viewpoint, this is a very appropriate measure to be taking; however, this action does counter the established CVISN concept of electronic screening and weigh station bypass actions to provide for transport efficiencies.
31The 2004 Urban Mobility Report, David Schrank and Tim Lomax, Texas Transportation Institute, The Texas A&M University System, September 2004. Accessed from: http://mobility.tamu.edu.
32AASHTO Green Book - A Policy on Geometric Design of Highways and Streets, January 2001.