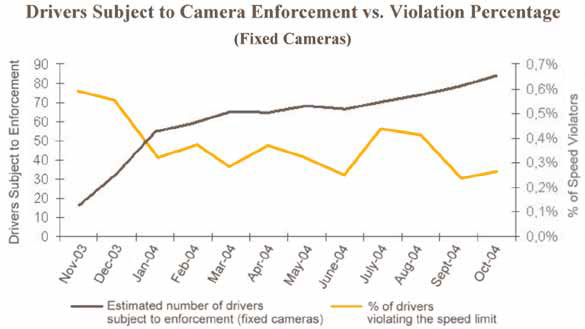
Figure 16: Measured results of automated enforcement.
Line graph of automated enforcement measured results. On the x-axis are months from November 2003 to October 2004. On the left side y-axis is the estimated number of drivers subject to enforcement by fixed cameras, indicated in blue. On the right side y-axis is the percentage of speed violators, indicated in red. The number of drivers subject to enforcement ranges from about 15 in November 2003 to about 85 in October 2004. The percentage of drivers violating the speed limit ranges from about 0.6 percent in November 2003 to less than 0.3 percent in October 2004.