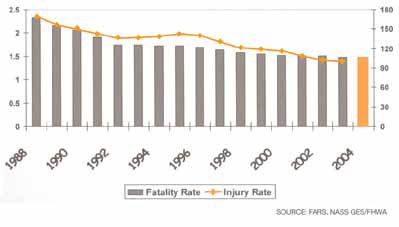
Bar graph of fatality and injury rates per 100 million vehicle miles traveled by year from 1988 to 2004. Rates range from about 2.4 in 1988 to about 1.5 in 2004
Back