
1. INTRODUCTION
1.1 Background
The Intelligent Transportation System (ITS) Joint Program Office (JPO) of the U.S. Department of Transportation (USDOT) contracted with Battelle to evaluate the Central Puget Sound Regional Fare Coordination (RFC) project in Washington State. Battelle teamed with CRA International to carry out the evaluation.
The goal of the RFC Project is to offer public transportation customers in the Central Puget Sound region a single electronic fare medium – a fare card – that will enable them to travel seamlessly across the region using multiple transportation service providers. The RFC Project currently includes seven partner agencies operating in four counties in the Central Puget Sound region. These agencies are: King County Metro Transit (the largest agency), Community Transit, Everett Transit, Kitsap Transit, Pierce Transit, Sound Transit and the Washington State Ferries.[2] Backing up the fare card itself is an extensive set of agreements between the partner agencies regarding revenue sharing, fare policies, business processes and other issues; as well as hardware and software that process fare transactions, communicate transaction data, reconcile revenues, and others.
Transit agencies and elected officials in the Seattle area began planning for the RFC over a decade ago, and the project is currently (early 2006) testing and installing a subset of the equipment prior to a limited “beta” test in revenue service operations. The milestone events that launched the development phase of this project were the official signing on April 29, 2003 of the agreement among these partners (the Interlocal Agreement) and a contract with the vendor selected to provide the hardware and software for the electronic fare card systems (ERG Corp.) The beta test of the system is anticipated to occur in the third quarter of 2006, with full installation taking place in the first and second quarters of 2007, and commencement of regular system operations in the third quarter of 2007. The RFC partners are faced with implementing a fundamentally new way of doing business among agencies that have their own long-established systems and procedures, as well as a desire and willingness to arrive at a common, operable regional fare card system.
An Interlocal Agreement officially launched the development and testing of the Regional Fare Coordination project on April 29, 2003.
The Federal Highway Administration (FHWA) and the Federal Transit Administration see great value for other locations and agencies in documenting the processes that have been followed by the partners and the strategies that they have applied to address institutional, technical, organizational, governance, financial, contractual, and other challenges. To this end, the Battelle Team began working on a “lessons learned” evaluation of the project in February 2003. Since then, the Battelle Team has conducted interviews with many representatives of each partner agency, as well as with the staff of the Regional Team that is responsible for administering the vendor contract and overseeing the complex day-to-day system development process.
This report provides a timeline that outlines the history of this project and the events that have shaped it into its current form (Table 2). This history is still being created, and the project continues to evolve as it is developed and tested.
The RFC system is one of the few current national examples of large-scale regional fare card implementation projects. It holds great promise not only to improve the transit travel experience of residents of the Central Puget Sound region but also to serve as a template for the implementation and operation of a large, complex fare card system for transit agencies across the nation.
1.2 The Central Puget Sound Region
Figure 1 presents a map of the Central Puget Sound region served by the seven RFC partner agencies. The map shows the major urban centers in the counties that comprise the jurisdiction of the Central Puget Sound Regional Council of Governments, which is the Metropolitan Planning Organization for the region.[3] Figure 1 shows the major rail and freeway links connecting Everett in the north, Tacoma in the south, and Seattle and Bellevue in the middle. It also includes the Washington State Ferries terminals that link cities in Kitsap and Island Counties with the west side of Central Puget Sound.
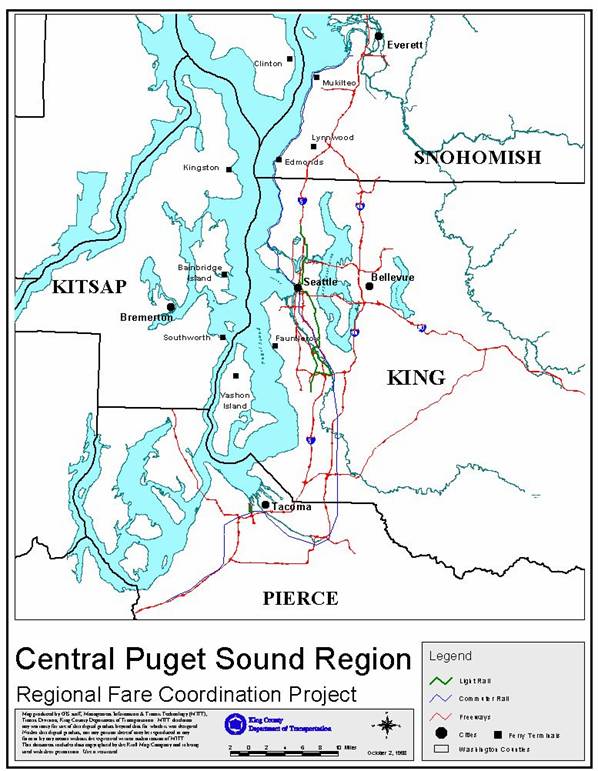
Figure 1. Map of Central Puget Sound.
Table 1 indicates the size of the region covered by the RFC Project in terms of population and land area.
| County |
Population (2005)* |
Land Area (Sq. Mi.)** |
|---|---|---|
King |
1,808,300 |
2,131 sq. mi. |
Kitsap |
240,400 |
393 sq. mi. |
Pierce |
755,900 |
1,676 sq. mi. |
Snohomish |
655,800 |
2,098 sq. mi. |
Region Total: |
3,460,4600 |
6,298 sq. mi. |
*2005 Population Trends for Washington State, OFM Forecasting Division, State of Washington, September 2005, T3.
**Quick Facts about the Central Puget Sound Region, Puget Sound Regional Council, 2000.
As shown in Figure 1, travel by highway and rail is substantially constrained by the geography of Central Puget Sound to take place in a north-south direction. One consequence of this geography and the large population residing and commuting in the Central Puget Sound region is a high level of traffic congestion. The Texas Transportation Institute (TTI) annual assessment of congestion in U.S. urban areas has consistently placed the Seattle area among the more congested areas in the country.[4]
In the TTI’s 2005 report, Seattle ranks as the 12th most congested out of 85 urban areas, with a Travel Time Index for 2003 (the most current data) of 1.38, indicating that travel in the area takes 38% longer during peak periods compared with free flow conditions. In just over 20 years, the index has risen to its current level from 1.07 in 1982 when Seattle ranked as the 27th most congested city. The region’s public transportation system serves a significant ridership and substantially mitigates this mobility problem. One long-term objective of the RFC Project is to enhance further the ease and attractiveness of the region’s public transportation system.
Data on travel flows between home and work are compiled under the year 2000 Census Transportation Planning Package (CTPP), the product of a cooperative program between the US Census Bureau, the American Association of State Highway and Transportation Officials (AASHTO) and individual state Departments of Transportation. CTPP data can be used to examine current patterns of public transportation use for the journey to work, as well as cross-jurisdictional flows and changing socio-economic and travel patterns over time. Figure 2 shows the number and percent of workers in 2000 who worked outside their home within the four counties (King, Kitsap, Snohomish, and Pierce) that comprise the region covered by the RFC Project. In 2000, roughly 10 percent of all King County residents who worked outside of their home used public transportation to travel to work, up from 9 percent in 1990. The important role that King County Metro Transit plays in the regional transportation system is apparent from this chart.
The Puget Sound Regional Council has published results of a recent study on the work trips in the region.[5] Trips to the region’s five major downtown business districts represent about 17% of all trips to work. About one-third of all the daily work trips from Pierce County (6,019 work trips) and Snohomish County (15,769 work trips) to the Seattle Central Business District (CBD) are by bus.
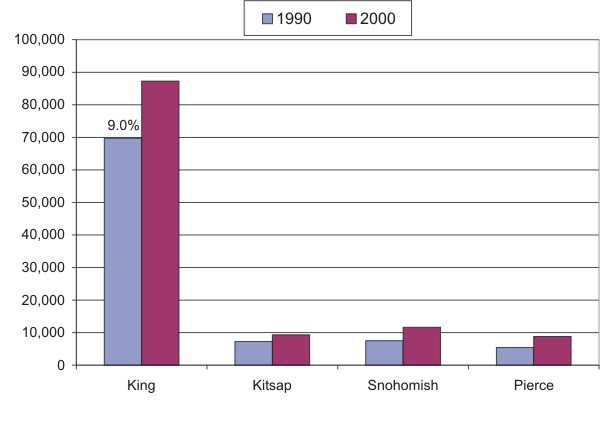
Figure 2. Average daily number and percent of persons 16 years and older
who work outside of their home and use public transportation
to travel to work, by county and year (1990 and 2000).
1.3 Organization and Objectives of Report
This report focuses on identifying practical “lessons learned” from an evaluation of the experiences of the Puget Sound area RFC partners.
This report focuses on the process of developing a regional fare card system in Central Puget Sound, and the experiences and lessons learned by each of the partner agencies as they sought to address their needs, to meet the travel needs of their customers, and to achieve a workable regional consensus. It is not intended to be a comprehensive evaluation of all aspects of this complex project; rather, it seeks to convey a clear understanding of the range of institutional and organizational issues addressed throughout the development of the project and how they were resolved. The report seeks to offer an objective outside perspective on those institutional and process elements that will be of most value to a general audience, including in particular other transit agencies that are considering developing or participating in similar regional fare card initiatives.
The evaluation addresses the evolution of regional and agency-specific policies, the motivations for and against participation, the issues and challenges faced by each agency, and the decisions and compromises that were made. It seeks to tell the story of how this particular project was developed, in a way that will be useful and informative to others who may be considering implementing a similar fare card system. The report describes the context in which the RFC Project is being implemented, the historical timeline and key events, and the characteristics and experiences of the partner agencies as they sought to work through a host of organizational, institutional, contractual and technical challenges. It seeks to extract from this evaluation lessons that will be useful to others across the nation. The report contains the following chapters:
Chapter 2. Evaluation Approach and Objectives
Chapter 3. Partner Agency Characteristics and Relationships
Chapter 4. Motivations for Partnership
Chapter 5. RFC Project Timeline
Chapter 6. Governance, Communications and Decision-Making
Chapter 7. Project Management
Chapter 8. Issues and Challenges
Chapter 9. Conclusions and Lessons Learned
1.4 Lessons Learned
This evaluation provides valuable “lessons learned” for agencies that are considering implementing a regional fare card system. Lessons learned are presented in shaded text boxes throughout this report.
There are many lessons that have been learned and are yet to be learned in the course of planning, developing, implementing, testing, and eventually operating the RFC Project in Central Puget Sound. In addition to its broader analysis and discussion, this report attempts to distill its investigation of the particular issues, challenges and successes of the RFC Project that are most likely to be of value to others into succinct statements of specific “lessons learned.”
Each lesson is a synopsis of a set of related issues. They reflect the thoughts and perspectives of the partners and other participants from the early conceptualization of the regional fare card system through the final design review, but short of actual system testing and implementation. They have been drawn from the Battelle Team’s observations and interactions with the participants over the course of this evaluation. Given the complex institutional and political environment in which the RFC Project has been developed, opinions on many of the issues covered in this set of lessons learned will inevitably vary.
The evaluation team has tried to present each lesson as objectively as possible, but caution is in order when considering the applicability of a lesson to different external situations and conditions. The reader is encouraged to seek additional background and evidence both from this evaluation report and from related documentation produced by the RFC Project Regional Team staff. Users of these lessons will want to adapt them to their particular circumstances based on their knowledge of the situation to which they are being applied.
The ITS JPO has established an on-line database system to make the lessons learned from a variety of evaluations readily accessible to anyone who may be interested.[6] The lessons presented here have been reformatted for posting on the ITS Lessons Learned web site in a way that is consistent with the standard template developed for this on-line database. Lessons learned are grounded in the experiences of the participants in this project and reflect what worked well, what didn’t work as well, an understanding of why, and how improvements could be made. They reflect practical, useful guidance for anyone interested in implementing a similar project elsewhere.
The lessons are summarized in separate text boxes that are imbedded in the report chapters to which they are most closely associated. Each text box covers a set of findings and insights organized around a general lessons-learned topic.
[2] There are provisions for other agencies to join in the future, but the current partnership configuration represents the great majority of regional travelers who stand to benefit from a coordinated fare card system.
[3] The PSRC membership includes King, Kitsap, Pierce and Snohomish counties, 70 cities, three ports, two Indian tribes, Washington State DOT, and the Transportation Commission. The region’s transit agencies and six associate members also participate in the Regional Council. See www.psrc.org for details.
[4] Schrank, D. and T. Lomax. 2005. The 2005 Urban Mobility Report. Texas Transportation Institute. (May).
[5] Puget Sound Regional Council. 2004. Origin of Work Trips to the Region’s CBDs. Puget Sound Trends. No. T24. (August).