
3. PARTNER AGENCY CHARACTERISTICS AND RELATIONSHIPS
3.1 Introduction
The seven agencies serving the Central Puget Sound region that joined the regional fare card partnership (Community Transit, Everett Transit, King County Metro, Kitsap Transit, Pierce Transit, Sound Transit and Washington State Ferries) are as diverse as the communities they serve. From the large-scale operations of King County Metro (KCM), the seventh largest transit agency in the US with nearly 100 million annual linked trips, to Everett Transit, a local transit agency with a 30 square mile service area, the characteristics embodied by the partner agencies drive the motivations and objectives underlying their decision to participate in the RFC Project. This section of the report examines these characteristics and sheds light on the structure, operations and communities served by these agencies. These determine the context from which each of the individual partner agencies approach a regional partnership, and contextual issues are important factors that influence the success of a regional fare card program.
3.2 Service Areas
The seven partner agencies serve the public transportation needs of the 3.5 million residents of the Central Puget Sound region of Washington State. The combined service areas of the partner agencies cover an expanse of 6,298 square miles. The size of the service areas and populations within them are highlighted in Table 2, and as the data show, they vary significantly between partners. Everett Transit serves the smallest population within the smallest service area (30 square miles), while KCM serves the largest at 2,134 square miles.
KCM is the largest provider of public transit service in the region, serving Washington State’s most populous county (King) and the Seattle area that, with its 3.5 million inhabitants, has the 14th highest population among U.S metro areas.[19] The KCM service area is far larger than that of any of the other partner agencies and, within it, KCM serves a population of 1.8 million.
Sound Transit and Washington State Ferries cover the Central Puget Sound area, encompassing 954 square miles and serving a population in excess of 2.7 million. The Washington State Ferry system is the nation’s largest, serving 10 routes across Puget Sound and linking major urban, suburban and rural areas in eight counties in Washington State and the Canadian Province of British Columbia.
|
|
Community Transit1 |
Everett Transit2 |
King County Metro |
Kitsap Transit3, 4 |
Pierce Transit5 |
Sound Transit6 |
Washington State Ferries7 |
|
|---|---|---|---|---|---|---|---|---|
Annual Unlinked Trips8 |
8,860,946 |
2,005,505 |
98,547,887 |
5,049,265 |
14,331,875 |
1,017,956 |
24,543,754 |
|
|
Bus |
8,266,233 |
1,924,034 |
71,009,626 |
4,078,056 |
13,265,299 |
|
|
|
Demand Response |
|
81,471 |
1,661,625 |
413,326 |
429,832 |
|
|
|
Trolleybus |
|
|
23,679,298 |
|
|
|
|
|
Vanpool |
594,713 |
|
1,793,748 |
219,363 |
636,744 |
|
|
|
Ferryboats |
|
|
|
338,520 |
|
|
24,543,754 |
|
Light Rail |
|
|
403,590 |
|
|
266,793 |
|
|
Commuter Rail |
|
|
|
|
|
751,163 |
|
|
Other |
|
|
|
|
|
|
|
Annual Passenger Miles8 |
124,636,958 |
6,938,050 |
532,406,507 |
27,494,767 |
122,457,811 |
18,972,495 |
193,507,330 |
|
Annual Vehicle Revenue Miles8 |
12,080,160 |
1,380,636 |
57,013,513 |
5,338,897 |
15,687,598 |
416,383 |
1,075,571 |
|
Annual Vehicle Revenue Hours8 |
552,796 |
116,855 |
3,976,491 |
298,238 |
890,156 |
11,597 |
136,159 |
|
Sources of Operating Funds Expended8 |
67,540,813 |
11,121,889 |
393,903,253 |
24,493,595 |
8,698,255 |
84,262,407 |
159,445,754 |
|
|
Fare Revenues |
12,140,586 |
1,018,853 |
75,679,704 |
2,046,223 |
8,937,798 |
11,624,553 |
50,504,731 |
|
Local Funds |
- |
6,639,210 |
255,705,389 |
21,481,700 |
10,344 |
70,257,620 |
- |
|
State Funds |
42,023,883 |
74,644 |
851,188 |
- |
38,157,715 |
- |
37,286,623 |
|
Federal Assistance |
7,020,865 |
2,085,306 |
22,542,434 |
- |
6,390,393 |
89,080 |
- |
|
Other Funds |
6,355,479 |
1,303,876 |
39,124,538 |
965,672 |
15,202,005 |
2,291,154 |
71,654,400 |
Vehicles Operated in Maximum Service8, 9 |
473 |
47 |
2,626 |
242 |
522 |
28 |
23 |
|
|
Bus |
237 |
34 |
1,183 |
85 |
199 |
|
|
|
Demand Response |
|
13 |
379 |
80 |
99 |
|
|
|
Trolleybus |
|
|
167 |
|
|
|
|
|
Vanpool |
236 |
|
894 |
75 |
224 |
|
|
|
Ferryboats |
|
|
|
2 |
|
|
23 |
|
Light Rail |
|
|
3 |
|
|
2 |
|
|
Commuter Rail |
|
|
|
|
|
26 |
|
Employees8 |
556 |
104 |
4,210 |
405 |
854 |
22 |
1,665 |
|
|
Vehicle Operations |
393 |
89 |
2,999 |
305 |
634 |
10 |
1,397 |
|
Maintenance |
77 |
4 |
894 |
56 |
123 |
6 |
175 |
|
General Administration |
86 |
12 |
317 |
45 |
96 |
6 |
93 |
Year of Establishment |
1976 |
1893 |
1973 |
1982 |
1979 |
1993 |
1951 |
|
Population of Service Area8 |
693,247 |
95,990 |
1,774,300 |
237,000 |
679,815 |
2,712,205 |
2,712,205 |
|
Size of Service Area (Square Miles)8 |
294 |
30 |
2,134 |
396 |
450 |
954 |
954 |
|
Governance10 |
PTBA |
City |
County |
PTBA |
PTBA |
Regional Transit Authority |
State |
|
Ultimate Authority |
Board of Directors |
Everett City Council |
Metropolitan King |
Board of Commissioners |
Board of Commissioners |
Board of Directors |
Washington State Transportation Commission |
|
1 Community Transit data not acquired from NTD obtained from the 2004 Community Transit Budget and 2002 Comprehensive Annual Financial Report.
2 Everett Transit data not acquired from NTD obtained from www.everettwa.org/transit/.
3 Kitsap Transit data not acquired from NTD obtained from Kitsap Transit's Transit 101, 2004 Edition and www.kitsaptransit.org.
4 Ferries are operated for Kitsap transit by a private operator.
5 Pierce Transit data not acquired from NTD obtained from the 2004 Pierce Transit Budget.
6 Data related to purchased transportation involving the operation of Sound Transit buses by other agencies included in Pierce Transit, Community Transit and King County Metro totals.
7 Washington State Ferries data not acquired from NTD obtained from the Washington State Ferries Progress Report for the 2001-2003 biennium and www.wsdot.wa.gov/ferries.
8 Data for these elements obtained from 2003 statistics reported in the National Transit Database (NTD).
9 Vehicle data include both directly operated and purchased transportation.
10 PBTA = Public Transportation Benefit Area.
Everett Transit (ET) and Community Transit (CT) both serve Snohomish County to the north of Seattle. Everett Transit’s service area is 30 miles, the smallest among the partner agencies. Since 1893, it has served the public transportation needs of the roughly 100,000 citizens of the City of Everett, Washington, which is the fifth largest city in Washington State. Community Transit was voted in by the citizens of Snohomish County in 1976, thus establishing the first Public Transit Benefit Area (PTBA) in Washington State. A PTBA is a special taxing district established under Washington State law for the purpose of providing public transit services to a local community.
In the past 29 years, the CT service area has expanded as portions of unincorporated Snohomish County voted to join the CT service area. Today, the CT service area covers most of the populated portions of Snohomish County, with the exception of Everett. The CT service area comprises 294 square miles with a total population of 693,000.
Kitsap Transit serves Kitsap County and its four cities located on the Olympic peninsula on the western side of Puget Sound. Puget Sound separates Kitsap County from Seattle and the largest population and employment centers in the region. The KT service area covers the 396 square miles of Kitsap County, with a population of approximately 237,000. Kitsap Transit links the three naval bases, including the Puget Sound Naval Shipyard (PSNS), and the commuting public with the eastern side of Puget Sound through intersystem transfers with the Washington State Ferries, which operates four terminals in Kitsap County. The largest employer in Kitsap County is the U.S. Navy.
Pierce Transit (PT) serves Pierce County on the south end of the Puget Sound region. The PT service area is 450 square miles, located to the south of Seattle and including the City of Tacoma and the U.S. Army base at Ft. Lewis. The population of the PT service area is 679,815.
3.3 Trips and Passenger Miles
In 2003, the number of unlinked trips[20] on RFC partner agency systems topped 154 million, generating 1 billion passenger miles.[21]
The largest provider of transit service in the region, KCM, served the largest customer base with passengers making nearly 100 million unlinked trips on KCM in 2003 (Table 2). Annual passenger miles on KCM exceeded ½ billion, or more than 53 percent of all passenger miles on the partner agencies’ transit systems in 2003. At the other end of the spectrum in terms of scale are ST and ET, which collectively served fewer than 2 percent of the passengers traveling on the partner transit systems.[22] Everett Transit is a largely urban transit system with an average trip length of roughly 3 miles, the shortest trip length in the region.
In 2003, the Washington State Ferry system transported more than 24.5 million passengers and 11 million vehicles across Puget Sound. The WSF system is the second largest mass transit system in the state next to KCM and its largest tourist attraction.[23]
Pierce transit transports more passengers annually than CT or KT (14.3 million versus 8.9 million and 5.0 million, respectively); however, passenger miles on CT exceed those on PT due to the significantly longer average trip lengths on CT buses. The average trip length on CT is 14 miles, while the average trip lengths on KT and PT are five and nine miles respectively. The longer average trip lengths are due to CT’s reliance on commuter traffic, which accounts for roughly 1/3 of its total riders. The KT system is designed to connect with the WSF system. Thus, average trip lengths are shorter than those on CT and PT, and total passenger miles total roughly ¼ of those on CT and PT (27.5 million versus 124.6 and 122.5 million, respectively).
3.4 Transit Operational Characteristics
The extensive regional transit system includes 1,738 buses, 1,429 vanpool vehicles, 25 ferryboats and 26 commuter rail vehicles that collectively traveled nearly 92 million miles and operated roughly 6 million hours in 2003.[24] The operation, maintenance and administration of the region’s transit system are performed by the nearly 8,000 employees of the seven partner agencies. Nearly 75 percent of these employees are directly involved in operations.
Sound Transit was approved by local voters in 1996 to implement a regional transit system called Sound Move, which included three distinct elements: Sounder commuter rail, running from Everett to Tacoma; Link light rail; and a 200-bus transit system connecting Everett, Tacoma, Seattle and Bellevue. The bus system is operated for ST by CT, KCM, ET and PT. Thus, although ST directly operates only a small number of light and commuter rail vehicles, the role it plays in the development and organization of the region’s transit system is much more significant.
Community Transit is primarily oriented around its large commuter passenger population, providing service between Snohomish County and major destinations in King County. In 2002, commuter lines were supported by 19 park and ride facilities connecting Snohomish County residents with the Seattle central business district, University of Washington and Washington State Ferry System. In 2003, CT operated 237 buses and 236 vans in maximum service.[25] The vanpool service is actually more extensive with 327 passenger vans, including those in part-time operation. In 2002, CT operated the third largest public vanpool system in the U.S.[26]
Everett Transit operates 47 vehicles in maximum service. These vehicles are operated locally, though there are several transit bus stops that link the ET system to the commuter service of CT. Everett Transit also provides paratransit service to residents of Everett and nearby Mukilteo seven days a week. In 2003, ET vehicles operated nearly 117 thousand hours over nearly 1.4 million miles. Everett Transit has 104 employees.
Washington State Ferries operated 23 ferryboats full time in 2003, traveling between 20 terminals on Puget Sound. Washington State Ferries had 1,665 employees in 2003, the vast majority of whom were involved in vehicle operations (1,397). The WSF ferryboats traveled more than 1 million miles in 2003.
Kitsap Transit also operates passenger ferryboats and relies on intersystem transfers with WSF to link the citizens of Kitsap County to the employment centers in Seattle, located on the eastern shores of Puget Sound. Kitsap Transit also operates a rideshare program and a unique worker/driver program. The worker/driver program was established out of necessity during World War II as thousands of workers traveled each day to the PSNS. In an era of fuel rationing and limited resources to compensate public transit operators, employees of the shipyard were required to operate the buses. The current worker/driver program operates 21 routes to PSNS and the Naval Station in Bremerton. The drivers are full time employees of the destination military facilities and serve as part-time employees of Kitsap Transit.[27]
King County Metro operates over 2,600 vehicles in maximum service, including electric trolleys, streetcars, dual-powered buses, hybrid electric-diesel buses, standard and articulated coaches, vans and a taxi scrip program that provides discounted taxi fares to area residents who are economically disadvantaged or disabled. In 2003, KCM operated nearly 1,200 buses on 258 routes.[28] It also operates the nation’s most extensive publicly owned vanpool system with 894 vans transporting more than 5,000 daily passengers. In 2003, annual vehicle revenue miles at KCM topped 57 million with vehicle revenue hours reaching nearly 4 million.
Pierce Transit operates 522 vehicles 890,000 hours annually. Pierce Transit operates both express and local bus services along 61 routes. The agency also operates a 224-van vanpool network and SHUTTLE, an on-demand service for disabled citizens. In 2003, the SHUTTLE system provided more than 500,000 trips to disabled passengers with a private contractor providing 70 percent of these trips.[29] The PT system also provided interconnectivity with Sound Transit and Seattle to the north and Intercity Transit and Olympia to the south.[30]
3.5 Financial Characteristics
The seven partner agencies operated on a collective budget of nearly $810 million in 2003. The agencies collectively operated at an 80 percent subsidy, largely met with local funds (43 percent). In addition to local funds, state funds accounted for 15 percent of total operating funds, while federal and other funds accounted for 5 and 17 percent, respectively (see Figure 3).
In recent years, the local contribution has grown due to the 2000 repeal of the state’s motor vehicle excise tax (MVET), which had formerly provided a significant source of revenue to the state’s transit agencies. In separate elections, the citizens of King, Snohomish, Pierce and Kitsap Counties voted to increase local sales taxes in order to address the gap created by the MVET repeal.
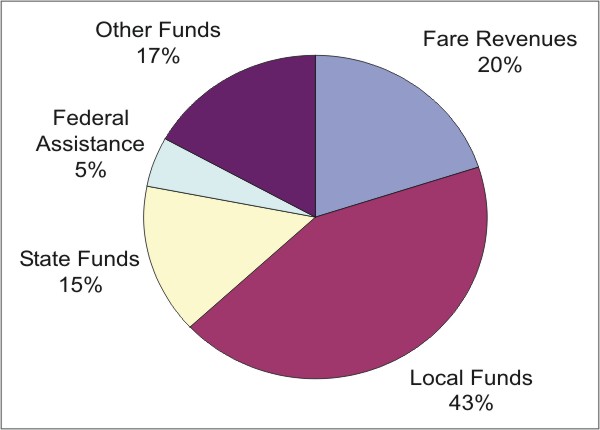
Figure 3. Source of operating funds.
The largest budget belongs to KCM, which operates at an annual budget of nearly $400 million, the majority of which (65 percent) is raised through local taxes and fees. The Washington State Ferry system is state operated and, thus, relies mainly on state funds and fares. Everett Transit is principally funded by the citizens of Everett. Sound Transit receives the vast majority of its operating revenues through a 0.4 percent local sales tax and 0.3 percent motor vehicle tax, which was authorized by Puget Sound voters in November 1996. The remaining partners (CT, KT and PT) are Public Transportation Benefit Area (PTBA) transit agencies operating on a mix of local, state and federal funds.
3.6 Regional Context
As has been shown for the Central Puget Sound partners, agencies considering a regional fare card project are likely to differ in a number of key contextual factors including:
- Customer base: travel patterns and preferences, demographic size/characteristics, rural/urban character, income levels, preferences for cash vs. pass accounts;
- Regional geography: diversity, distances, connectivity;
- Agency size and services: number of vehicles, system miles (fixed route, demand responsive, vanpool), regional versus local service balance;
- Agency governance structure: political context, organizational structure, decision-making;
- Technology applications and needs: legacy systems, new technologies, in-house technical sophistication and capabilities;
- Existing fare structure: number of different fare types; and
- Existing market structure: number of institutional accounts with local businesses to support employee ridership, passes.
Each Puget Sound RFC partner agency brought this context to discussions about participating in the regional program. Each sought to achieve a partnering arrangement that reflected their specific situation, and avoided arrangements or compromises that could jeopardize its ability to maintain and expand a satisfied customer base of transit riders.
The smaller, more rural and isolated partner agencies generally serve lower income customers who have a strong preference for paying cash for their transit rides. These agencies were concerned that their customers would be uncomfortable with anything other than a pay-as-you-go fare system, and that their lower income customers would not be able or willing to pay the minimum amount needed to purchase a fare card.
These transit customers might only rarely take the long-distance, cross-jurisdiction transit rides that the regional fare card is particularly designed to facilitate. Customers of Kitsap Transit, for example, are largely dependent on the Washington State Ferry system (also a partner agency) for access to the urban centers of Puget Sound, thereby further complicating regional travel.
Each partner agency lobbied for its own interests and those of its customers. None wanted to risk losing customers because of the RFC program. For some of the smaller outlying agencies, the estimated costs of participation exceeded the benefits they thought they could derive.
Several factors were critical in overcoming these contextual issues.
- Sound Transit promised compensatory funding to several agencies to offset potential losses from participation during the early years of the program. This served as a powerful incentive for joining in the partnership.
- Equally important, however, was the value each agency placed on supporting regionalism. The agencies believed that their best interests, including those of their customers, would ultimately be well served by supporting the regional partnership.
- The partners believed that a single fare medium would lower their costs and would be embraced by their customers for the seamless travel benefits it offered. Compensation from Sound Transit would cover the initial period during which the benefits of the new fare card could be promoted to and adopted by their customers, a process that agencies projected could take several years to accomplish.
- The partners adopted a RFC organizational structure that allowed each of these contextual factors, and the issues associated with them, to be addressed in a tiered fashion, beginning with discussions among intermediate-level Subject Area Advisory Teams. Issues that could not be resolved at that level were elevated to higher organizational levels.
Lesson: Contextual Factors Affect the Potential of a Fare Card Project
- A regional partnership arrangement must be able to address the specific characteristics of individual partner agencies and their customers.
- Identified issues should be tracked and discussed following the organizational procedures endorsed by the partnership. Ultimately, the governing bodies of each partner agency must decide where they have flexibility to meet the requirements of partnership participation and where they need to stand firm in support of their agency’s concerns.
- A cogent case needs to be made for the overriding value of regionalism. Factors that helped in the Puget Sound included funding that was made available to motivate participation and defray the early costs of entry, an experience base with an early and limited fare card program called Puget Pass, visits by RFC partners to the fare card experiment in the Bay Area, and support from the Washington State Legislature for meeting the interests of everyone in the region, a goal jeopardized by the prospects that some agencies might opt out.
- A RFC Governing Board (in the case of the Central Puget Sound RFC, the Joint Board) must operate with the best interests of the entire region in mind. Making decisions based on this ethic includes listening to the needs and circumstances (i.e., understanding the context) of each partner agency and seeking balance in decisions that affect the success of the program for the entire region.
- At a technical level, this means taking into account the technical sophistication of each agency, their legacy systems, and the hardware and software modifications planned or in place in ways that can work successfully for each partner as well as the whole regional system.
[19] The 14th highest population when including the Seattle-Tacoma-Bremerton metro area in the 2000 U.S. Census, U.S. Census Bureau.
[20] The term “unlinked trip”, as used in the National Transit Database (NTD), identifies the total number of passengers who board public transportation vehicles. Each time a passenger boards a public transportation vehicle, it is counted as an unlinked trip regardless of the origin and destination of the trip or the number of other vehicles boarded during the trip. The NTD definition may contrast with those applied by partner agencies, thus discrepancies could occur between NTD and agency data. This report presents published NTD data because doing so enables accurate comparisons between agencies, which are required to follow uniform procedures and guidelines when reporting to the NTD. Within this report, passengers and unlinked trips are used interchangeably.
[21] Federal Transit Administration. National Transit Database. 2003 Agency Profiles. http://www.ntdprogram.com/NTD/ntdhome.nsf/Docs/NTDPublications?OpenDocument
[22] The ST bus fleet is operated by KCM, CT, PT and ET. Passengers riding on these buses are attributed to the agencies operating the fleet.
[23] http://transit.metrokc.gov/prog/smartcard/sc_partners.html
[24] FTA, 2003.
[25] IBID. Vehicles used in maximum operation are those required to meet maximum service requirements. This includes all vehicles in operation on the week and day when maximum service was provided to the traveling public. This measure does not include one-time extraordinary events and does not include vehicles that are not in operation when maximum service requirements are met.
[26] Community Transit. 2002 Comprehensive Annual Financial Report. Snohomish County, Washington. 2002.
[27] http://www.kitsaptransit.org/WorkerDriverBusProgram.html
[28] FTA, 2003.
[29] http://www.piercetransit.org/history.htm
[30] IBID.