
Appendix A. Traffic Flow Data
As part of the baseline data collection activities conducted under the Phase I - National Evaluation of Selected FY 2001 Earmarked ITS Integration Program Projects, traffic flow data for vehicles entering and exiting the Detroit Metropolitan Wayne County Airport (DTW) complex was obtained by collecting traffic counts at three locations during two non-peak traffic days (October 22-23, 2003) and the peak traffic day (November 26, 2003) before the 2003 Thanksgiving holiday. Six tube traffic counters were installed to undertake 24-hour collection of vehicle counts.
The traffic counts collected at DTW from October 22-23, 2003 and November 26, 2003 were taken to support the following two objectives:
- Determine the baseline traffic at the airport during non-peak and peak traffic days for:
- 24-hour day (24-hour count).
- Morning (AM) and evening (PM) peak periods (approximately 6 to 10 a.m. and 4:30 to 7:30 p.m., respectively).
- Determine the split between the north and south entries/exits for:
- 24-hour day (24-hour count).
- AM and PM peak periods.
After implementing the Great Lakes Intelligent Transportation Systems (GLITS) airport components, these baseline data were used to determine if there is a statistically significant response to the GLITS system. These baseline traffic counts have been compared to post implementation data during a time period when significant messages are posted on the Dynamic Message Signs (DMS).
Figure 8 shows the three data collection locations used for the project. Location 1, positioned near the southern entrance to the airport, was the site from where counts were collected for vehicles entering/ exiting the DTW via the Eureka Road/I-275 access. Location 2 captured counts for northbound and southbound vehicles traveling between the Smith and McNamara Terminals. Near the northern entrance, vehicle counts were recorded for vehicles entering/exiting via the I-94 access from Location 3.
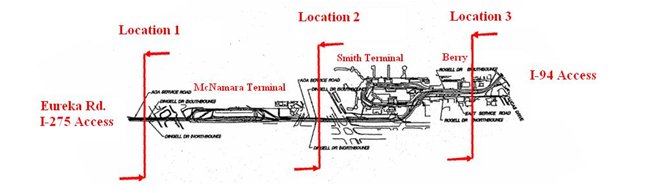
Source: Wayne County Airport Authority and SAIC.
Figure 8. Airport Traffic Count Locations.
The following sections describe the results of the DTW study conducted during the two non-peak traffic days (October 22-23, 2003) and the peak traffic day (November 26, 2003) before the 2003 Thanksgiving holiday.
Non-Peak Traffic Days (October 22-23, 2003)
During the non-peak traffic days of October 22-23, 2003, a total of 86,744 vehicles entered the airport and 84,921 vehicles exited via I-94 and Eureka Road access roads. Results for the collection period indicate an average of 43,372 vehicles entering and 42,460 exiting DTW each day. The actual number of vehicles entering and exiting DTW per day is shown in Table 8.
| Date | Entering | Exiting |
|---|---|---|
| Oct. 22, 2003 | 41,809 | 41,014 |
| Oct. 23, 2003 | 44,935 | 43,907 |
| Total | 86,744 | 84,921 |
Figure 9 and Figure 10 provide a graphic representation of DTW-related vehicle entering and exiting activity through both I-94 and Eureka Road. In Figure 9, the total number of DTW vehicle entries and exits by time of day are shown. For each 1-hour time period, the number of vehicles entering and exiting the airport is shown. The busiest time of day was found to be between the hours of 1 to 7 p.m., when 2,500 to 3,250 vehicles entered and exited, respectively. In terms of vehicles entering and exiting DTW, the least busy time was found to be between 12 p.m. to 5 a.m., with approximately 100 to 600 vehicles entering and exiting, respectively.
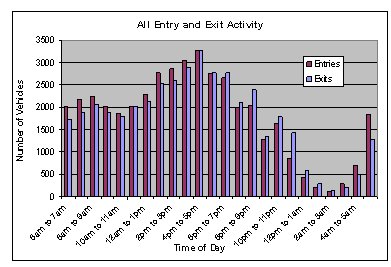
Figure 9. Total DTW Vehicle Entries and Exits by Time of Day.
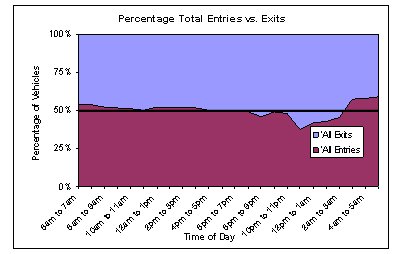
Figure 10. Percentage of Total Airport Entries and Exits by Time of Day.
Morning/Evening Peak Traffic
During the morning peak periods (6-10 a.m.) an average of 8,469 vehicles entered (2,116 vehicles per hour for the period) and 7,592 exited DTW (1,897 per hour for the period). The average number of vehicles per hour entering and exiting DTW using the north and south access roads is shown in Table 9.
| Access Point | Entering | Exiting | Total |
|---|---|---|---|
| North via I-94 | 1,478 | 1,167 | 2,645 |
| South via Eureka Road | 638 | 730 | 1,368 |
| Total | 2,116 | 1,897 | 4,013 |
Overall, nearly twice as many vehicles used the northern I-94 access compared to the southern Eureka Road access (2,645/1,368 vehicles, respectively). Given the greater proximity to down-town Detroit, about 70 percent (1,478/2,116) of the vehicles entering during the morning peak period used the northern airport access via I-94 versus about 30 percent (638/2116) entering via the southern Eureka Road access. Similar findings were found for exiting vehicles, where nearly 62 percent (1,167/1,897) used the north access route versus 39 percent exiting to the south.
During the evening peak periods (3-7 p.m.) an average of 11,718 vehicles entered (2,929 per hour for the period) and 11,688 exited DTW (2,921 per hour for the period). The average number of vehicles entering and exiting DTW per hour via the north/south access roads during the evening peak period is shown in Table 10. The ratio of north/south entries and exits were again found to be similar to the morning peak. During the evening peak period, nearly 65 percent (1,907/2,929) of the vehicles used the northern (I-94) airport access road versus nearly 35 percent (1,022/2,929) that used the southern Eureka Road access. Similarly for vehicles exiting during the evening peak period, about 66 percent (1,938/2,921) of vehicles used the north access versus 34 percent exiting to the south. Table 10 presents the number of vehicles per access road recorded during the Evening peak period.
| Access Point | Entering | Exiting | Total |
|---|---|---|---|
| North via I-94 | 1,907 | 1,938 | 3,845 |
| South via Eureka Road | 1,022 | 983 | 2,005 |
| Total | 2,929 | 2,921 | 5,850 |
North/South Traffic Morning/Evening Peak Movement
Vehicle counts for northbound and southbound vehicles traveling between the Smith and McNamara Terminals also were collected for the 2-day period. On average per day, 8,203 vehicles headed north and 8,254 vehicles traveled south. During the morning peak (6 to 10 a.m.), a total of 2,029 vehicles (about 507 per hour) headed north and 1,123 vehicles (about 280 per hour) headed south. During the evening peak period (3 to 7 p.m.) the 2 days' total of 2,009 vehicles (about 502 per hour) headed north, and 2,565 vehicles (about 641 per hour) headed south.
Based on time of day, Figure 11 shows the number of vehicles traveling northbound and southbound as measured between the Smith and McNamara Terminals. During the morning peak traffic period, the majority of vehicles are traveling north through the airport. Conversely, the majority of vehicles are traveling south during the 4-7 p.m. portion of the evening peak traffic period, as shown in Figure 12, which presents the percentage of vehicles heading north versus south.
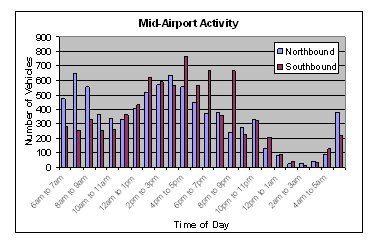
Figure 11. Mid-Airport Northbound and Southbound Traffic by Time of Day.
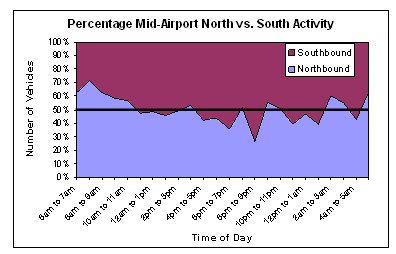
Figure 12. Percentage of Northbound versus Southbound Mid-Airport Traffic.
Peak Traffic Day (November 26, 2003) before the 2003 Thanksgiving Holiday
The vehicle counts collected on November 26, 2003 (the day before the Thanksgiving holiday) provide a baseline snapshot of traffic conditions on a peak traffic day. A total of 47,825 vehicles entered the airport, and 42,262 vehicles exited via the I-94 and Eureka Road access roads. (These figures contrast with the average of 43,372 entering and 42,460 exiting each day during the non-peak traffic day.) Figure 13 shows the total number of airport entries and exits by time of day. The data trend is similar to the non-peak traffic day in that the busiest time of day was found to be between the hours of 1-8 p.m., with from 2,500 to 3,400 vehicles entering and exiting, respectively. In terms of vehicles entering and exiting, the least busy time was found to be between 12 p.m. to 5 a.m., with fewer than 100 vehicles entering and exiting between 3-4 a.m.
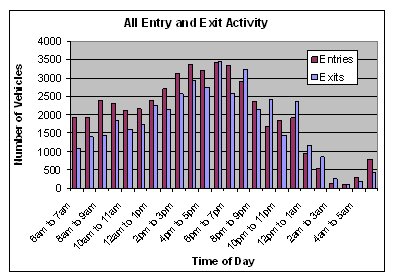
Figure 13. Total Airport Entries and Exits by Time of Day.
The graph shown in Figure 14 shows the inflow/outflow of vehicles. For the most part, more vehicles are entering the airport (inflow) from 6 a.m. through 7 p.m. than are exiting (outflow). Overall, it was found that during the 7 p.m. to 4 a.m. period, there were more vehicles exiting the airport than entering.
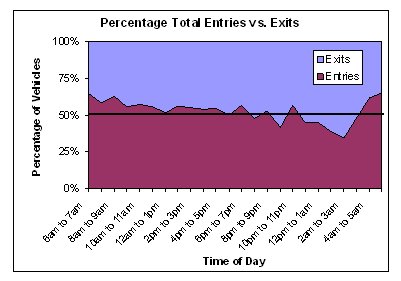
Figure 14. Percentage of Total Airport Entries versus Exits by Time of Day.
Morning/Evening Peak Traffic
During the morning peak periods (6-10 a.m.), a total of 8,547 vehicles entered (2,136 vehicles per hour for the period), and 5,773 exited (1,443 per hour for the period). The average number of vehicles per hour entering and exiting using the north and south access roads is shown in Table 11. Overall, about three times as many vehicles used the northern I-94 access road compared to the southern Eureka Road access (2,752 versus 827). As was previously reported, a greater percentage of vehicles used the northern airport access road via I-94 than the southern Eureka Road access. During the morning peak period about 76 percent (1,634/2,136) of the vehicles entered using the northern I-94 airport access road versus about 24 percent (502/2,136) that entered from the south Eureka Road access. Vehicles exiting during the morning peak period resulted in about 77 percent (1,118/1,443) using the north access versus 23 percent exiting to the south (325/1,443).
| Access Point | Entering | Exiting | Total |
|---|---|---|---|
| North via I-94 | 1,634 | 1,118 | 2,752 |
| South via Eureka Road | 502 | 325 | 827 |
| Total | 2,136 | 1,443 | 3,579 |
During the evening peak periods (3-7 p.m.) an average of 13,325 vehicles entered (about 3,331 per hour) and 11,668 exited (about 2,917 per hour). The average number of vehicles per hour entering and exiting via the north/south access roads during the evening peak period is shown in Table 12. Once again, about three times as many vehicles used the northern I-94 access road compared to the southern Eureka Road access (4,756 versus 1,492). During the evening peak period, about 77 percent (2,566/3,331) of the entering vehicles used the northern (I-94) airport access road versus about 23 percent (765/3,331) that entered from the south. About 75 percent (2,190/2,917) of vehicles exiting during the evening peak period resulted in using the north access versus 25 percent exiting to the south. Table 12 presents the number of vehicles per hour by access road recorded during the Evening peak period.
| Access Point | Entering | Exiting | Total |
|---|---|---|---|
| North via I-94 | 2,566 | 2,190 | 4,756 |
| South via Eureka Road | 765 | 727 | 1,492 |
| Total | 3,331 | 2,917 | 6,248 |
North/South Traffic Movement
Vehicle counts for northbound and southbound vehicles traveling between the Smith and McNamara Terminals on November 26, 2003 are shown in Figure 15. Per day, on average, 17,091 vehicles headed north and 17,854 vehicles traveled south (this contrasts with the counts obtained during the non-peak traffic days which had on average 8,203 vehicles headed north and 8,254 vehicles traveled south). During the morning peak (6-10 a.m.), a total of 2,521 vehicles (about 630 per hour) headed north and 2,930 vehicles (about 733 per hour) headed south. During the evening peak period (3 - 7 p.m.), the 2 days' a total of 4,591 vehicles (about 1,148 per hour) headed north and 4,844 vehicles (about 1,211 per hour) headed south.
Figure 15 shows, by time of day, the number of vehicles traveling northbound and southbound as measured between the Smith and McNamara Terminals. During the morning peak traffic period a slight majority of vehicles are traveling south through the airport (in contrast to October 22-23 non-peak days which showed more northbound vehicles). However, for the evening peak period, no clear trend emerges for northbound or southbound traffic flow. These results are shown graphically in Figure 16, which shows a relatively even split in the percentage of vehicles heading north versus south.
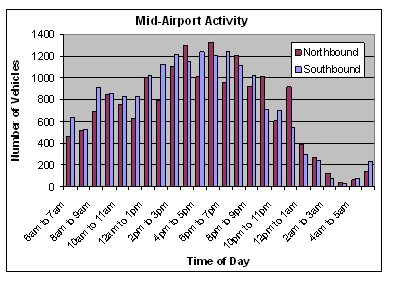
Figure 15. Mid-Airport Northbound and Southbound Traffic by Time of Day.
Figure 16. Percentage of Northbound versus Southbound Mid-Airport Traffic.