
System Performance Evaluation
The purpose of the system performance evaluation was to assess how well the ISSES performed in the field, relative to its design and its intended use as described by the system vendor through information such as product literature, specifications, and training materials. The evaluation team attempted to determine the performance of the radiation monitor, the thermal inspection system, and the laser scanner.
As detailed below, the system in Laurel County appears to perform reasonably well in comparison with expectations, and considering that it is the first installation of its kind in the nation. The system displayed real-time visual and digital-format information about the trucks passing through the ISSES portal, permitted users to scan retrospectively through data screens showing visual imagery and digital data on previous passing vehicles, and produced usable data archives from the various subsystems, with some limitations. The user interfaces in the scale house were intuitive and seemed to be easy to learn, given appropriate training.
This assessment was affected by several important factors:
- The local ISSES was not yet integrated with any state or national databases of historical safety, inspection, out of service (OOS), or registration/licensing information, so it was operating in a stand-alone mode.
- The staffing levels at Laurel County were such that no KVE inspectors were assigned to use the ISSES as part of their mainstream job duties. The system was in place and operating during the evaluation period, but as noted in the user acceptance section below, in general no one was attending to the information shown on the ISSES display screens. The inspectors appeared to consider the system to be still something of an experimental or test prototype rather than an integral tool to achieving their day-to-day safety and law enforcement goals.
- Related to the previous factor, the deployment took place in a larger enforcement context that has up to now measured safety improvements (and provided incentives to inspectors) based on the numbers of inspections completed, not based on achieving high rates of OOS orders among a set number of inspections completed.
- At the request of FMCSA, the evaluation team was asked to disregard the performance of the ALPR and USDOT number reader systems. These two subsystems, which if effective could help KVE achieve important safety screening goals, did appear to be operating during the evaluation period.
- Some of the data that were planned to be collected (e.g., electronic screening bypass data for the first week of the field observation and thermal imaging video data from the Laurel County site) were not available.
System Components, Configurations, and Outputs
ISSES consists of the following component technologies:
- A vehicle detection and classification system, which uses a laser rangefinder to detect commercial motor vehicles (CMVs) and measure their speed, height, width, and length, facilitating the identification of vehicle types based on key characteristics (e.g., number of axles).
- An overhead camera that documents the passing of each CMV by capturing an image of the vehicle (Figure 7).
- A radiation detection system, which measures gamma and neutron radiation levels, to help inspectors recognize potentially hazardous material shipments and cargo. Inspectors at the station were also provided with a hand-held radiation detection and identification device, which can be used once a truck has been parked for closer inspection.
- A thermal imaging inspection system, which displays and records IR and visible video of the CMVs as they pass through the sensors, allowing inspectors to detect thermal/visual anomalies.
- An automatic license plate recognition (ALPR) system, which captures and stores wide-angle and narrow-angle digital images of the front of passing CMVs and performs OCR on the tractor front license plate numbers.
- A digital USDOT number recognition system, which captures digital images of the sides of passing CMV tractors and performs OCR on the USDOT number posted on the side of each tractor.
For further detail on the purposes and functions of the ISSES subsystems, see the Technical Report (USDOT 2008).
Several of the ISSES subsystems have dedicated computer servers located in the scale house at the weigh station. ISSES is designed for installation at CMV weigh stations, where it can be used by weigh station operators to identify potential problems and/or safety concerns with passing CMVs and to compile CMV traffic data and other statistics.
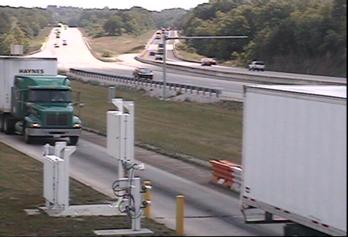
Figure 8 shows some of the ISSES components. The laser scanner apparatus is at right center, aimed downward at a slight angle toward the roadway. Four auxiliary photocell (conventional light beam) emitters/receivers are mounted in an “X” pattern on the upstream (left in photo) support poles of the two square, raised radiation portal monitors on either side of the roadway. These detection devices appear as small gray boxes in Figure 8. These electronic beams supplement the laser triggering system that detects the beginning and end of each passing vehicle.
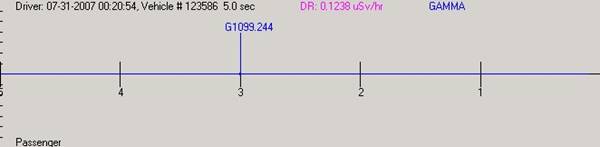
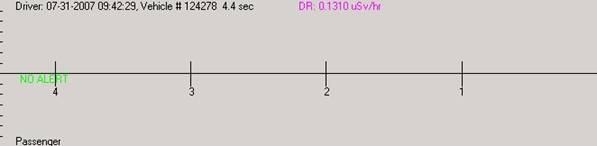
Sample output files from the radiation monitor systems at the Kenton and Laurel sites are shown in Figure 9. While the underlying data are the same, the two JPG images are configured differently. The Kenton images depict a timeline, whereas the Laurel image superimposes a plan view of a generic commercial vehicle. If the monitor detects and alarm condition that exceeds a preset threshold, both formats provide the inspector or analyst with a visual cue as to the location of the emitting source relative to the geometry of the vehicle. The radiation monitor detects both gamma- and neutron-emitting radiation sources, and sounds distinct alarms for each type of source if detected above the threshold.
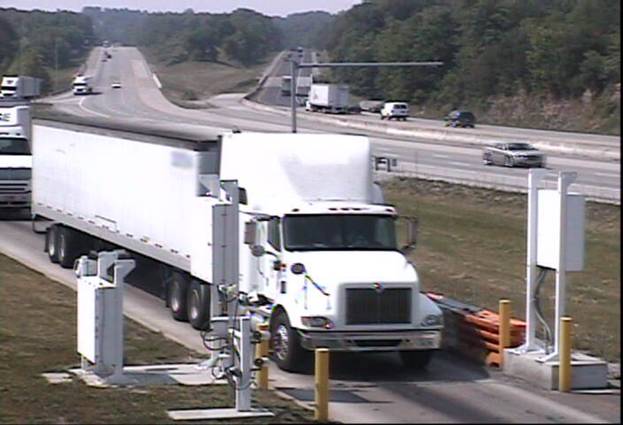
Figure 7. Example image recorded by overhead camera at the Laurel site.
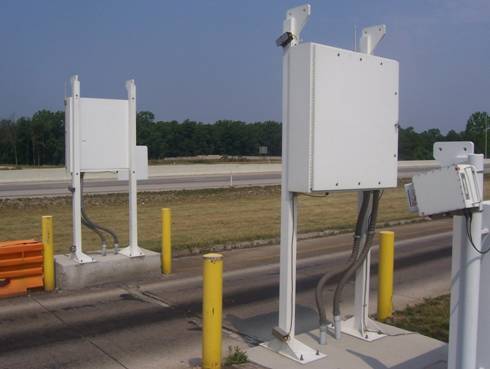
Figure 8. Laser scanner for triggering and classification (far right) and raised radiation portal monitors (left and center-right).
b. Kenton - No Alarm
c. Laurel - Gamma and Neutron Alarms
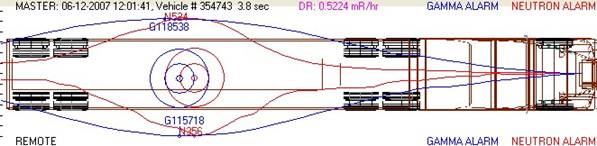
Figure 9. Graphic representations of radiation monitor output for CMVs passing through the Kenton and Laurel sites.
Figure 10 shows the thermal image cameras mounted upstream of the scale house on a pan-tilt-zoom pedestal controlled by the operator in the scale house. One camera captures IR, and the other captures mixed IR/color images. A third video, separate from but integrated with the thermal imaging system, is captured by a gable-mounted color overview camera that has pan-tilt-zoom capability, but is normally focused on the ISSES truck portal. Figure 11 provides an example of a still image from the composite video captured at the Kenton site. The three main images show color video from the gable-mounted overview camera (top left); IR (top right); and overlay, or combined color/IR (lower left).
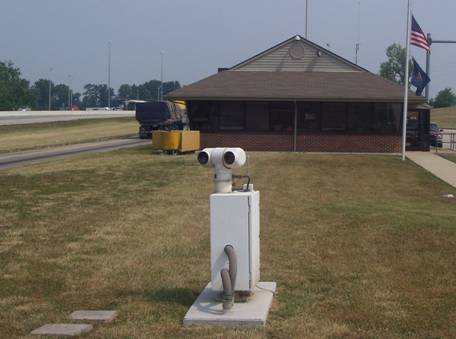
Figure 10. Location of thermal imaging video cameras at Laurel site, showing pan-tilt-zoom camera head.
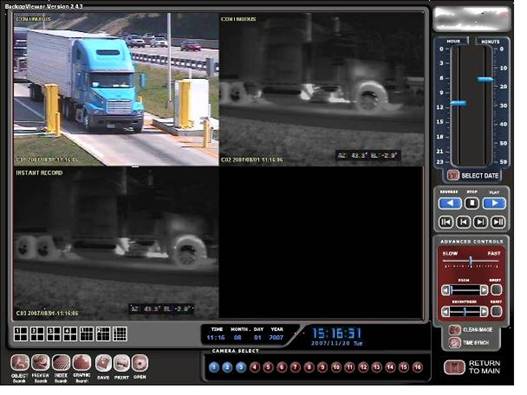
Figure 11. Images captured by thermal imaging video cameras at Kenton site, as replayed on DVR viewer.
Figure 12 shows the two ALPR cameras, installed with slightly different orientations. One camera is pointed more toward the right side of the vehicle front, and the other camera is pointed more toward the left front. Figure 13 shows the configuration of the USDOT number reader camera, located at about the height of the center of the tractor (cab) door. Examples of images generated by the ALPR system are provided in Figure 14.
When a truck’s USDOT number can be captured and interpreted by the ISSES optical character recognition system, ISSES generates a JPEG image of the portion of the vehicle containing the USDOT number with a date/time stamp corresponding imbedded in the event file name. An example JPEG image generated by the USDOT number reader is shown in Figure 15.
System performance data from ISSES deployments at weigh stations in Laurel County (northbound) and Kenton County (southbound) were included in this evaluation. The data used to assess system performance were collected during the following time periods:
- Laurel County station – 12:00 AM on June 11, 2007 through 11:59 PM on June 22, 2007 (12 days); and
- Kenton County station – 12:00 AM on July 31, 2007 through 11:59 PM on August 1, 2007 (2 days).
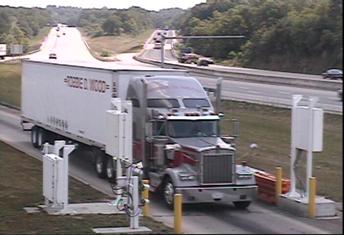
The research team visited the Laurel County site several times during the course of the field study. A data collector gathered USDOT numbers from all trucks passing through the ISSES portal for a two-week period during normal daytime hours (Figure 16). During these visits, members of the research team also conferred with KVE CMV inspectors, CMV police officers, and with vendor representatives from TransTech/IIS. Team members also observed the inspection selection process from inside the weigh station scale house, and they observed and photographed several inspections taking place (see Figure 6 above).
Research team members who visited the two deployment sites noted several structural or design differences between them, as outlined in Table 1. These differences illustrate some of the lessons learned in the first (Laurel County) deployment. The location of the visible lighting fixtures was changed at Kenton to reduce the amount of stray light reaching the mainline of traffic. Also, the lights at Kenton are positioned such that the light source is not visible to the approaching driver. The Kenton ISSES equipment was positioned approximately twice as far upstream from the scale house as the ISSES equipment at Laurel, in principle allowing Kenton inspectors more time to make decisions based on the system’s output. One other change at Kenton was the placement of all of the ISSES above-ground portal apparatus, except one of the radiation panels, on the driver’s (highway) side of the low-speed bypass lane. This change reduces the amount of equipment interfering with the sight lines between the passing vehicle and the inspector in the scale house, which is on the passenger side of the bypass lane.
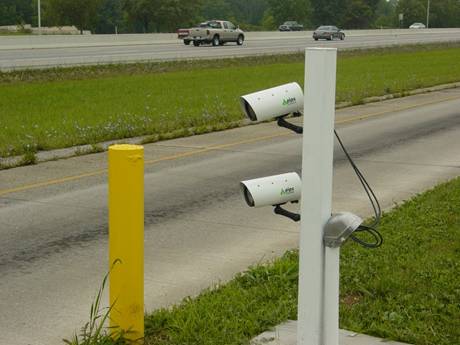
Figure 12. Two cameras used for ALPR subsystem.
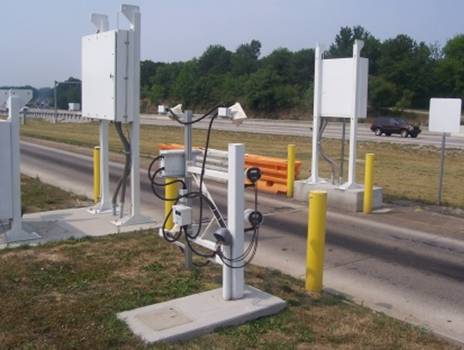
Figure 13. Rear view of USDOT number reader camera (at center foreground, on narrow post below two light fixtures). Two ALPR cameras are on larger post at right of USDOT camera.
a. Wide-angle - digits not recognized (no-read)
b. Wide-angle - digits identified
c. Narrow-angle/focused - digits not recognized (no-read)

d. Narrow-angle/focused - digits identified
![]()
Figure 14. Images generated by the ALPR system.
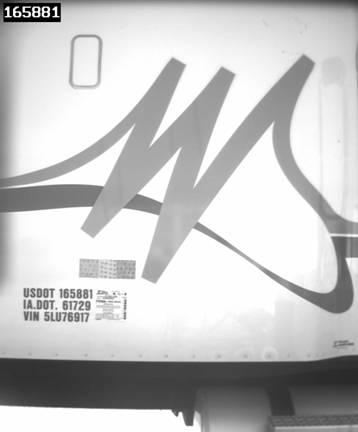
Figure 15. Image generated by USDOT number reader. Actual USDOT number is on passenger side of tractor cab (lower left). ISSES-generated OCR text conversion is superimposed at upper left.
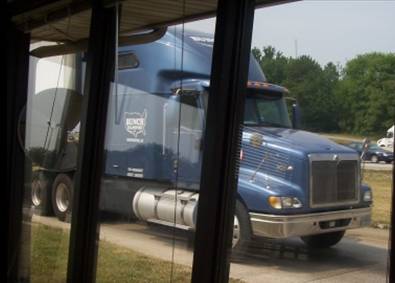
Figure 16. Viewpoint of evaluation team data collector observing nearby commercial vehicle traffic after passing through the ISSES portal at Laurel County.
ISSES Feature |
Laurel |
Kenton |
|---|---|---|
Lighting fixtures for USDOT number reader |
On passenger side, facing toward mainline |
On driver side, facing away from mainline |
Electrical supply conduits for lighting fixtures |
Visible |
Hidden |
Mainline weigh-in-motion (WIM) scale |
Yes |
No |
Sorter-Lane WIM scale |
Yes |
Yes |
ISSES location relative to scale house |
Closer to scale house |
Further upstream from scale house |
Radiation monitor panels |
On raised pedestals |
Lower, at grade level |
The ISSES main system monitor allows the user to view a summary of the seven to ten most recent trucks to pass through the ISSES portal. Figure 17 shows an example of the ISSES continuous monitoring interface. Once the user has chosen a particular vehicle for further analysis, he or she can select any of a series of individual system views, including the radiation (rad) server, the DVR (digital video recorder) server for the thermal imaging system, the ALPR (plate) server, or the USDOT number server. The user chooses these subsystem server views from the management interface screen (Figure 18).
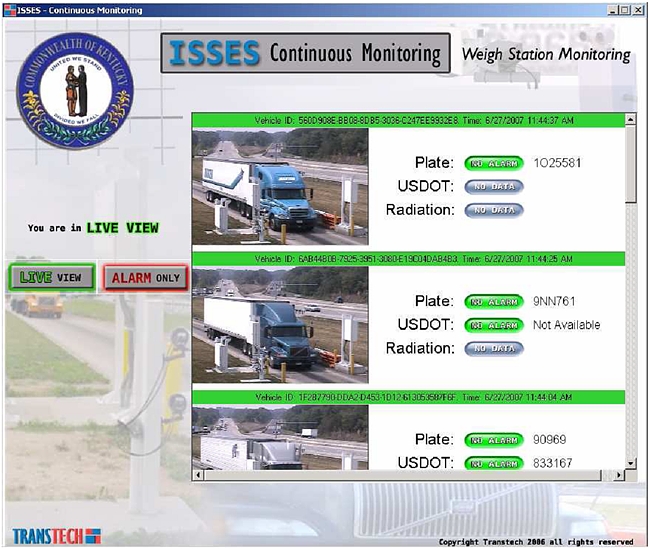
Figure 17. ISSES continuous monitoring interface, showing the “live view.”
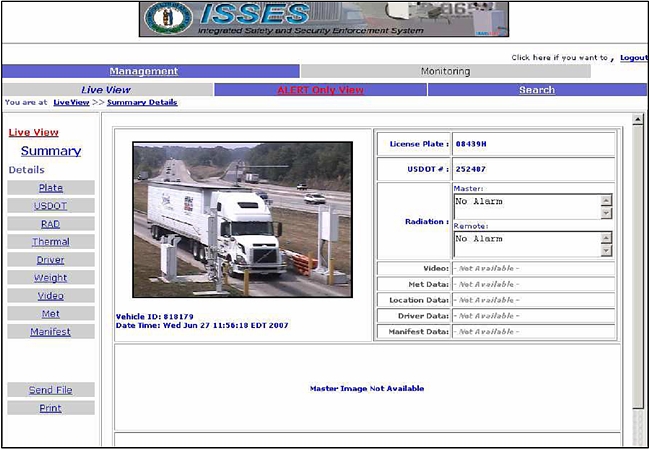
Figure 18. ISSES management interface, showing the server detail options at left.
System Performance Results
Laser Scanner (Vehicle Detection). There was some discrepancy between the number of vehicles counted by the research team staff member during site visits and the number of individual records generated by the software over the same time period. The software generated a significant number of records (i.e., distinct rows in the data file output produced by the software, which associates output for each vehicle from the radiation detector, USDOT number reader, overhead camera, and ALPR system in a single line) with “n/a” or “Not Available” values in columns that would normally contain OCR readings, file names, etc., which were not reported by the human observer.
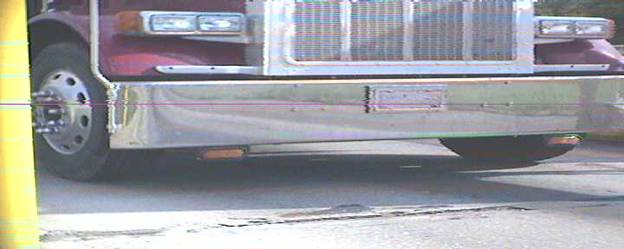
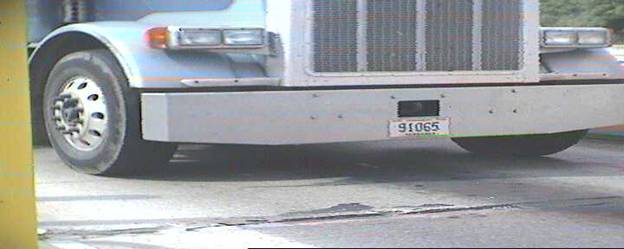
At the Laurel site, for example, 1,769 records were generated by ISSES during a span of approximately 8 hours on June 14. During the same time period, the research team member recorded 1,455 vehicles, a difference of 314 records. ISSES components occasionally triggered when no vehicle was passing through the portal. This type of error is depicted in Figure 19, which shows three images recorded in close sequence by the overhead camera.
[2, middle]
[3, last]
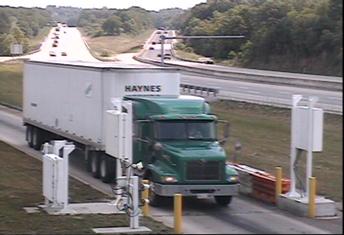
Figure 19. Series of images recorded by ISSES overhead camera at Laurel site on June 14, 2007.
Each of these images is associated with a separate record in the ISSES output file. However, image [2] was taken after the vehicle shown in image [1] had already passed through the portal, but before the vehicle in image [3] reached the sensors. In other words, image [2] should not have been recorded and represents an extraneous record, or row, in the output file. In general, records that contained nothing but “n/a” or “Not Available” values were considered by the research team to be associated with one of these three types of errors.
The vendor acknowledged to the evaluation team that vehicle triggering and ordering the time sequence of actual events in the resulting data files has been a challenge in deployment. According to the vendor, the decision was made to allow a certain number of extra or false triggers, in exchange for having a system that is more likely to collect usable data on any vehicle suspected of posing a radiological threat.
Radiation Portal Monitor. The research team assessed the general output of the radiation portal monitor. During the 2-week field observation, the ISSES recorded nine neutron alarm vehicles and 558 gamma alarm vehicles. Considering the approximate number of vehicles recorded during this period (28,000), the neutron alarm was activated by one out of every 3,111 vehicles, and a gamma alarm was activated by one out of every 50 vehicles. The inspectors indicated that staffing levels prevented them from inspecting every truck that tripped a radiation alarm. A tendency for nuisance alarms caused by naturally occurring substances has the effect of making inspectors more likely to ignore all of the bulk gamma radiation monitor alarms, as confirmed in the user acceptance interviews. According to KTC, the Laurel County site was adjusted in the fall of 2007, after the time of the field observation, to greatly reduce the frequency of nuisance alarms.
As noted in Table 1 above, the radiation portal monitor panels at Kenton (and Simpson) were configured closer to the ground, in comparison to the Laurel County site, where the panels are raised several feet above the roadway. Figures 3 and 4 above illustrate the lower height of the Kenton and Simpson County installations. For comparison, the higher-profile panels at Laurel County are shown in Figures 1 and 2.
Inspectors at the Laurel site report that the alarm as currently configured is too sensitive to low levels of radiation. As a result, the alarm activates whenever a CMV carrying harmless but gamma ray-emitting materials (e.g., bricks, porcelain, clay, granite, cat litter, ceramic tile) passes through the station, and staff are prone to ignore the numerous gamma alarms. The gamma detector gives more nuisance alarms than the neutron detector.
The system vendor reported that the ISSES radiation detector subsystem will not be optimized until true “risk matrices” are cross-referenced with USDOT hazardous materials rules and remote data to automate useable transportation safety alarms for inspectors. This “rules manager,” which is the final stage in the development of ISSES, will cross-reference sensor data from ISSES with remote data stores to give user-defined alerts to operators. For example, the system is being programmed by the vendor to provide an audible alarm when some kinds of radiation-emitting loads are observed being hauled by a carrier whose USDOT number is not associated with the appropriate certificates, credentials, or permits.
The vendor indicated that live testing of the ISSES radiation monitor was conducted through the Domestic Nuclear Detection Office of the US Department of Homeland Security (DHS), and that the systems were confirmed to detect passing loads that were emitting radiation. The vendor reports having seen no evidence through testing that the radiation monitor has issued any false alarms (i.e., an alarm sounds when no radiation source is present). As opposed to false alarms, the tendency for nuisance alarms in the scale house when naturally occurring substances pass through the portal is discussed elsewhere.
Infrared/Thermal Imaging System. The research team reviewed two days’ worth of video feeds captured by the thermal inspection device at the Kenton site. The objective was to determine whether potential heat-related defects were visible on the video and to track these defects. The independent review of the Kenton IR video was hampered by several factors. As indicated by the vendor, the IR camera from this period was used in a training exercise, mainly by untrained inspectors learning and using the system for the first time. The camera was not set up properly for the first seven to eight hours of the Kenton field study. Video images were extremely blurry (see Figure 20). At one point in the video, the camera settings were noticeably adjusted to provide the appropriate level of contrast between dark and light values (Figure 21).
This greatly enhanced the image; however, at the same time that the contrast was adjusted, the operator of the IR camera appeared to zoom in and pan the camera manually to move along with (i.e., track) each passing vehicle. This resulted in only a portion of the vehicle appearing in the IR camera viewer at any given time (see Figure 21). As a result, it was difficult to determine with any certainty that a particular tire, brake, or other component was giving off an unusual heat signature. These difficulties with the video image data appeared to be caused more by operator choices than by any inherent shortcoming with the technology.
The research team also noted a difficulty in correlating the image in the color (gable-mounted overview) camera viewer and the image in the IR camera viewer, on the three-part composite DVR player screen. As a vehicle approached the ISSES portal, it appeared on the IR viewer several seconds earlier than it appeared on the color monitor. This delay—most likely caused by the operator changing the aim of the IR camera while the overview camera remained stationary, or vice versa—was confusing, since the vehicle shown on the top right (IR) screen was often not the same vehicle visible simultaneously on the top left (color overview) screen (see Figure 21).
The research team was unable to cross-check video footage against Driver/Vehicle Examination Reports prepared by inspectors at the Kenton weigh station on July 31 and August 1, 2007, due to an inability to accurately identify the inspected vehicles on the IR/color video. USDOT numbers and/or license plate numbers from the inspection reports were used to find the date/time stamp on the USDOT number reader or ALPR output files and identify the time at which the vehicle passed through the ISSES portal. However, a review of the video at the corresponding times failed to identify vehicles with the same physical characteristics as those described in the inspection reports or shown in the still images captured by the ALPR/USDOT number reader.
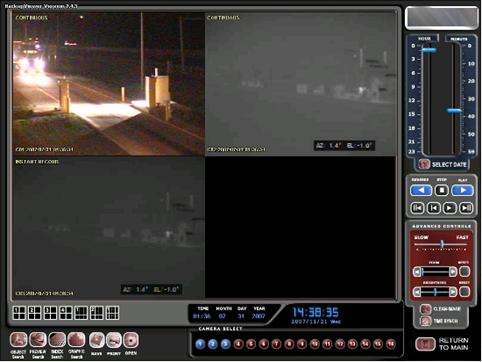
Figure 20. Image taken while contrast on the Kenton IR camera was improperly adjusted.
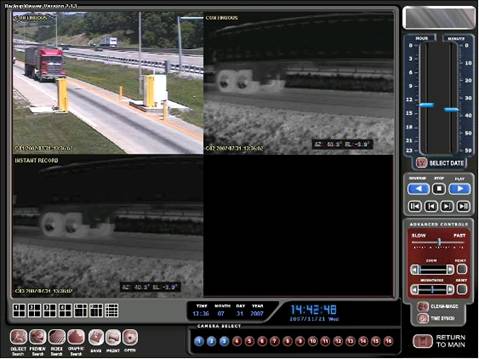
Figure 21. Image taken from Kenton IR viewer after contrast adjustment (note the time lag between the IR and color images and the inability to view the entire vehicle in IR mode).
The research team watched video taken several minutes before and after the specified time, but could not conclusively match the images with the paper inspection records. When asked, the vendor indicated that the computer server that synchronizes the system time clocks at the Kenton site was down at the time of the recording, and the DVR clock did not match the ISSES clock. Because of this hardware fault, therefore, a direct, retrospective comparison was not possible, given the state of integration between the thermal imaging subsystem and the other ISSES vehicle identification and triggering subsystems when this sample of image data was stored. Such integration between the truck images shown on the overview color camera and the thermal/IR camera will be critical for enforcement and accurate vehicle identification in future enhancements of the ISSES hardware and software.
USDOT Number Reader and ALPR System. These systems were not under evaluation, so no results are presented.
System Performance Conclusions
The radiation monitor appears to alert inspectors to potential radiation hazards. No attempt was made to simulate radiation-emitting loads to formally test the rates of false positive alarms or false negative (missed detection) alarms. The alarm system produces different kinds of audible signals in the scale house, shows graphic images of the location and strength of the radiation source, and records quantitative information on the alarm conditions for retrospective review. A tendency for nuisance alarms caused by naturally occurring substances, however, has the effect of making inspectors more likely to ignore all of the gamma radiation monitor alarms, which reduces their effectiveness as a tool for identifying true threats. As a rule, the KVE inspectors do attend to neutron alarms, which sound different in the scale house and are much fewer in number than the gamma alarms.
The thermal inspection device enables inspectors to see potential heat-related defective or malfunctioning equipment that might be missed in a visual review. The field of view for the IR image can be manipulated as to direction and width, enabling close-up or wide-angle views of the stream of traffic. The system also records video data (in both IR and color/visible light) for later review. The effectiveness of the thermal inspection system appears to vary depending on the training, experience, and skills of the operator, especially in synchronizing the views of the ground-level IR/color camera and the gable-mounted color overview camera.
The laser scanner appears to log every truck passing through the ISSES apparatus, but its adjustment is such that the system generates a certain number of extra (blank) records or extra trigger events, which is an impediment to later review of traffic data. For the sample of data reviewed for this evaluation, some gaps in the time synchronization were noted.
The ISSES appears to perform with a minimum of unscheduled downtime. Partly owing to the exposed geographic location of the Laurel County weigh station, the hardware has been subject to several outages caused by lightning strikes and other power drops or interruptions. The system has experienced a low rate of hardware failure, other than some events related to the reliability of electrical power to the site. The developmental version of the system software is not equipped with a self-restarting function, which is expected to be included in production versions. Also, the state and the vendor are investigating the installation of an uninterruptible power supply system for the ISSES.
As of mid-2007, the system appeared to be at a late stage in the product development cycle, not completely in full-scale production mode, but well beyond the field test prototype stage. It was not yet integrated with any current or historical state or national databases, which affected its usefulness for real-time enforcement applications, but it appeared to be functioning well in stand-alone mode.