5 Evaluation Approach and Methods
5.1 Introduction
The methodology used to assess the benefits and lessons learned associated with the use of an MDSS by the MaineDOT Scarborough crew involved a careful tracking of each of 12 winter storm events that occurred during the winter of 2006-2007, coupled with reconstruction of the crew’s decision processes and treatment actions throughout each event. The documentation of the event reconstruction involved a combination of the Scarborough crew maintaining a record of their actions and their uses of the MDSS prior to and during each storm event, and a post-event telephone interview with the crew and their supervisor conducted by the evaluation team. This approach allowed for an understanding of the role played by the MDSS under the conditions faced in each storm and the factors that influenced how the decision support tool was used and what types and magnitudes of benefits were afforded by that usage.
5.2 Storm Event Reconstruction
MaineDOT employs MATS to aggregate daily statistics on labor, materials and equipment usage and costs, plus the timing and nature of their treatments, for each storm event. Each event is assigned a storm number. This report examined only those storm events that required an action on the part of the MaineDOT Scarborough crew that also included input from the MDSS. Some of the early storm events that occurred in December 2006 (MATS events #1, #2, and #4) involved minor actions, such as treating a frosted bridge deck, before the MDSS was being consistently used. This evaluation tracked in detail 12 events, beginning with MATS event #3, and using a consecutive numbering beginning with Event #1.
Figure 4 below illustrates the timing of winter storm events that resulted in a maintenance response by MaineDOT Scarborough crews. The first twelve of these events were reconstructed in detail in this evaluation. The remaining six events were summarized briefly.2

Figure 4 . Start Dates for 2006-2007 Winter Storms in Scarborough Area, Maine
Each reconstructed storm event, with exceptions in the early events due to lack of data, included the development of a set of components that are illustrated and discussed below using a single example event that occurred in mid-February 2007.
- A table showing the key MATS statistics for the event. An example of one
of the storm events is provided in Table 2. The data show the type and amount
of precipitation as recorded by the crew, along with the start and end of the
storm and the actions taken. “Number cycles” represent the number of times the
crew salted or plowed and the time period and duration for those actions. The
MATS report serves as the basis for crew time reports, and it documents all
the labor and material costs incurred in dealing with each storm event.
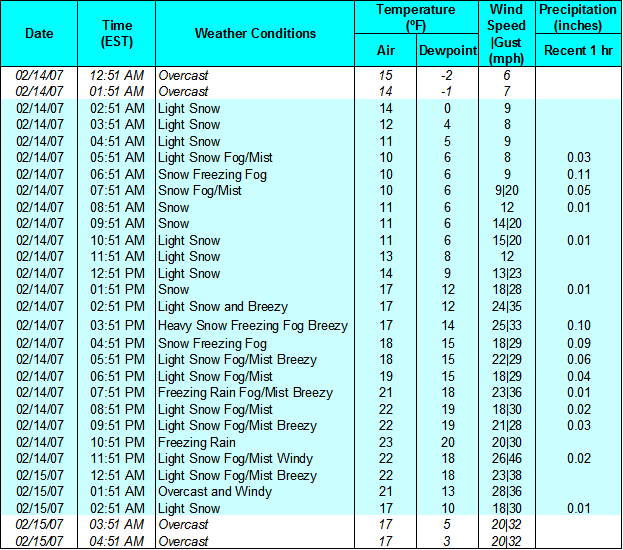
- A table showing the observed weather conditions as recorded automatically
at the Portland Jetport. The observational data that coincide with the start
and end timing of the event as designated in the MATS table are highlighted,
with a two hour buffer (shown in italics) at the beginning and end to
illustrate more context for each event. As shown in Table 3, these data are
not provided precisely on the hour. Precipitation is provided in inches of
liquid equivalent. Direct observational data on snow depth was not available,
but this was provided in the MATS reports based on crew observations (see
Table 2). Wind speed shows the prevailing speed along with recorded gusts. In
this example, the event was characterized by wide variability in the weather
conditions (precipitation type), including light snow, snow, heavy snow, fog,
mist, freezing fog, and freezing rain. These kinds of borderline conditions
between rain and snow from one hour to the next are very difficult to forecast
in advance. In addition, the Portland Jetport ASOS constitutes only one
observation point that can not represent conditions across the entire study
area.
Table 3 . Observed Weather Conditions, Portland Jetport ASOS, for Example Storm Event

Source: NOAA ASOS for Portland, Maine: http://www.rita.dot.gov/cgi-bin/ExitPage/good_bye.cgi?url=http://www.erh.noaa.gov/data/obhistory/KPWM.html
- A figure showing a radar image of the storm event at approximately the
middle (height) of the storm. This offers a visual sense of the geographic
coverage and intensity of the event. The scale illustrates the rate of
precipitation experienced at the time the image was captured. A small black
circle pinpoints the location of Portland, ME and the test road area. As shown
in this example in Figure 5, the storm covers most of the northeastern part of
the country, from Pennsylvania into parts of Canada. The most intense
precipitation is centered at this time over the Maine study area.

Figure 5. Radar Image of Example Storm Event on 2/14/07 at 4:00 PM
- Two tables showing the MDSS hourly forecasts and treatment recommendations
from the MATS designated start and end times of the storm. The exact timing of
these forecasts depends on the availability of archived data from the vendor’s
records.
- Table 4 reflects a forecast five and a half hours prior to the start of the storm. The intent was to provide a six hour forecast, but this was not always available from the archived MDSS data. Approximately six hours advance notice provides the MaineDOT Scarborough crew enough time to plan and execute pretreatment of the roadway before precipitation is forecast to begin. This table shows only selected information based on the MDSS forecast for this example event, including forecasted weather conditions by the hour, air and pavement temperature forecast, wind speed, snow fall, and the treatment recommendations (see referenced treatment numbers in the Appendix (Table A). Snow fall is an hourly forecast based on radar imagry and estimated liquid equivalent. In this instance, the forecast 5.5 hours prior to the onset of the storm is for a total snow fall of about 7.6 inches over the duration of the storm, which can be compared with the crew’s observation of snow fall after the event of 10 inches and the Portland Jetport ASOS observation of 0.6 inches of liquid equivalent.
- Table 5 reflects a forecast approximately one hour prior to the start of the storm. The anticipated utility of this forecast is greater accuracy, given its proximity to the start of precipitation. This forecast of a total snow fall of 11.3 inches comes quite close to forecasting the snow fall actually observed by the crew (10 inches).
- A figure that illustrates, across the duration of the event, the main
components and timing of the Scarborough crew’s treatment actions, the MDSS
forecasted precipitation type, timing, and air and pavement temperature
trends, and the observed weather conditions from the Portland Jetport ASOS.
These figures present the data in a 24-hour timeframe. Figure 6 shows in a
single figure several of the key components of the example event, including
the MDSS forecast, the ASOS observations, and the timing of MaineDOT’s
maintenance actions across a 24 hour period of the event. A particularly
instructive aspect of these figures for each storm event is the display of air
and pavement temperature trend forecasts, coupled with the forecast and actual
conditions. The MDSS offers similar graphics illustrating trends in forecast
parameters. From an event reconstruction perspective, this graphic
representation paints a picture of each storm event that includes selected
components of the MDSS forecast to aid in interpreting MaineDOT’s actions
across the course of the storm. It is also useful in visualizing the changes
over time in the parameters covered both by the forecasts (MDSS) and
observations (ASOS).

Figure 6 . Event Reconstruction Diagram for Example Event
- A table for each event that details all of the MDSS alerts provided to the MaineDOT Scarborough crew before and during the event. Alerts are provided for each of four designated forecast points along the roadway, plus the Scarborough camp. The provision of alerts is based on criteria programmed into the vendor’s MDSS web site by the MaineDOT Scarborough crew supervisor. Table 6 shows the initial few and final few alerts provided to MaineDOT over the course of this two day storm event. There were a total of 87 alerts issued. Those shown here give a flavor for the content of these alerts.
After all the winter storm events had been reconstructed, documented and analyzed, the benefits of the MDSS across all the events was assessed, and factors that could be shown to influence the extent to which benefits could be experienced from the use of an MDSS were assessed and documented.
5.3 Event Debriefing Interviews
A narrative was developed describing each event based on a telephone debriefing with members of the Scarborough crew and supervisor, coupled with an analysis of the available MDSS data and observational data from other sources. The debriefing discussion followed a structured set of questions that were designed to elicit what happened in each event, how the Scarborough crew responded to the event, what information was used to assist the crew in deciding how to respond to the event, and how information provided by the MDSS was accessed and used in the event. In summarizing the assessment of each reconstructed event, the intent was to determine and describe whether and how the MDSS was of benefit and the magnitude of that benefit, both in terms of costs averted through better timed and more efficient treatment actions and in terms of lessons learned from the response process that could be of value to other DOTs. A key element in these post-event discussions was to explore with the supervisor and crew how they thought they would have responded in the absence of the MDSS as a method for understanding the role and benefit of the MDSS.
MaineDOT agreed to provide their plow truck operators with small digital voice recorders that would allow them to record relevant information during each storm event with minimum distraction. Then they would meet with their supervisor after the event and compare notes on their experiences. The evaluation team drafted a short list of information items to guide the operators in the kind of information they could keep track of during these events. The purpose of the narrative recording was to facilitate remembering the details of the event and to support the debriefing after the event was over in order to have a good record of what happened, what was done, and how available weather information was used. The list included the following items:
- When were you called out for this event?
- What time did you leave the garage?
- For each action you took (e.g., chemical application, plowing, other
(define other case by case)
- What did you do (describe action taken and rationale for that action)?
- When did you begin the action?
- When did you finish the action?
- Where did you perform the action (e.g., describe location, road segment)?
- Did anything occur that hindered your ability to take that action (e.g., crash, very heavy traffic, other)?
- Did you receive any information or guidance over your radio? If so, what did it say, and what did you do in response? Did you make any change in your action due to the information? Describe. Your assessment of how useful the information was to you.
- Did you request any information? If so what? Discuss why and what you did with it.
- What time did you return to the garage?
- Provide any other thoughts/comments at the end of the event.
The initial process that was worked out during a meeting with the Scarborough crew and their supervisor involved an exchange of information between the crew and the supervisor in which the crew would relay the details from their experiences to the supervisor who would then record the information, as appropriate to each event, in an event record that was jointly designed by the evaluation team and the supervisor (see Table 7).
As it turned out, the crew met with their supervisor, and a call was scheduled with the evaluation team that included all the crew and their supervisor shortly after each event. In this way, they were able to recall the details of the event with agreement, and the recordings were helpful but not essential to the event reconstruction process.
Prior to the phone debriefing, the supervisor would provide the evaluation team with a copy of the MATS report that contained some of the data called for in Table 7. The data recording process was refined over the course of these debriefings, and the supervisor would take screen shots of the MDSS displays at various points in the course of a given storm event and share the information that had been provided during the debriefing. This facilitated the accuracy of the event reconstructions and helped document the uses and value of the MDSS information as it applied in each of these events.
Thus, each of the reconstructed events included a description of the event data recorded by MaineDOT, a sample of the forecasts and a list of all the alerts provided by the MDSS, a sample of observational data from the Portland Jetport ASOS, and a narrative reconstruction of the actions taken by MaineDOT and the rationale for those actions based on the telephone interviews. All of this information taken together led to an interpretation of evaluation findings, lessons learned and recommendations that are described in the following chapters of this report.
2 A decision was made during the Interim Briefing held in Portland, ME on March 7-8, 2007 to focus from that point forward only on bridge frost events that might occur because there were essentially no new insights emerging from the event reconstruction after the dozen already covered. In fact, no bridge frost events occurred after that time.


