
The RWMP has been promoting the use of weather information in transportation operations around the country through a variety of activities including providing tools and promoting best practices for road weather information integration, weather-responsive traffic management, Clarus Initiative, the Maintenance Decision Support System (MDSS), and ESS Siting guidelines. These activities provide guidance, services, and tools to transportation operators to improve their advisory, control and treatment operations. The measures under this goal track usage of available road weather information for advisory, control and treatment by agencies and travelers and try to identify the direct and indirect effects of the RWMP program.
The three measures included under Goal 1 focus on changes over time in the number of users (including agency and end-users) of road weather information and the deployment of two key technologies (MDSS and ESS) used to support decision making. The data collected under the seven indicators all demonstrate significant increases in access to and use of road weather information over the past three years. There clearly remains room for further improvement in the use of available road weather information and technologies, and the activities and services of the RWMP are contributing toward the successful achievement of Goal 1.
The use of road weather information by transportation agencies has existed in the United States since the 1970s. The growth in usage was stimulated in the early 1990s as the federal government, through the Surface Transportation and Uniform Relocation Assistance Act of 1987, made efforts to improve upon the use of road weather information systems and road weather service providers. The National Research Council’s Strategic Highway Research Program conducted a milestone study that summarized the state-of-the-practice and made recommendations on installation of sensors and utilization of road weather in winter maintenance decision-making (SHRP-H-350 and SHRP-H-351). Subsequent to this effort only limited federal attention was given to road weather utilization until the formation of the RWMP in 1999 as a result of increase road weather attention provided through the FHWA Rural ITS program beginning in 1997. While numerous state transportation agencies were already engaged in road weather information and its use in advisory, control and treatment decision-making, the RWMP quickly became a focal point for a concerted national effort to raise awareness of the benefits of road weather information and the identification and promotion of road weather best practices. Since 1999, a wide array of studies, stakeholder meetings, research efforts, and awareness raising activities have been conducted to foster a broader utilization of road weather information in transportation agency decision-making through adoption and diffusion of technology and sharing of practices across the transportation agencies.
Some key activities to foster greater adoption and utilization of road weather practices within transportation agencies include the following:
Ultimately, the above programs were intended to increase use at an agency-level. Measure 1 directly focuses on how many agencies are using road weather information for advisory, control and treatment decisions. There are four indicators that describe progress for this multi-dimensional measure:
The first indicator supporting Measure 1 for this goal focuses on state DOTs providing road weather advisory information to travelers. Advisory information may include cautionary messages, weather advisories, travel times, accident reports, or routing and diversion information.
Tracking data were compiled from responses to specific weather-related questions posed in periodic surveys conducted by the USDOT Intelligent Transportation System (ITS) Joint Program Office (JPO) to measure ITS deployments in the United States. Figure 4 shows the number of states reporting that they provide advisory weather information as part of four different technologies including Dynamic Message Signs (DMS), Highway Advisory Radio (HAR), 511 phone system, and traveler information website in 2004 and 2007. An assumption was made that if agencies were disseminating information in 2004, they would continue to do so if there was no response from the state in 2007 for the survey. If there was no response in 2004, 2007 data were not used for comparison in the chart.
Across these four technologies, the number of states offering traveler information of all kinds increased somewhat (average 19% between 2004 and 2007 with the greatest increase in the number of 511 systems around the country), but the provision of weather information (indicated by the colored portion of the bars) increased 46% on average. The provision of weather information on DMS increased the most, about 84% over this three year period.
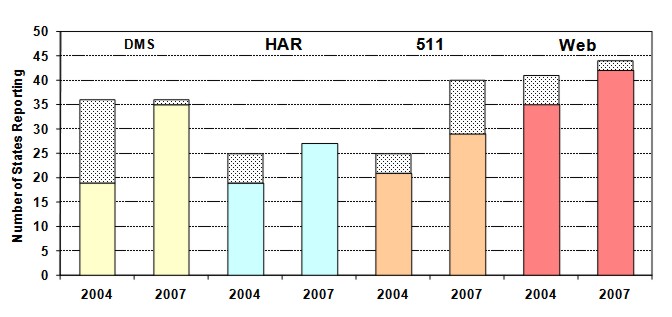
Figure 4. Indicator 1: Number of State agencies Disseminating Weather Information
to Travelers,
by Year and Technology6
However, the nature of weather information provided was not clearly identified in the above data and probably varies across the technologies and agencies. For example, DMS messages might vary from general weather advisories to specific route conditions. Weather information types that are being disseminated to travelers include:
Figure 5 shows there has been an increase in the types of data and information being disseminated across all information types between 2004 and 2007, with a 49% increase in all types of weather information being disseminated to travelers. Route-specific pavement condition information increased by 31%, and the provision of route-specific forecasts increased by 69% percent, although only 22 states reported providing this information and data in 2007.
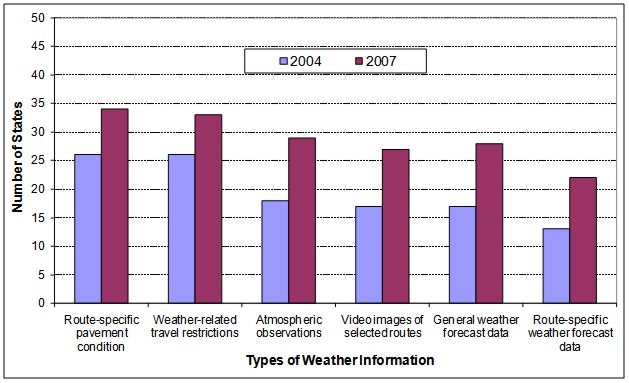
Figure 5. Number of States Disseminating Different Types of Weather Information: 2004 and 20077
The second indicator looks at the number of states using weather information, specifically atmospheric data and pavement-related data, to support their traffic operations.
These data were also derived from the state surveys in ITS Deployment Statistics. In 2004, a large number of states were already reporting use of weather data in traffic operations by the transportation agencies in their states, so by 2007 only relatively small increases were possible in overall reported usage. In 2004, 44 states reported that atmospheric weather data (e.g., air temperature, precipitation, visibility distance) were used in operations and 41 states reported using pavement data (e.g., wet, freeze point temperature, chemical concentration etc)8. By 2007, 46 states were reporting use of atmospheric data and 45 states used pavement data for operations.
However, the method and rationale for use of weather information was unknown at an agency-level. Also not known was how widespread the use of such information is across the state responding to the survey.
While 2004 data were not available9 and temporal comparisons cannot be made, in 2007, the ITS Deployment Statistics Survey reported states using a variety of weather-related control strategies (Figure 6).
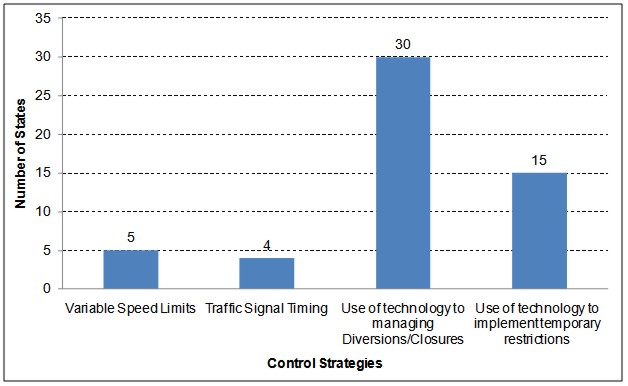
Figure 6. Indicator 2: States Reporting use of Weather Related Control Strategies in 200710
The third indicator supporting Measure 1 is the number of agencies adopting MDSS technologies and methods to improve their treatment operations during winter weather events.
2004 was the first year in which the RWMP advocated the adoption of MDSS technology. State DOTs that have adopted the MDSS also include those that have not yet implemented them, or have only used them in a limited deployment. By 2008, 30 state and local agencies were reporting some use of an MDSS, either in terms of partial geographic coverage or usage of only parts of the software system. Of those, five agencies reported operational use as part of their regular winter maintenance operations and decision support. Operational use means the system is being used as part of regular winter maintenance by the operational component of the agency to support decision making (see Figure 7).
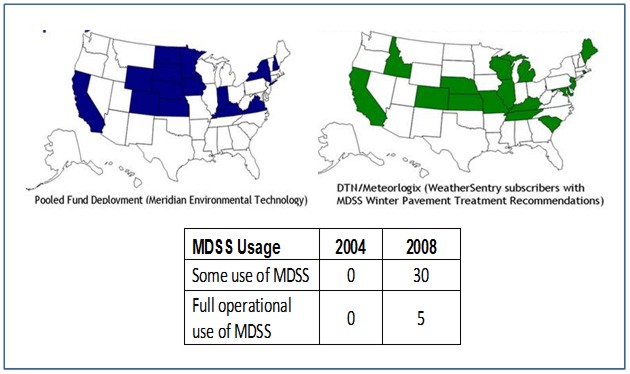
Figure 7. Indicator 3: MDSS Usage by States and by MDSS Provider (as of 2008)11
The fourth and last indicator used to operationalize Measure 1 examines the number of states with transportation agencies that subscribe to road weather products and services. These road weather products and services feed into all the advisory, control and treatment strategies.
Again the primary source of data was the ITS Deployment Statistics. Figure 8 shows the number of state DOTs that used weather information between 2004 and 2007 increased by an average of 31% with 45 state DOTs now utilizing National Weather Service (NWS) information, an increase of 29% from 2004. Thirteen (13) states in 2007 reported using airport observed weather products (e.g. ASOS, AWOS), an increase of 30% from 2004. Furthermore, 33 states subscribe to private-sector provided weather products, a 10% increase from 2004. These increases imply a heightened awareness of weather products along with the increasing relevance of these products in operations.
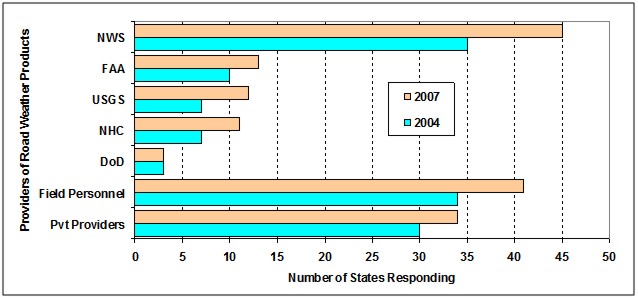
Figure 8. States that Subscribe to Road Weather Products and Services by Providers: 2004 and 200712
Advanced Traveler Information Systems (ATIS) have their origin in the early efforts of the Rural Intelligent Transportation Systems (ITS) concept that was promoted by the USDOT and the Intelligent Transportation Society of America. Rural ITS fostered the first statewide en-route traveler information systems, which incorporated road weather and road condition information as their central product. A Gallup poll conducted in 2001 indicated that weather information was the most highly valued and requested information from these statewide ATIS systems. However, most statewide ATIS systems (commonly 511 systems) do not include road weather information, and many do not even include atmospheric weather information. And while attempts have been made to foster greater use of road weather information within ATIS, the transportation agencies responsible for developing these systems often resist their inclusion, citing more pressing urban needs.
The key RWMP programs with direct and indirect effects addressed by this measure include:
Measure 2 for Goal 1 looks at how many travelers are using road weather information for making their travel decisions. While traveler information systems may take on many formats, there are not many existing data sources that isolate the weather-related usage of traveler information systems. In addition, assessing whether the road weather information accessed by travelers in either a pre-trip or en-route situation is making an impact on their decision-making has long been a challenge. Similarly, while many transportation agencies host web pages that include weather and road weather information, these agencies often do not collect information on the effectiveness of these web pages. Only through interaction with the travelers or through inference drawn from usage statistics (or a combination of these) is it possible to understand how the information is being used by the traveler.
One indicator was selected for this measure, namely, the number of travelers’ calls to states’ 511 travel information phone systems and the number of those calls that were directed to weather information on those 511 systems.
511 usage continues to grow and weather information is a part of several of these systems. However, weather-information on many of these systems is at a general level. In 2008, 33 states had 41 operating 511 systems, and 25 of those systems offered some form of weather or road weather information. No clear standards exist on what constitutes weather information on 511, although various resources exist. Very few states offer route-specific road weather condition information with most of the systems providing general weather or general road condition information.
Data for this indicator come from the 511 Deployment Coalition Database (as of June 2008), as well as the RWMP’s Baselining Current Road Weather Information study. The 511 Deployment Coalition collects monthly usage statistics provided on a voluntary basis by the 511 system operators. Usage information collected includes call volumes per month and Interactive Voice Response (IVR) statistics such as call durations and category selections (one of which is Weather). Not all systems report all the data on usage, and category selection data is limited across the systems. Also, most of the systems report usage on the phone system and data are very sparse for 511-websites.
Twelve systems reported category selections as part of the IVR statistics of their 511 phone systems. Average IVR statistics (for an 8-month period – Sept 07 to March 08) vary widely with a low of 1% of calls seeking weather information to about 44.5% of calls seeking weather information. In addition to the twelve systems above, seven systems provide weather information to all callers who call into their system; that is, 100% of the calls receive weather information.
For all the 38 systems reporting call volume between the startup of their 511 systems and June 2008, an estimate of the percent of calls seeking weather information was derived using the IVR statistics above. When IVR statistics were not available for a system, the average percent across the 12 systems was used. Approximately 13 million of a total of 109 million calls since inception (or 12% of the overall calls) are estimated to be travelers’ calls to 511 seeking weather information.
This estimated number of calls can be improved with continued reporting of usage over time by category selections by the 511 systems. The RWMP should work with the 511 Deployment Coalition to monitor monthly usage statistics collected by the Coalition to understand usage of the weather information on 511 websites. More broadly, given the varying nature of weather information on these systems, the RWMP should work with the 511 Deployment Coalition to endorse a broader incorporation of road weather in 511 systems and identify best practices and approaches.
The number of ESS deployed has been tracked by the FHWA RWMP for the past ten years, thereby providing an historical growth record over this period. At a basic level, the number of ESS deployed is a straight-forward measurement of road weather interest by state DOTs. The RWMP estimates that as of June 2008 there were 2,499 ESS of which 2,017 are part of a Road Weather Information System (RWIS). The remaining ESS are part of either localized agency use or not configured as part of a statewide network. Figure 9 shows the ESS deployments around the country in 2008.
While the growth in this number over the years is an important statistic, it can be misleading in several aspects. First, since many states have already deployed many ESS as shown on the map, the number of ESS in those states is not expected to increase substantially in the coming years. Second, it does not reveal the nature of the use of ESS.
The challenge of this measure falls into two distinct areas needing to be addressed: a) what is being done by transportation agencies to better use the ESS data available, and b) what has the RWMP done to promote the adoption of ESS technologies through increased deployment and utilization across state borders and within a given state. Developing a process to address the above questions will define the pathway to measure the RWMP performance.
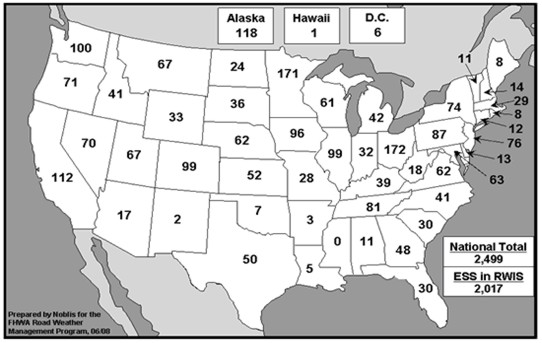
Figure 9. ESS Deployments in the United States:200813
The RWMP has conducted various research programs, guideline development, and outreach efforts associated with ESS deployment and utilization. These include the following:
Measure 3 examines the deployment of Environmental Sensor Stations (ESS) and their use by agencies to support their decision making. To capture the “use” element of the measure, three indicators were defined.
The first indicator assesses the number of agencies that are contributing their ESS data to Clarus. A rapid increase in connectivity to the Clarus system reflects recognition of the value to agencies of having easy access to quality-controlled data from a variety of sources in their states and regions.
RWMP and Clarus Systemrecords show that between 2006 and 2008, the number of agencies contributing their ESS data to the Clarus System increased from 3 to 33. These 33 agencies had a total of 1,700 ESS reporting to the Clarus System as of the end of 2008, which is about 68% of the ESS in the country. Ten agencies are pending connection to the Clarus System, and another 8 are considering connection.
The second indicator for Measure 3 addresses the number of agencies providing ESS data via the web for both agency and public use.
Data for this indicator were from the ITS Deployment Statistics Survey similar to the other indicators in Measure 1. Between 2004 and 2007 the number of agencies providing ESS data for agency use increased from 26 to 30 (15%), and for public use from 38 to 45 (18%) as shown in Figure 10.
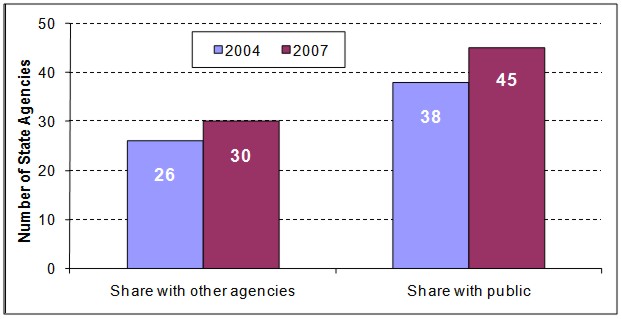
Figure 10. States Sharing ESS Data with Other Agencies and the Public14
6 Survey Question – “Does your agency provide road weather information to the traveling public? If Yes, Please specify the type of dissemination system(s) (Check all that apply).”
7 Survey Question – “Please specify the type of road weather information disseminated to the traveling public (Check all that apply).”
8 Survey Question – “What types of road weather information does your agency use to make operational decisions? (Check all that apply).”
9 A corresponding question was not posed in the 2004 survey.
10 Survey Questions:
11Source: Figure and data from the RWMP, as of 2008.
12 Survey Question – “What source(s) of weather information does your agency use to gather road weather information? (Check all that apply)”
13 Prepared by Noblis for the FHWA Road Weather Management Program, June 2008.
14 Survey Questions: