
The four measures under Goal 2 seek to quantify the extent to which agencies are engaging in activities that will enhance the safety, capacity, and economic benefits of addressing the impacts of adverse weather conditions on roads and travelers, and do that while also minimizing impacts to the environment.
Since the RWMP is not a legislative body and does not create or enforce regulations, most of the effects of the RWMP with respect to this goal have been through the promotion of best practices and services. Although many of the best practices and new technologies being promoted by the RWMP have only recently become available, state transportation agencies are eagerly adopting them.
Best practices have existed prior to the RWMP, and the RWMP has sought to promote and catalyze increased adoption and use of these techniques. Clear results are difficult to quantify in this early stage of deployment but the evidence to date suggests significant use and benefits. As more state transportation agencies proactively adopt these advisory, treatment and control strategies, significant additional progress is virtually assured. The Goal 2 measures are important to quantify, and actions by state transportation agencies are the basis for assessing RWMP performance.
This measure tries to quantify the level of impact the RWMP is having at a state transportation agency-level in terms of the agency perspective, participation and perceived benefits of the RWMP program.
The RWMP has incorporated state transportation agency participation in demonstrations and pilot projects for a number of innovative road weather research areas. Some of these include weather responsive traffic management studies, road weather information system research involving the National Weather Service and universities, the Clarus Initiative including the development of a multi-state regional demonstration and a Connection Incentive Program, the demonstration of the federal prototype Maintenance Decision Support System in several states, the evaluation of RWIS ESS siting guidelines, and the integration of road weather within traffic management. Each of these activities has included agency participation during various aspects of the R&D project activities. For the demonstrations involving agency participation there is a direct benefit gained through agency personnel involvement. Where stakeholder meetings have been held, the agency benefits indirectly from the R&D project by their participation and subsequent increased awareness of the technologies and results of applying these technologies. Through both the direct and indirect means, the level of benefit will also be modulated by the agency’s acceptance of new ideas and technologies.
Some of the benefits derived by the state DOT agencies from the road weather R&D projects are difficult to attribute to specific activities. This is because these benefits have been achieved by the RWMP championing the use of road weather information and technologies through such activities as training, outreach, demonstration projects, and best practices. The RWMP has fostered participation in road weather R&D projects through three primary means.
First, the RWMP has engaged the road weather community (i.e., stakeholder community) to participate in the discussion and review of R&D projects in order to maintain relevance with the road weather community and to develop agency champions to adopt the R&D project results. Second, the RWMP has conducted demonstrations and pilot programs that have directly involved the road weather community. The third approach has been to conduct research studies to assess road weather technology and identify best practices within the road weather community. The results of the latter two methods are often incorporated into the discussions and reviews for the first method.
As part of the assessment of performance measures, road weather stakeholders from state departments of transportation (DOT) agencies across the United States were contacted during the period of mid-May to mid-July 2009 (a list of individuals/agencies is available separately from this summary). Chosen for their knowledge of and involvement with the RWMP, 43 respondents were identified to contact. Thirty state agencies completed all or a portion of the interview. Two state agencies completed only a portion of the interview, citing a lack of road weather or road weather projects in their states. Nine agencies contacted via email did not complete the interview as they could not be reached by telephone. Three of the remaining four agencies were not contacted as the contact individual no longer worked for the DOT, while the last agency could not be reached via email to arrange an interview.
Figure 11 shows the benefits reported by agencies from the various activities of the RWM R&D program in which they are involved. Of the 24 respondents who reported involvement in one or more of the RWM programs, 21 (88%) said they experienced moderate or substantial benefits, with 50% noting moderate benefits and 38% noting substantial benefits. Three respondents indicated few benefits derived from the projects, and one indicated they did not know or were unsure. However, most of the respondents said they were involved in more than one RWM project (20 out of 24 respondents), and they offered comments to indicate which specific program they thought were particularly beneficial.
Each of these programs is relatively new, and agency involvement in many cases has just started. For this reason, a number of respondents said it was too early to know the level of benefit the agency can expect; therefore, at this point the respondents were more likely to report moderate benefits. Nevertheless, many mentioned they were pleased with what they had seen so far, and they thought these programs offered excellent potential benefit for their agency in the future. One respondent mentioned that having access to ESS data from neighboring states has benefited their weather forecasts. Another respondent indicated that the quality control associated with the data is the largest anticipated benefit. An additional benefit seen by one respondent was substantial environmental benefits to accompany the financial benefits.
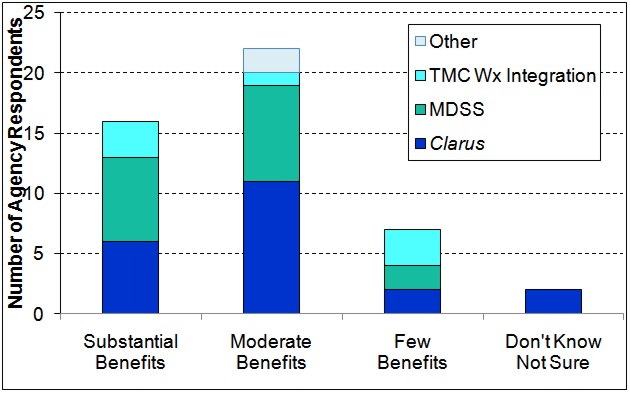
Figure 11 . Assessment of Benefits of RWM Programs in Which Agencies Are Involved
The impact of weather events on roadway safety and capacity is substantial. For example, Stern et al15 analyzed weather data and travel time data using regression and means analysis for the Washington D.C metropolitan area. They estimated that the average impact of precipitation on peak-period traffic was at least an 11% increase in travel time with a high likelihood of the impact being closer to a 25% increase in travel time. Also, Agarwal et al16 quantified the impact of rain, snow, and various pavement surface conditions on freeway traffic flow for the metro freeway region around the Twin Cities using detector data, automated surface observing systems (ASOS) at nearby airports, and ESS in close proximity to the freeway system. The study indicated that severe rain and snow caused the most significant reductions in capacity and operating speed. Heavy rains (more than 0.25 inch/hour) and heavy snow (more than 0.5 inch/hour) showed capacity reductions of 10%–17% and 19%–27% and speed reductions of 4%–7% and 11%–15%, respectively. The study also quoted several weather impact-related research studies that showed that the slightest amount of precipitation (also called a trace amount) either in the form of rain or snow reduces capacity in varying degrees. Similar significant impacts were found by other studies (Knapp et al17, Goodwin18, and FHWA19).
The RWMP is significantly directed towards minimizing the safety and capacity impacts of weather events primarily through dissemination of best practices in road weather management, to better treatment strategies through MDSS, advanced weather notification and alert systems, and weather-responsive traffic management, the RWMP has tried to link weather information to operations with the goal of minimizing safety and capacity impacts.
It is difficult to identify specific measures that document RWMP influence on safety and capacity, as the primary role of the RWMP as a catalyst of the WRTM program is in its early stages. Currently, the RWMP has enabled and continues to strive for a culture shift among traffic operators to a more proactive weather management approach that in turn will improve safety and capacity. The RWMP also has completed or is currently undertaking studies relevant to safety, including studies of the microscopic and macroscopic behavior of traffic in inclement weather conditions, weather-sensitive traffic prediction and estimation modeling, and evaluation of the effectiveness and safety implications of road weather advisory and control information.
Consistent and comparable national-level data on safety and capacity indicators do not exist for this measure, and the RWMP needs to identify new sources and mechanisms for tracking this information. Where they exist, they are primarily collected at a regional or state level. Surveys conducted for this measure revealed a varying degree of use of relevant performance measures.
One reply noted the current state performance measure is based solely on money, and when the state starts running low on money, the regions switch over to different chemicals. Another respondent noted their agency did not have statewide performance measures, but performance measures were left to the different regions. One other respondent noted tracking salt usage as a performance measure. [Note: This question permitted multiple responses]. For both winter and non-winter events a performance indicator is the frequency of use by agencies of road weather management controls to better regulate flow during weather events to promote safety.
The RWMP should encourage the tracking of key winter performance measures at a state-level to assess progress towards this measure, focusing especially on agencies/states that have implemented RMWP-supported products or services such as MDSS, MODSS or WRTM strategies.
The winter maintenance decision support systems for road weather management, including MDSS, are intended to provide state DOTs with more accurate and route-specific weather forecasts and road weather condition information to improve the timing of crew call-up and pre-treatment applications and guide decisions regarding which treatments and the timing and amount of those treatments with the objective of reducing staff and material requirements to most efficiently manage winter storm conditions and the impacts on pavement surfaces. MODSS systems offer comparable benefits at other times of the year for such activities as pavement striping, resurfacing, or roadside maintenance.
MDSS systems are currently offered by several vendors but they are in a very early stage of deployment and implementation by state DOTs. MODSS is only in a conceptual stage of development at this time. State DOTs that have adopted the MDSS include those that have not yet implemented them, or have only used them in a limited deployment (See Measure 1 under Goal 1). The latter include DOTs that are using their MDSS in some districts or locations and not others within their jurisdiction, or are using them along with other more traditional weather forecasting systems and therefore only partially basing their operational decisions on the MDSS.
National level statistics on expenditures for snow and ice removal are collected and available on an annual basis as part of the Highway Statistics publication series, a data compilation created and maintained by the USDOT FHWA Office of Highway Policy Information (OHPI). The data for state and local expenditures are reported by states and compiled. Figure 12 shows the national expenditures for snow and ice removal. The cost of snow and ice removal nationally is around $3 Billion annually.
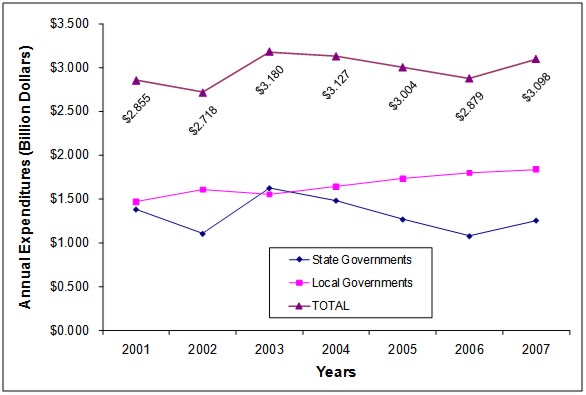
Figure 12. Annual Expenditures for Snow and Ice Removal (State and Local Governments)20
The annual totals are a weak indicator of RWMP performance. While long-term trends in the data above can be indicative of overall performance, seasonal and geographic variations in weather and road weather conditions, and local practices create significant variation in the data.
Of more importance from a RWMP performance standpoint is the evaluation of strategies that the RWMP directly or indirectly affects, and monitoring the benefits and levels of use. The RWMP is also sponsoring benefit-cost assessments of the MDSS to be able to demonstrate measurable cost savings as a way to further encourage states to support and fund deployment of the MDSS and MODSS.
As more states become aware of MDSS, either through direct involvement with the RWMP program and the federal prototype or through external actors such as the pooled fund and other private providers, the role of MDSS in providing quantifiable benefits in reducing labor and material costs for winter maintenance will become clearer. Table 6 lists the quantitative benefits currently reported due to the use of MDSS.
Decrease in Costs due to use of Maintenance Decision-Support Systems |
||||
|---|---|---|---|---|
Strategy |
Benefits |
Location |
Source |
Overall Level of Use in United States |
Agency Savings per winter by using MDSS to maintain same conditions |
$ 1,183,705 |
New Hampshire |
Western Transportation Institute & Iteris, Analysis of Maintenance Decision Support System (MDSS) |
30 agencies with some degree of use of MDSS, 5 with operational use |
$ 1,558,116 |
Minnesota |
|||
$ 1,717,583 |
Colorado |
|||
Agency Savings by using MDSS to make tactical shift deployment decisions |
$74,000 in shift savings (2008) |
City and County of Denver |
Battelle, Evaluation of an MDSS implementation in the City and County of Denver, forthcoming |
|
Agency Savings |
$12,108,910 (228,470 tons) $1,359,951 (58,274 hours) in overtime |
Indiana |
Indiana Department of Transportation (INDOT) Maintenance Decision Support System (MDSS): Statewide Implementation, Final Report for FY09, Draft, May 2009 |
|
In addition to MDSS, the RWMP has been promoting other best practices to reduce material and labor costs. Treatment actions such as anti-icing and pre-wetting have demonstrated significant material and costs savings.21 Overall, while national level statistics are scarce at this time, evaluations of MDSS deployments as well as of other treatment strategies show significant benefit and progress towards reducing material and labor costs. The RWMP should continue to track and compile evaluation results as a means of measuring performance of these decision support systems.
Each year 22 percent of injury and fatal crashes can be attributed to adverse weather and its effect on visibility and road surfaces (snow, rain, etc.).22 Weather is a contributing factor in many ways to crashes. Table 7 shows the different critical reasons for a pre-crash event. The data are for crashes in which the critical cause was attributed was roadway or atmospheric conditions. Among such crashes, about 75 percent were related to roadway conditions, such as slick roads, view obstruction, signs and signals, road design, etc. This consisted of about 50 percent crashes in which the critical reason was slick roads, 11.6 percent related to view obstructions, and 2.7 percent attributed to signs and signals. In addition, in 8.4 percent of the environment-related crashes, the critical reason was weather condition, the most frequent (4.4%) being fog/rain/snow. Glare accounted for about 16 percent of the environment-related crashes.
Causal Factors |
Number of Crashes |
Weighted |
|
|---|---|---|---|
Un-Weighted |
Weighted |
||
Roadway conditions |
 |
|
|
Slick roads |
58 |
26,350 |
49.6% |
View obstructions |
19 |
6,107 |
11.6% |
Signs/signals |
5 |
1,452 |
2.7% |
Road design |
3 |
745 |
1.4% |
Other highway-related conditions |
9 |
5,190 |
9.8% |
Atmospheric conditions |
|
|
|
Fog/rain/snow |
11 |
2,338 |
4.4% |
Other weather |
6 |
2,147 |
4.0% |
Glare |
24 |
8,709 |
16.4% |
Figure 13 shows the national trends for crash rates due to weather conditions per thousand overall population and licensed drivers. There may be a number of causes for the observed variations in rates since 2003 in addition to contributions by the information and systems that have been provided by the RWMP over this period.
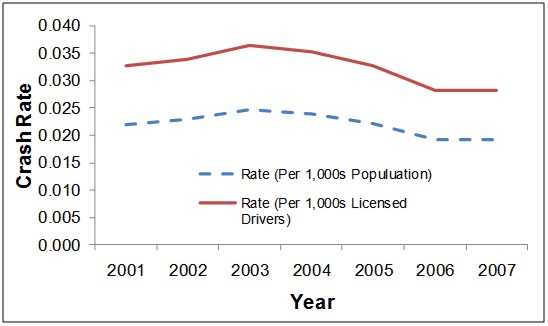
Figure 13. Crashes Attributed to Weather per 1,000s of Population and Licensed Drivers
Similarly, data compiled by the RWMP indicate that average speeds on roadways are reduced between 3% and 40% by weather that ranges from light rain to heavy snow.24 Empirical studies on traffic flow during weather show that weather events impact free flow speed, speed at capacity and capacity at varying intensities. Negative impacts for free flow speed ranged from a minimum of 2% (during light rain) to a maximum of 19% (during snow). Capacity reductions ranged from 10% to 20%.25
A direct measurement of weather-related delays is difficult to obtain at a national level. The data are sparse regarding state or local level delays. A potential model was developed in 2002 by the Oak Ridge National Laboratory26 to identify temporary reductions in capacity using national level data. The study estimated the capacity losses and delays due to fog, snow and ice events. The methodology allows for a national summary of capacity and delays due to weather events. For example, the study reported in 1999 fog, snow, and icy conditions reduced capacity on freeways and principal arterials by approximately 24 billion vehicles. This resulted in an estimated 543.9 million vehicle-hours of delay. Most of this estimated delay (90 percent) was due to snow in urban areas. Icy conditions accounted for 7 percent of the estimated delay from these weather conditions, and fog accounted for about 3 percent. The study broke down the delays for the following functional classes of roadways:
While RWMP actions have resulted in widespread dissemination of best practices in advisory, control and treatment strategies and have resulted in successful deployments nationally, the contribution of specific strategies on national crash rates is hard to determine and attribute to the RWMP program. Consequently, indicators in Measure 4 focuses on reductions in user costs associated with, for example, delays or crashes, due to specific road weather strategies that have been supported by the RWMP. Two indicators support this measure.
The primary source of data for tracking this indicator comes from the ITS Benefit-Cost Database maintained by the USDOT ITS Joint Program Office (ITS-JPO). The data in the Table 8 are a compilation of the benefits reported in various deployments around the country over an extended period of time. These data show estimated reductions in crashes in 2007 experienced by states that have deployed WRTM strategies. These data suggest that the RWMP, by encouraging the use of these systems and strategies, can have a significant beneficial impact on crash reduction and, hence, enhanced roadway safety.
Best Practices |
Percentage |
Level of Use by |
|---|---|---|
Fog Warning System |
70-100% |
~12 |
Road Weather Information System |
3-17% |
33 |
Variable Speed Limits |
8-25% |
5 |
Anti-icing Strategies |
7-83% |
nd |
Wet Pavement Detection |
39% |
nd |
Automated Anti-icing on Bridges |
25-100% |
20 |
Conditions on DMS |
2.80% |
29 |
Conditions on HAR |
nd |
18 |
Conditions on 511 |
nd |
23 |
Water Level Monitoring |
nd |
15 |
* nd = No Data
Similar to the previous indicator, the data for this measure is a compilation of benefits reported in various evaluations in the ITS Benefit-Cost Database. As is the case with crash reduction, RWMP best practices implemented by state DOTs have served to reduce speed, capacity and delay impacts associated with adverse weather. Table 9 shows the impacts of several of these strategies on capacities and delays.
Strategies |
Capacity and Delay, Impacts (examples from selected states)* |
Level of Use by |
|---|---|---|
Low Visibility Warning Systems |
More uniform traffic flow |
~12 |
Weather-related Signage on DMS |
nd |
29 |
Weather Information on 511 |
nd |
23 |
Highway Advisory Radio |
1/3 of CVOs reported considering changing routes based on information |
18 |
Variable Speed Limits/Speed Management |
Reduced average speed by 13% |
5 |
Weather-related Signal Timing |
Reduced vehicle delay 8% |
4 |
Weather and/or Road Condition Information on Websites |
94% travelers - better prepared to travel |
37 |
* nd = No Data
15 Andrew D. Stern, Vaishali Shah, Lynette Goodwin, and Paul Pisano, Analysis of Weather Impacts on Traffic Flow in Metropolitan Washington DC, American Meteorological Society, 2003.
16 Manish Agarwal, Thomas H. Maze, anf Reginald Souleyrette, Impact of Weather on Urban Freeway Traffic Flow Characteristics and Facility Capacity, Sponsored by the Aurora and the Midwest Transportation Consortium, Iowa State University, Center for Transportation Research and Education, 2005.
17 Keith K. Knapp, Leland D. Smithson, and Aemal J. Khattak, The Mobility and Safety Impacts of Winter Storm Events in a Freeway Environment, Iowa State University, Center for Transportation Research and Education, 2000.
18 Lynette C. Goodwin, Weather Impacts on Arterial Traffic Flow, December 24, 2002.
19 USDOT, FHWA. Empirical Studies on Traffic Flow in Inclement Weather. Report No. FHWA-HOP-07-073, 2006.
20 Data from USDOT, FHWA, Office of Highway Policy Information, Highway Statistics, multiple years, Tables SF-4C and LGF-2.
21 USDOT, RITA (2008), ITS Benefits, Costs, Deployment, and Lessons Learned.
22 Lynette C. Goodwin. Analysis of Weather-Related Crashes on U.S. Highways, 2002.
23 Data Source: National Motor Vehicle Crash Causation Survey (NMVCCS) (July 3 2005 to December 31, 2007), NHTSA, compiled as of April 30, 2008. Estimates may not add up to totals for independent rounding.
24 USDOT, FHWA, Road Weather Management Program. How Do Weather Events Impact Roads? [Website]. Accessed on August 27, 2009 from http://ops.fhwa.dot.gov/Weather/q1_roadimpact.htm.
25 Hranac, R., Sterzin, E., Krechmer, D., Rakha, H., and Farzaneh, M. Empirical Studies on Traffic Flow in Inclement Weather, Report No. FHWA-HOP-07-073, 2006.
26 Chin S.M., Franzese O., Greene D.L., Hwang H.L., Oak Ridge National Labs, Gibson R.C., University of Tennessee, Temporary Losses of Highway Capacity and Impacts on Performance, May 2002.