Executive Summary
Introduction and Background
This report takes a multi-modal look at the “lay of the land” of the real-time traveler information market in the United States. This includes identification and characterization of the gaps in the domestic industry with respect to data coverage, data quality, data procurement methods, and data usage. Ultimately, the focus is to identify the gaps in real-time information across different modes (i.e., traffic, transit, parking, and intermodal/freight). The analysis also documents the institutional, technical, and cost issues associated with collecting real-time data from these modes; opportunities for closing the gaps; and utility of real-time data for uses beyond traveler information. Although each mode offers a unique set of challenges, an important objective of this study is to identify opportunities to best leverage resources and innovative approaches that span multiple modes.
US DOT Objectives
The outputs of this study will inform the Intelligent Transportation System (ITS) Joint Program Office (JPO) research agenda and strategic focus, as well as guide future investments by the United States Department of Transportation (DOT) in continued research, demonstrations, and agency initiatives to support enhancing and expanding the real-time data marketplace as well as uses of real-time data.
One of the key objectives of this study is to identify gaps in current approaches, systems, partnering strategies, and technologies relative to the real-time traveler information marketplace across the modes of traffic, transit, parking, and freight/intermodal. The rapidly evolving real-time data marketplace will require transit agencies, the private sector, and even travelers to adapt to new ways of obtaining and receiving information. With this evolution comes challenges, and through research and discussions with industry experts, this study identified several institutional, technical, and cost/resource issues.
Additional objectives include:
-
Identify opportunities for closing the gaps, through emerging technologies and innovative partnerships, as well as leveraging data investments across both public and private data collection and integration capabilities, and identify the US DOT’s role to support these efforts
-
Document the institutional, technical, and cost issues associated with collecting real-time data from these modes
-
Identify the utility of real-time data for uses beyond traveler information. New data types pose unique challenges for agencies, including traffic management personnel, transit operators, parking facility managers, and commercial vehicle operators and dispatchers. Systems and agency processes that were designed to rely on specific data types or formats may not be able to readily accommodate new types of data. Support for continued or expanded investment in real-time data needs to take these issues into account.
Summary of Key Findings
This study examined several facets of the real-time data marketplace across multiple modes and the trends and gaps relative to coverage, technology applications, partnering and procurement, data quality, usage, and cost. This section provides a summary of the key findings within the major topic areas of coverage, quality, and usage.
Real-Time Data Coverage
Coverage of real-time systems has expanded over the last decade, due largely to the availability of technology, declining cost of communications, and broader communications availability, as well as expanded business models of the private sector. The impetus for broadening coverage for real-time data collection systems for the public sector is due primarily to operational needs; data that supports agency-operated traveler information systems is typically rooted in system operations as a key or primary function. This section provides an overview of current coverage for each mode.
Traffic Data Coverage by Agency-owned Systems
Freeways continue to be the primary focus for real-time data collection throughout the country. The public sector, private sector, and industry are in agreement that there is generally good coverage of urban area freeways through public-sector-operated sensor deployment systems. Deployment has been gradually increasing over the last 5 years (as shown in Table 1); however, only 39 percent of urban freeways currently have agency-owned, real-time, sensor-based systems to support real-time reporting of conditions (according to the most recent statistics from the ITS Deployment Tracking Database, survey year 2007).
Source: FHWA ITS Deployment Statistics Database
States indicated that there are gaps in coverage from what their systems currently provide. There are limitations in how much detection infrastructure can feasibly be deployed and maintained with current resource constraints. Arterials and rural areas were identified as key gaps/limitations of current DOT coverage capabilities.
The largest cities tend to have a higher percentage of freeway-mile flow data coverage, although even the largest cities fall significantly short of full freeway coverage. Figure 1 shows the coverage by public sector systems. The size of the circles corresponds to the relative number of freeway miles within each urban area, and the shading indicates how many of those have real-time flow coverage by agency-owned systems. In several areas, the coverage miles do not equal the urban area freeway miles. It is also important to note that there are gaps in the current reporting system to track coverage; there are several cities that did not have any coverage reported, although they are known to have ITS deployments.
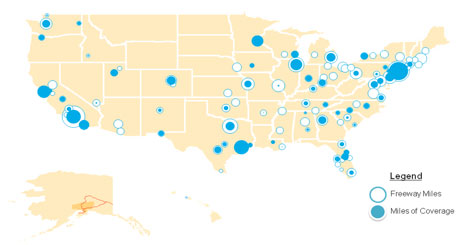
Figure 1: Real-time Flow Coverage
Statewide real-time speed and flow coverage (to include rural area Interstates, state routes, US routes, or others) does not occur. Rural corridors have, to date, been a lower priority for real-time data, so it has been difficult for some states to justify the investment. Available data on a statewide basis includes incidents, construction, and planned events, although this information is not always provided in real time.
Available data for arterials is primarily intersection detection data, but it is used exclusively for signal control; information usually does not leave the controller. When there is instrumentation to provide arterial conditions data, it is typically only on major arterials, rather than the entire arterial network. This limits the usability of this data to support arterial congestion information or travel times.
Road Weather Information Systems (RWIS) are a common ITS application, especially in cold weather states with snow and ice. Most areas do not have sufficient RWIS density to provide route-specific road-weather information. Weather data is also an area where DOTs can obtain information from other sources (such as the National Weather Service, universities, US Army Corps of Engineers, or others), which could limit states’ interest in making significant investments in their own data collection infrastructure.
Traffic Data Coverage by Private Sector Systems
With the growth in mobile computing power and mobile communications, the private sector is now obtaining traffic conditions data from in-vehicle sources, including global positioning system (GPS) devices (on-board or consumer-provided) or cellular phones. Over the past several years, the private sector has greatly expanded its geographic coverage of both urban and rural areas, and has the ability to collect flow/speed data on corridors beyond what is currently collected by public-agency, sensor-based deployments on urban area freeways.
Coverage of private-sector systems is represented in a number of ways. National providers (such as INRIX, NAVTEQ and AirSage) may represent “coverage” in terms of an urban area, corridor segment, or regional coverage (such as coverage linked to a cellular provider range/service area). However, their focus continues to be on Interstate routes in and near major metropolitan areas because this data is most in demand by their customers, including in-vehicle application developers; private-sector, Web-based traveler information systems; and media.
Other statistics of coverage reports by private sector providers include:
-
XM Satellite Radio provides traffic data from NAVTEQ in 80 metropolitan markets.
-
Total Traffic Network, the traffic information arm of Clear Channel, provides navigation data to in-vehicle devices in 95 markets.
-
INRIX provides incident data through a partnership with Clear Channel in 113 markets.
-
AirSage provides real-time, historical, and predictive traffic information for 127 US cities.
-
TrafficCast provides flow data in 28 markets, incident data in 138 markets, and construction data in 146 markets.
-
SpeedInfo, a private infrastructure-based provider, is a partner in 14 metropolitan areas. SpeedInfo provides data to both the public sector and other private sector clients. In some cases, SpeedInfo supplements or extends current data collection strategies already in place by the public sector.
Transit Coverage
Transit agencies of all sizes, even smaller agencies, are utilizing real-time traveler information to increase overall customer satisfaction. Each year, the US DOT Research and Innovative Technology Administration (RITA) surveys transit agencies across the United States to ascertain their use of transit systems management and operations tools and their deployment of ITS.
In 2007, 94 transit agencies across 6 types of transit vehicles (fixed-route buses, heavy or rapid rail, light rail, demand-responsive vehicles, commuter rail, and ferry boats) responded to the survey. For each vehicle type, agencies indicated the number of vehicles they possessed, whether these vehicles were equipped with automatic vehicle location (AVL) technology to track transit vehicle movements, and whether they electronically display automated or dynamic traveler information to the public. Table 2 summarizes the results of the survey. The table also describes information from a similar survey in 2004 to which 80 transit agencies responded regarding the number of transit vehicles that have automatic passenger counters (APCs), which track the number of passengers aboard a vehicle at any given moment, even if the information is not shared with the public.
Source: RITA, ITS Joint Program Office
Figure 2 exemplifies the diverse range of transit agencies across the United States that provide some form of real-time traveler information to their customers. However, the map also shows the large disparity in terms of agencies that have deployed AVL systems to their transit vehicles but are not fully utilizing their data by providing real-time transit information to the public. The map also shows that only two metropolitan areas (San Francisco Bay Area, California and Chicago, Illinois) have the capability to provide real-time information across multiple agencies and transit modes. Even these two agencies have yet to fully deploy these pioneering systems.
Figure 2: Transit Real-Time System Coverage (Metropolitan Areas)
Parking Coverage
There are a limited number of real-time parking information deployments in the United States (shown in Figure 3). Parking systems are concentrated in areas where parking is often scarce including transit station park-and-rides, airports, and central business districts. To date, most of the parking information systems (including detection) have focused on revenue applications; the introduction of parking locations or availability as a modal data point is relatively new. Most parking facilities are run by individual operators, resulting in a fragmented industry with limited inter-operator coordination. The figure also shows two metropolitan areas in California that are developing regional real-time parking information systems, including on-street systems, that will allow customers to locate a facility closest to them within the broad regional network. While real-time information is available for a limited number of deployments, advanced static facility information is more readily available across many facilities in major cities nationwide.
Figure 3: Real-Time Parking System Coverage
Freight Coverage
Both public and private sector data and traveler information applications for freight vary in scope and delivery. Privately run systems use onboard communications systems to track and provide information to a vehicle along its entire route. These systems provide information, of at least some detail, for the majority of roads in the United States.
Conversely, public systems are most often deployed by individual agencies and are more limited in scope. Some public sector systems seek to add freight-specific information to existing traveler information systems. Others’ systems focus on specific regions or locations where freight traffic is particularly high, such as border crossings and intermodal facilities. Much of the focus for publicly sponsored real-time freight information systems has centered on these types of facilities, which are choke points for the freight industry. Currently, many of these areas lack a centralized switchboard for truckers to receive information, and trucks often lack adequate communication links with ports because there is such a vast quantity of data points. Information, particularly intermodal information, often does not flow well at such hubs due to the size of the systems, the substantial capital costs, and the fact that companies are hesitant to share their proprietary freight information.
Data Quality
Quality encapsulates several parameters, including accuracy, timeliness, reliability, and granularity. For real-time traveler information to be effective, travelers must trust the information being provided to them. While the public does not expect information to be perfect, highly accurate data is necessary. It is also imperative to consider that the level of accuracy required will vary depending on who is requesting the information. There is a difference between the accuracy that is desired and the accuracy that is tolerated. Ultimately, however, users are the key measure of quality, both for agency traveler information systems and for private-sector data collection and dissemination systems.
Historically, the quality of traveler information data is not often formally measured and published, especially for the public sector. Rather, most internal assessments have focused on customer satisfaction and feedback. Past research has attempted to define reasonable standards for data quality for different applications, but actual reports on whether these standards are met are rare. Furthermore, there are no consistent standards on what makes for high quality data. Quality is a very subjective aspect of traveler information; some customers may have different quality expectations depending on their needs or current situation, and establishing a monetary aspect to real-time data (such as through subscription revenue models) may create even higher quality expectations.
Transit agencies are working to improve real-time information systems to reflect real-time conditions in response to customer demands. Transit schedule adherence is inherently variable, so real-time information tracking vehicle location and arrival times must be highly accurate in order to be useful. GPS AVL generally allows for extremely accurate data in real time, usually to within 30 feet of actual vehicle location and seldom more than 100 feet. Most agencies strive for data that is accurate at least 95 percent of the time, often striving for numbers as high as 98 percent. As agencies implement systems that provide real-time arrival and departure information, customers will become more dependent on higher quality data.
From the traffic perspective, various thresholds for data quality have been proposed in different contexts. The Real-Time System Management Information Program (RTSMIP) proposed rule (set to go into effect in 2010) includes the real-time information data quality targets listed in Table 3. This will be the first formal quality/latency requirement linked to traffic systems, with a focus on timeliness. It also requires attention to coverage with the metropolitan and non-metropolitan area designations.
Source: Real-Time System Management Information Program Notice of Proposed Rule Making
With the growth in private firms providing traffic data to the public sector, measuring data quality is becoming more important. New, innovative data collection techniques rely on combining traffic data from multiple sources to arrive at real-time estimates. Because many of these methods are new and unproven in all conditions, public agencies cannot rely on their familiarity with known technologies (e.g., point sensors) to understand the quality of this data. Therefore, public sector agencies must validate the data they are buying against the levels specified in the contract documents.
Some agencies typically measure the quality of data that is used to communicate traveler information to the public by:
- Validating travel times generated by detection systems (spot-check travel-time runs using GPS to calculate point-to-point times)
- Verifying incident accuracy by field devices and during travel-time runs
- Linking contractor fees for data supplied to the objective measure of quality resulting from private-sector validation efforts
- Considering the feedback received from phone and Web-based comments (particularly with 511 systems).
The system reliability of sensors can challenge the effectiveness of the data that is disseminated to the public. In California, according to the California Department of Transportation (Caltrans) Performance Monitoring System (PeMS), between 60 percent and 80 percent of Caltrans sensors are functioning at any given time. This is typical, if not good, for the industry. Some agencies actively assess the downtime of sensors (public-agency-owned or private-sector-owned) to ensure that the data they are receiving is reliable. Agencies also use the downtime information to determine private sector contractor fees, in that some contracts include metrics such as system uptime, downtime, or contractor response times, and link those metrics to monetary incentives or penalties (as in the case with system downtime that exceeds a specified threshold). Most states have successfully established sensor reliability standards on limited access freeways and incident data, although they need to improve the standards for planned event data/construction data.
A current lack of standards can diminish data quality across all modes. Data and communications protocols exist that support data formats (to a degree) and information exchanges, but there are several attributes unique to the various modes that require uniform standards in order to enhance the usefulness and overall quality of information provided to the traveler. Traffic managers can rely on the Institute of Electrical and Electronics Engineers (IEEE) 1512 standards to support incident reporting, although there is no consistent severity index that is uniformly applied. Similarly, there is also a lack of standardized information in determining and sharing incident reports for transit. Developing systems that use a standardized structure would allow for increased interoperability and improved real-time incident reporting to travelers.
Methods and processes need to be developed and utilized that will support data validation. With the growth in private firms providing data to the public sector, measuring data quality is becoming more important. Because probe-based and aggregated data are new and unproven in all conditions, public agencies cannot rely on their familiarity with known technologies (e.g., point sensors) to understand the quality of the probe-based data that they procure from the private sector. Early deployments such as the I-95 Corridor Coalition and Michigan Statewide Data Procurement will provide valuable insights to agency validation processes for probe (or consumer-generated) data, factoring in parameters such as data latency, densities or volume of data points, aggregated data from multiple sources, and other variability factors such as location or weather conditions.
Usage
Providing information to system users allows customers to make better decisions regarding the scheduling and routing of their trips to increase safety and reduce stress. In addition to providing users with information, the data stemming from real-time information applications can be utilized internally and allow agencies to improve their systems operations and performance. How the real-time data is used can influence quality requirements and thresholds, availability, coverage, and cost.
Traveler Information Uses
A variety of media exist to provide real-time traveler information. While each is at various stages of development, providing information through as many media as possible promotes information dissemination to the widest group of customers. Table 4 shows the various methods that public agencies can use to provide real-time traveler information.
Individual agencies track usage of their systems (511 phone, Web, e-mail alerts) as an important activity-based measure. At the national level, the 511 Coalition aggregates call volumes from 511 systems across the country. Usage has grown since the inception of 511 (shown in Figure 4), due to increased awareness as well as the number of deployments now active.
Figure 4: National 511 Deployment and Usage Trends
System Management and Operations
In addition to providing real-time traveler information to customers, transportation agencies can leverage the information stemming from real-time applications to improve their own internal operations, including management of their own fleets and infrastructure. For example, information can be used to monitor conditions, increase the accuracy of transit schedules, or improve the utilization at a parking facility. Additional systems management uses for real-time information include:
- Traffic management centers utilize sensors, cameras, and incident responders to provide the operators with information to manage traffic. Freeway management is more prevalent than arterial management due to the greater availability of information for major highways.
- In addition to real-time traveler information, many transit agencies use AVL for improvements in vehicle fleet management and operations. Even if it is not disseminated to users, tracking schedule adherence can indicate whether vehicles are behind or ahead of schedule, to allow for improved spacing that avoids platoons of clustered vehicles.
- Commercial vehicle operators, particularly larger carriers, use real-time applications to improve their operations, including improved routing, scheduling, and driver efficiency. Instruments on the truck can also serve to diagnose the vehicle’s en-route operating efficiency, including fuel efficiency, mechanical specifications, and software updates.
- Once data is obtained from parking sensors, it is possible to build information models on arrivals, departures, occupancy, duration, and availability, as well as information reflecting demand. Networked meters can deliver information regarding current operational and payment conditions and historical transactions, which can be used to produce a complete real-time and historical view of compliance, violations, actual versus potential revenue, and options for improving pricing and policy.
Performance Measurement
The same data that is used to generate real-time network conditions information is also used to monitor and measure system performance and trends over time. An effective performance measure and reporting program requires a robust data archive. To effectively support evaluations and performance monitoring, archived data generally needs to be of a higher quality than real-time data to be useful for all of its possible applications such as transportation planning and performance monitoring.
Near-Term Influences on the Real-Time Data Marketplace
Several key events and factors are envisioned to influence the collection, delivery, and partnership strategies within the real-time data marketplace over the next 5 to 10 years. This section summarizes some of the major trends and influences.
Real-Time Data Collection
Shift toward More Ubiquitous Data via Probe-Based Technologies
Probe-based sensors provide much broader coverage than can be achieved through traditional DOT/agency-owned infrastructure-based/stationary sensor deployments. Data from probes is currently limited to speed and flow, which works well to support many traveler information applications such as travel times and speed maps. The challenge is that other operations and planning functions that also rely on occupancy and volume data cannot utilize the probe data in the same way they could with the traditional fixed-sensor data.
Real-Time Data Generated from Consumer Devices and Applications
Several private sector providers use this model, known as “crowd sourcing,” to bolster other fleet/probe data and increase the amount of data points for real-time speed and flow information for freeways as well as arterials. Some approaches rely on an “opt-out” model; if users allow GPS with “my location” features enabled, they will be providing anonymous location data. Crowd sourcing is not a new phenomenon with GPS, but applying user-generated location data to develop a consolidated picture of traffic conditions in real time opens enhanced potential for broadly expanding current data collection capabilities. Unlike onboard systems, mobile devices go with the user, and it can be difficult to validate data points on arterials (for example, bikes versus automobiles on a congested arterial roadway), although firms such as Google and NAVTEQ are already providing arterial speed information on a limited number of routes in some cities. One of the Safe and Efficient Travel through Innovation and Partnerships (SafeTrip-21) projects in the San Francisco Bay area is using this user-provided content as a data source.
Expansion of AVL Capabilities to Support Transit Operations and Traveler Information
Vendors are developing more efficient AVL systems and communications infrastructure. This includes AVL with more frequent vehicle position updates and improved accuracy and/or reliability. Vendors are working with transit agencies to bring such new systems online, often as part of periodic technology refreshes, and ensuring compatibility with existing systems. The proliferation of high-bandwidth wireless networks including WiMAX and 4G cellular networks will provide additional real-time information opportunities. Furthermore, the number of transit agencies that have deployed AVL systems has nearly doubled over the last 10 years. Agencies are leveraging AVL to both improve system management and performance as well as provide their customers with real-time transit information.
Improved Sensors That Enable Real-Time Parking Information
Parking sensor vendors are developing more accurate and affordable infrastructure-based sensor technologies. Sensors are rapidly becoming cheaper, smaller, and more ubiquitous, allowing more systems to use the more granular vehicle presence detection method and increasing overall accuracy. In particular, vendors are close to developing sensors appropriate for usage in commercial vehicle parking facilities, allowing expansion into this additional market where the variable sizes of commercial vehicles have previously limited deployment.
Demand for Real-Time Data
Providing Travelers with Situational Awareness Information, Not Just Corridor or Route-Specific Information
Situational awareness is expected to encompass multi-modal information, not just corridor or route conditions. As more travelers become reliant on dynamic content delivered through mobile devices, real-time information will need to support a range of decisions for the traveler, including current route conditions, options for changing routes, modal options if they decide to change their trip or route, destination information (such as available parking or wait times). Expanding this concept to focus on freight-specific situational awareness would need to factor in multi-state corridors, ports, and intermodal facilities, as well as private-sector services (such as truck stops). The data and integration needs to support situational awareness information could be significant.
Substantial Growth in Subscribers to Real-Time Traffic Services
A recent article based on an electronics/automotive industry research study (iSuppli, July 2009) predicts the number of subscribers to real-time traffic services will double in 2009 (4.6 million in 2008 to 8.1 million in 2009), and is expected to reach over 50 million by 2014. The global trend is envisioned to be similar, with a prediction of 184.9 million in 2014. This prediction translates to a projected $1.28 billion industry in the United States by 2014. Real-time services include both portable and fixed devices as well as mobile phones. This indicates continued market demand for vertical supply chain partnerships among data and content providers, as well as enabling applications for vehicle-based and mobile communications devices.
Competitive Private-Sector Market
The private-sector market competition influences real-time information capabilities in nearly all modes. There are already competitive influences in the probe data marketplace for highway-based segment speed data. The commercial vehicle industry, already fairly mature in its deployment of in-vehicle telematics applications, is projected to increase in terms of proliferating onboard communications devices. Initially, only the large long-haul operators were able to fund the substantial capital costs associated with implementing on-board systems, but with the addition of new vendors to the market, as well as the improvements to wireless communications, costs have decreased. Smaller and short-haul companies are able to migrate from radio-based communications systems to public carrier push-to-talk services and in-vehicle telematics that include integrated AVL and data applications. Furthermore, more trucking companies are using telematics systems for proscribed routing and geofencing for their vehicles to track and monitor shipments, particularly for high-value and hazardous materials cargo.
Expected Implementation of Real-Time System Management Information Program
The parameters of this program include traffic and travel condition information for all interstate highways, which includes incidents as well as construction and weather advisories. Urban areas (metropolitan statistical areas with over 1 million in population) will have stricter requirements (for latency), as well as a requirement for provision of travel times on interstate and non-interstate highways, which will require real-time speed data in order for agencies to meet these requirements. For those urban area freeways not already instrumented with public-agency-operated detection systems, agencies will need to seek alternatives to obtain this data, such as through private-sector initiatives. It will also serve as an impetus for improved information sharing between public safety and transportation management agencies about incidents, particularly for non-urban area corridors.
Development of Integrated Multimodal Information
As users of real-time information do not segment their journey by mode, they therefore need integrated information across various modes. State DOTs are partnering with transit agencies and other local transportation agencies to integrate real-time traveler information. Likewise, some transit agencies operating within a single metro area are working to provide seamless real-time interfaces. For example, an integrated system would permit a suburban user to drive to a transit station, park his car, and ride light rail downtown, while receiving real-time traveler information updates throughout the journey.
Delivery of Real-Time Traveler Information
Social Networking and User-Generated Content for Traveler Information
Online applications like Facebook, Really Simple Syndication (RSS) feeds, and Twitter can share information related to congestion, incidents, and construction and are especially popular with younger users. Several state DOTs, regional transportation agencies, and transit operators use Twitter to provide alerts of incidents, delays, or service enhancements. One of the challenges with Twitter and other social networking sites is that they are open to allow users to also post content, so agencies have very little control over user-generated content. Agencies should be aware of the potential legal issues that surround their use, including restrictions regarding a municipal organization being part of a public forum. Twitter and Facebook represent current tools, but social networking is a rapidly evolving market. Their impact on traveler information needs further research to determine the risks and viability of social networking as an information delivery strategy.
Safety Concerns with Mobile Devices
As the methods and means to obtain and share real-time information via mobile applications increases, so do the safety concerns about distracting users. Many states and regions are implementing legislations that ban texting while driving. An important question many transportation agencies face as they make increased use of mobile-focused tools such as Twitter or enhanced mobile Web applications is whether they are actually encouraging the use of these devices by travelers while en route, thereby promoting unsafe driving. There needs to be a concerted outreach effort to promote the safe use of mobile delivery systems, as well as increased focus on developing applications and systems that do not cause distraction while travelers are obtaining and processing information.
Data Gaps Influencing the Real-Time Data Market
Traffic Data Coverage Gaps
-
Only 39 percent of urban freeway miles have sensor coverage to supply real-time traffic flow data, and even the largest cities fall significantly short of full freeway coverage.
-
Flow and incident data for rural highways and arterials remains a significant gap in achieving “all roads” coverage for real-time information.
-
Route-specific weather also poses an information gap. There is a significant disparity in RWIS coverage between states, even in states with mature RWIS programs. There are wide swatches of area in adverse weather areas with no RWIS sensors.
-
Statewide reporting systems that have been established for interstate and highway corridor events do not readily handle arterial/local road information without substantial modifications.
-
There is a gap in reporting on public-sector data coverage and concise and consistent reporting on private-sector coverage as well. The ITS Deployment Statistics database has gaps in its reporting due to a lack of survey response from different agencies, and it does not include any reports from private-sector data entities.
Transit Data Coverage Gaps
-
Approximately 62 percent of transit vehicles are not equipped with the AVL systems necessary to provide real-time vehicle location information. Some agencies that have deployed AVL on a substantial portion of their transit fleet to support operations have yet to leverage AVL information to provide real-time traveler information.
-
There is a lack of system coverage at the regional level, including providing consolidated real-time information from multiple transit agencies operating within a single region.
-
Communications infrastructure is often insufficient to provide real-time information, including networks that are unable to support the amount of data sent by large fleets.
-
Within transit agencies that operate a variety of types of transit vehicles (light rail, bus, ferry, etc.), there is a lack of integration of real-time information across various vehicle types, preventing customers from receiving end-to-end trip information.
Parking Data Coverage Gaps
-
Currently, the parking industry is fragmented in both its operation and sharing of information, especially between public and private operators. There is a substantial gap in the mapping of parking spaces and parking information across metropolitan areas and regions.
-
The deployment of real-time parking information systems has been relatively sparse. While it is only practical to deploy in parking facilities frequently at or near capacity, such as transit station park-and-rides, airports, and central business and entertainment districts, many congested areas lack any parking information.
-
Due to the variability of their size and shape, current sensor technology does not allow for monitoring the presence of commercial vehicles. While real-time parking information could improve safety by alerting commercial drivers of available parking at rest areas, a useable system has yet to be deployed.
Freight Coverage Gaps
-
Cost remains a significant factor in freight operators adopting new technology; for cost reasons, devices and communications (beyond traditional radio communications) may remain out of the reach of carriers and industry sectors operating on thin margins, including drayage operators in ports and intermodal facilities.
-
Few agencies have implemented freight-specific add-ons to their 511 and agency-operated traveler information systems. Most freight-specific systems are third-party provided, which may mean subscriptions or additional equipment is needed for truckers to obtain information.
Gaps in Data Quality
-
To promote seamless sharing of information and integration of dynamic multimodal data into traveler information systems, there is a need to develop and promulgate standards for both the public and the private sectors. These include content, naming conventions, mapping, attribute references, incident reporting, and data structures among others. Parking is one area in particular that lacks well-defined and adopted standards.
-
Even within a single mode (such as transit), there are potentially many inconsistencies in how information is reported or in the data structures. This limits the ability to consolidate information from multiple sources, such as transit operators within a region, between states for contiguous corridor information, or among different parking facilities. This is further complicated when proprietary information is involved, such as for freight.
-
Probe-based data as an option for arterials is still emerging, due to the challenges with validating data points off of the well-defined freeway network. This data collection approach continues to evolve rapidly.
-
Processes to validate purchased traffic flow and speed data have been enacted by a few public agencies with private-sector data contracts, but there is not yet consensus on the appropriate validation methods.
-
The impact of data latency on real-time information is an issue. Improved polling rates for AVL and probe vehicles (commonly now every 3 to 5 minutes) would greatly improve the quality of data for real-time information systems. Polling frequency for freeway sensor networks also varies. There is an inherent latency from the time information is transmitted to an operations/dispatch center to when it can be verified and distributed.
-
The ability of state DOTs and regional transportation agencies to maintain effective data collection systems is directly linked to resources. Maintenance of sensor networks (including preventive maintenance) might not be as high of a priority as other funding demands within an organization. Similarly, reporting systems that rely on staff to enter data and update information require that staff resources have time, access to the database, and access to the information. This impacts the accuracy of non-real-time data such as work zones or planned events.
Gaps in Promoting Increased Usage of Real-Time Data
-
Similar to the data integration gap identified above, there is also a critical gap in the usage of data among and between different departments and agencies. Data sources (such as AVL or sensors) might be deployed with a primary purpose to support operations. While there has been good progress in utilizing that data to support real-time traveler information, there is not yet widespread leveraging of real-time information to support mode shift, planning, evaluations, performance monitoring, or policy development.
-
There is also an opportunity to use real-time data to better understand how travelers use, interact, and seek out information sources to support more informed trip planning and decision making. A better understanding of the needs of different users and how travelers use information will lead to improved ways of collecting and providing information to them, as well as elevating the priority of utilizing real-time information to affect driver behavior.
Cost to Fill Gaps and Address Real-Time Data Needs
The deployment of real-time traveler information systems throughout the country provides the opportunity for millions of travelers to make informed decisions about their routes and schedules. But, needless to say, this deployment comes at a cost. While costs for traveler information systems are not easily isolated because much of the detection infrastructure is deployed to support other operations programs, this section seeks to provide several example capital and operating cost estimates for various field technologies, communications, and central systems that could be used as a starting point in the planning stages of real-time traveler information systems deployment.
Traffic
Cost data is readily available for dissemination technologies and systems, such as 511. Costs for private sector probe-based data will evolve with this relatively young market. Currently, there are limited data points for cost information or comparison. For now, the best available cost data is from the I-95 Corridor Coalition, which published its contractual initial and recurring costs.
Table 5 presents a general, high-level cost estimate for deployment of the RTSMIP previously described in Table 3), including central system costs/upgrades, interfaces for incident/closure systems, road weather information, and provision of travel times. The assumptions used to arrive at these estimates follow the table.
| Subsystem | Cost Per Unit | Number of Units | Initial Costs | Recurring Costs (Annual) |
|---|---|---|---|---|
| Central System | ||||
| Advanced Traffic Management System (ATMS) Upgrades— new systems |
$3 million per system | 10 systems | $30 million | (5%) $1.5 million |
| ATMS Upgrades—Integration of new devices | $200,000 per system | 40 systems | $8 million | (5%) $0.4 million |
| Subtotal (Central System) | $38 million | $1.9 million/year | ||
| Traffic Incident and Construction Lane Closure Information | ||||
| Database Operator | $150,000 per year per state |
50 states | $7.5 million | $7.5 million |
| Subtotal (Lane Closure Management) | $7.5 million | $7.5 million/year | ||
| Roadway Weather Observation Updates | ||||
| RWIS Coverage in 61 Metropolitan Areas | (See Weather in the Infostructure) | 61 metro areas | $38.8 million | (5%) $1.9 million |
| RWIS Coverage in Non-Metro Areas | $38,000 per RWIS sensor | 360 sensors | $13.7 million | (5%) $0.7 million |
| Subtotal (Road Weather Information) | $52.5 million | $2.6 million/year | ||
| Travel Time Along Highway Segments | ||||
| Urban Area Detection | $8,000 per sensor | 3,450 sensors | $27.6 million | (5%) $1.4 million |
| Metro Area Mileage without Detection* | $900/$750 per centerline mile | 10,800 miles | $9.7 million | $8.1 million** |
| Subtotal (Travel Times) | $37.3 million | $9.5 million/year | ||
| NATIONWIDE SYSTEM TOTAL | $135.3 million | $21.1 million/year | ||
Notes:
*Probe-based method of data collection was assumed for the non-metro roadways; $900/mile/yr includes first year startup costs.
**Recurring costs for probe data are assumed to be $750/mile/yr according the to the I-95 Corridor Coalition contract.
Assumptions
Central System
- It is assumed that each state would require a central Advanced Traffic Management System (ATMS) for the consolidation of data and that each state has one major system to consider, although that is clearly not always the case.
- If systems last approximately 10 years, it may be assumed that five states would need to upgrade their systems in any given year. If five additional systems would need upgrading ahead of schedule to accommodate new major deployment, 10 states would need to completely upgrade their ATMS software platforms. The cost of a full replacement is assumed to be approximately $3 million.
- It is assumed that the remaining 40 states have a system in place that can accommodate significant expansion of devices. It is assumed the integration cost for these systems would average $200,000 each.
- It is assumed that all other costs such as system maintenance and operators are already reflected in existing systems and are not additional costs.
Incident Information
- It is assumed that incidents can be collected from existing sources but that additional database management staff would be needed to maintain the system.
- It is assumed that maintenance of construction information would be handled by the same database management staff as for incidents, or that these two roles together would equate to one full-time equivalent staff person.
Roadway Weather
- It is assumed that the existing roadway weather data provided by public and private entities would need to be supplemented with a nationwide deployment of RWIS stations. Cost estimates were developed using the Federal Highway Administration’s (FHWA’s) Weather in the Infostructure.
- It is assumed that the metropolitan area needs would be addressed by the cost estimate provided in FHWA’s Weather in the Infostructure (based on composite scoring and road miles), but with 2003 costs escalated to current estimates.
- It is assumed that 10 percent of the non-metro roadway miles have RWIS sensors deployed requiring coverage on the remaining 90 percent of non-metro mileage, which would require RWIS sensors at an average of one per every 100 miles.
Travel Times
- It is assumed that existing sensor deployments would be maintained up to one per mile but not expanded geographically.
- It is assumed that all future geographic expansion of real-time travel time data would come from probe-based data sources. The total mileage to be covered by future expansion is equal to 10,800 centerline miles, which is 61 percent of the freeway mileage in the 50 largest metropolitan areas, given the remaining 39 percent are covered as per deployment tracking statistics.
- It is assumed that 50 percent of all existing sensors need to be replaced, but that replacement costs include the sensor, planning and installation costs only, not infrastructure that would be existing such as pole, cabinet, communications, etc. The total number of sensors to be replaced is 3,450, which is half of the current deployment total.
Transit
The public sector has captured some information regarding the costs of deploying real-time traveler information to transit systems, although detailed information is not always available. The following section estimates the costs associated with deploying full real-time information to the 94 transit agencies that responded to the 2007 RITA ITS Deployment Survey. Table 6 shows the estimated total capital costs to deploy AVL and real-time information to the 31,664 buses and 26,512 other vehicles currently unable to display real-time information to travelers. The table shows a simple calculation of the number of vehicles multiplied by the assumed AVL deployment cost of approximately $8,000/vehicle and an incremental cost of real-time information application deployment cost of approximately $4,000/vehicle, based on the RITA Benefits, Costs, Deployment, and Lessons Learned: 2008 Update. The total costs also include the capital cost for transit real-time information signage, which is estimated at $18 million for 3,000 signs. (A cost per sign of $6,000 is assumed, with one sign deployed for every 20 transit vehicles and approximately 60,000 total transit vehicles).
Source: RITA Benefits, Costs, Deployment, and Lessons Learned: 2008 Update
Table 7 estimates the average annual operating costs associated with real-time information for transit, including the software and communications costs associated with deployment. Assumptions are based on values found in the FHWA Benefits, Costs, Deployment, and Lessons Learned: 2005 Update.
Source: FHWA Benefits, Costs, Deployment, and Lessons Learned: 2005 Update
Parking
Assessing the cost to fill the gaps of real-time parking information is complicated by the limited number of deployments currently in existence and the inability to assess the total number of spaces that would benefit from real-time information. Unlike other modes, where complete coverage would be beneficial to travelers, many parking facilities are never full, meaning that real-time information is unnecessary. Of the systems that have been implemented, costs vary greatly depending on the granularity of information being provided. Systems that measure only the total number of available spaces in a facility typically cost several hundred-thousand dollars. Similarly sized systems that identify individual open parking spaces often cost several million dollars. Table 8 estimates typical per-space costs for these various types of systems.
| Parking System | Costs |
|
|---|---|---|
Capital |
Annual Operations and Maintenance |
|
| Entry/exit | $40 | $2 |
| Space-by-space | $600 | $30 |
Freight
The ability to estimate the costs of public-sector freight information systems is also limited by the number of systems that have been deployed and the difficultly in isolating real-time information costs. Systems that provide freight-specific information to existing 511 systems can be developed for as little as $10,000, such as the Washington State DOT system that aggregates freight relevant information from the DOT’s existing system and disseminates it to commercial vehicle companies via email. Deploying real-time freight information to ports and intermodal facilities can cost several million or more. Private-sector systems can be calculated on a per-vehicle basis. Entire after-market telematics packages can now be installed and maintained for approximately $500 to $2,000 per truck per year.
Roles for the US DOT
The US DOT plays a crucial role in coordinating the efforts of the state and local government and private-sector partners. Based on the research conducted for this report, the following conclusions represent actions that will further the development of real-time information systems to continue to improve transportation safety, security, and efficiency.
Standards
Develop National Standards on Real-Time Information
Every state/region is doing something different with 511 and other real-time information applications, although a majority of them follow the same concepts. The US DOT/FHWA has an opportunity to develop national standards for 511 implementation beyond what is currently provided in the 511 Implementation Guidelines. This would support the interoperability of systems and seamless transition for the traveler between system areas.
Help to Improve Data Quality and Define Quality Standards
Public agencies are interested in support from the government to better ensure data quality. This support can be in the form of white papers, proof of concept, research, or analysis of existing systems. Quality standards can be developed on the national level to ensure that the amount of infrastructure-based data collection devices or probes would satisfy a basic level of quality for the dissemination of that data to the public. Linking the quality of data with the revenue provided to collect that data would help increase the standard for quality.
Help to Improve Data Exchange Standards
The US DOT could and should do more in the arena of real-time data exchange and traveler information standards. To date, many standards are not as widely used as they should be, and this hinders the ability to widely share and use information, which improves data quality. The US DOT should make standards freely available, push for key existing standards to be completed to eliminate ambiguities, provide a more open forum for sharing lessons learned as well as a more open process for standards development, and provide clear test procedures or validation processes so that accurate implementations of the standards can be confirmed.
Standardize Approaches to Collect and Share Information with the Public
There are gaps in information gathering and dissemination that could be mitigated if there were a standard methodology applied to:
-
Construction data – Real-time data collection for actual lane closures, delays, and other impacts to traffic from the construction activities can be shared with the traffic management agencies to disseminate more accurate information to the traveler.
-
Communications protocol for sharing data – The methods for collecting, storing, and sharing data can be in multiple forms/protocols, which makes sharing information with new agencies and new users a challenge to overcome. The information that is important to active traffic management and traveler information can be standardized on a national level to be able to share data more easily and potentially provide interoperability between local or state systems.
-
Sharing additional information with third-party companies to disseminate to the traveler – This would include dynamic information on managed lanes or pricing information as an example of information that the consumer would benefit in knowing prior to entering the managed lane.
-
Attribute information – When choosing a parking space, customers benefit from increased knowledge of facility attributes including hours of operations, security features, entry/exit, and cost.
Resources
Understand the Implications of Section 1201 of the Safe, Accountable, Flexible, Efficient Transportation Equity Act: A Legacy for Users (SAFETEA-LU)
The private sector is supportive of these real-time requirements, but the public sector has some reservations for the federal requirements due to funding and resource implications.
Fund ITS Programs
States and local agencies continue to need funding support to implement ITS to collect data on roads, fleets, and parking facilities, and for more than just traveler information purposes. If the direction of the market remains that the public sector deploys detection devices to collect public data, then funding will continue to be required for maintaining and enhancing programs.
Improve the ITS Deployment Tracking Database
Although it remains the best source of information available on the national level, the ITS Deployment Tracking Database has notable gaps. The uniformity (lack of) of survey results is an issue. Ensuring the survey gets to the right people who have access to the right information is crucial. This is particularly true for arterial information. It is recommended that efforts be focused on maintaining contacts within key agencies who can provide the needed information. Further, data can be obtained from other sources. Vendors are knowledgeable of where their systems are deployed and what their capabilities are. In particular, there are far fewer signal system vendors than there are signal systems. Gathering information from these firms could garner a good return for the effort.
Research and Development
Research and Evaluate the Benefits of Investing in Data
Define the benefits of investing in real-time data. While there are numerous agencies and areas in the country that are educated on the opportunities for collecting data in the market today, there are some areas that are not yet thinking about how they can use that data.
Facilitate the Development of Technologies and Applications
Supporting the development of technologies through funding and partnerships with the private sector, such as is occurring with IntelliDriveSM, SafeTrip-21, and Mobile Millennium in California, allows the government to show support and new use of innovations and allows the private sector to implement the value-added applications. Emerging market segments like parking and freight are further behind in the development of effective and affordable technologies. Helping agencies to understand what innovations are available and testing those innovations to determine benefits and justifications for widespread use would benefit agencies looking for new opportunities in providing good quality data to their customers.
Encourage the Development of Additional Communication Methods
Funding for research in the areas of digital short-range communication (DSRC), WiFi, WiMAX, and other open-air communication networks for obtaining real-time data also can support the development of real-time information across all modes.
Conduct Research to Improve Understanding of Real-Time Information Usage
Additional understanding of how travelers use real-time information is needed, including how the information they receive affects the decisions they make. This is especially crucial in developing market segments like transit, parking, and freight. This information can be used to focus outreach efforts, broaden the usage of information, and promote market sustainability.
Partnerships
Encourage Partnerships
Partnerships that utilize interagency deployments and coordination should be promoted. The relationships should focus on multi-modal regional real-time information and involve coordination between agencies and the private sector. Such partnerships can include the modal integration of real-time information for interagency coordination to consolidate data between state DOTs (traffic) and transit agencies (transit). In addition to public sector partnerships, commercial vehicles need to be an active partner in the development of real-time freight information, including through incentives that encourage participation.
Provide a Qualified Vendor List and Qualified Methods List for Public Agencies to Receive Data
Work to provide a qualified vendor list for providing data and possibly partner with ITS America to develop this. Recommended data collection methods for public agencies to consider implementing would be beneficial for local agencies.
Encourage the Public Agencies to Leverage the Private Sector Strides in Data Collection Techniques and Technologies
The private-sector data is broader in geographic scope than what the public-sector-operated systems can collect. The private-sector competition will keep prices reasonable, which may be able to demonstrate that they are equivalent or lower than the cost for public agencies to deploy data collection devices and provide traveler information services such as 511. There needs to be a bigger market and more demand from customers in order to make prices competitive.
Negotiate Data Collection Activities at a National Level
The US DOT/FHWA should explore the idea of negotiating with the private sector on a national level (perhaps similar to the General Services Administration [GSA] Schedule) that would provide data on a local or state level. This could not only provide a standardized method for distributing the data to public agencies, but could also support the reliability of that data due to the larger-scale application.