 |
Data Mining and Gap Analysis for Weather Responsive Traffic Management Studies
3.0 Weather and Traffic Dataset Analysis
This section focuses on traffic and weather-related datasets that could be used to better understand the relationship between traffic flow and weather. These datasets fall into two primary categories.
Research datasets that are generated under controlled, experimental conditions – While these datasets may not provide a precise replication of “real-world” conditions, they provide precise measurement of specific hypotheses. These research efforts are generally documented through professional journals and conference presentations so most have been discussed and prioritized in the earlier memorandum [31]. A summary of datasets identified during the project is presented in this memorandum.
Real-time traffic and weather data – Traffic volume and speed data from ITS systems along with increased deployment of both private and public weather observation stations, is providing improved opportunity to assess the impact of weather on real-time traffic flow. In a 2006 FHWA study [32], weather and traffic data from three cities were collected and used to estimate weather-related adjustment factors that could apply in simulation models. Datasets from Baltimore, Minneapolis‑St. Paul, and Seattle were utilized in this effort. Traffic speed and volume data were obtained from local ITS system detectors while weather data were obtained from National Weather Service Automated Surface Observation Systems (ASOS) at local airports. One of the major challenges of this effort was the limited geographic scope of available weather data and the limited capabilities of many available weather stations. For example, many of the road weather stations operated by state transportation departments do not measure precipitation intensity; making it difficult to assess the impact of rain or snow on traffic volumes. Since ASOS stations were generally limited to major airports distances between traffic and weather observation points were often significant, and not adequate to capture local variations in precipitation levels.
A study conducted by CS and VTTI for FHWA in 2006 to 2008 [33] involved collection of weather and traffic data from three cities (Baltimore, Minneapolis‑St. Paul, and Seattle). One of the activities required to meet the objectives of this project was to assess whether increased deployment of ITS systems and weather stations over the past three years would provide improved datasets for evaluating the impact of weather on traffic flow. After an initial screening process, which is documented below, three cities were recommended for further evaluation in this report; Atlanta, Salt Lake City, and Minneapolis‑St. Paul. Further discussion of available weather and traffic sets is included in this section.
3.1 Summary of Dataset Criteria
The literature search and data review revealed a good variety of recent studies that have used empirical data to assess the impact of adverse weather on traffic flow and safety. A number of these studies, mostly in the international arena, have produced datasets of potential interest to the research goals and objectives of the WRTM program. Characteristics of desired datasets include:
- Availability of detailed traffic flow data at 15-minute intervals or less, preferably five minutes, with speed and traffic volume data by lane.
- Availability of detailed weather station data within close proximity to the traffic count stations, including precipitation intensity. Data on visibility level also are desirable.
- Data accessible in a standard database format with documented quality control procedures.
- Data includes a variety of weather conditions, including dry, rain, snow, and ice.
- Pavement condition data available.
- Similar criteria are applied in this section to datasets generated by ITS and weather data sources.
3.2 Datasets Identified From Literature Search
The literature search identified several research datasets that are of interest to the project. All of the new recent datasets identified were from non‑U.S. sites. One concern was to identify any factors that might make the results less valid for modeling the behavior of U.S. drivers. It should be noted, however, that there is great variation in driving behavior within the United States; particularly between cold and warm weather locations, and between large urban, small urban and rural locations. Comparison of the data collected from domestic Traffic Management Centers and weather stations helped to provide a benchmark. Table 2.3 listed the preferred datasets identified through the literature search, review of papers from the 2010 TRB Annual Meeting and discussions with researchers.
Only two of the above datasets listed in Table 2.3 were available for review, the study conducted by the University of Valencia in Spain [1] and the Hokkaido study [2]. Others could not be obtained due to either confidentiality agreements or lack of response to requests by the researchers. The Hokkaido study was used for a microscopic analysis of driver behavior, documented in the report, “Microscopic Analysis of Traffic Flow in Inclement Weather: Impact of Icy Roadway Conditions on Driver Car-Following Behavior,” prepared for FHWA by Virginia Tech Transportation Institute and Cambridge Systematics, February 2010 [34].
The data from the Valencia study were analyzed as part of this project. In this study, 15 locations from two Northwestern freeways in Spain have been studied in order to analyze the influence of adverse weather into traffic conditions. Weather stations and traffic stations were used to collect data between January 2006 and November 2008. Traffic stations collected data in a one-hour-based period, while weather stations collected data in a 15-minute period. In order to not lose precision, traffic intervals were split into four similar 15-minute intervals. Seven of those locations were from the A-6 10 freeway, covering 94.3 km; while eight stations belonged to the A-52 freeway, covering 57.4 km.
Both freeways are located in the Northern Spain, influenced by the Atlantic Climate. This region is the most cloudiest and wettest of Spain, with annual rainfall between 800 and 1,500 mm. Average temperatures are 9 ºC in winter and 18 ºC in summer.
Each one of the traffic stations was separated by an average distance of less than 100 m from its corresponding weather station. Thus, it can be considered that the weather conditions registered in the weather stations were the same than the registered on the road. Traffic data was registered in one-hour intervals, while meteorological data was registered in a 15-minute interval. In order to analyze and correlate traffic weather data, traffic data was split into 15-minute aggregation periods. While there were major limitations in the data, largely due to the rural location of the study area, regression models did show that rainy conditions resulted in speed reductions from 5.5 km/h to 7.0 km/h, depending on its intensity. Speed reduction due to snow varied from 9.0 to 13.7 km/h. A more detailed description of this dataset and the analysis conducted is included in this report as Appendix D.
3.3 Additional Datasets Identified Through Research
Additional research-oriented datasets were identified from domestic research programs. Two of them, the SHRP 2 Project L03 and the California PATH Nonrecurrent Congestion Study were identified as important studies, along with others, but most have not yet producing enough information to be helpful in analyzing weather impacts on traffic flow. These studies are summarized in Table 3.1 and it is recommended that these datasets be tracked in the future for the possibility of additional analysis.
Table 3.1 Additional
Datasets Identified through Research
Organization |
Research Program |
Description |
Strategic Highway Research Program/National Cooperative Highway Research Program (SHRP/NCHRP) [35] |
SHRP 2 Project L03: Analytic Procedures for Determining the Impacts of Reliability Mitigation Strategies, Cambridge Systematics, Inc. 2009 |
The weather data for SHRP 2 L03 project was obtained from the National Climatic Data Center (NCDC) of the National Oceanic and Atmospheric Administration (NOAA). The hourly Local Climatological Data from NCDC for Atlanta, Houston, Minneapolis/St. Paul, San Diego, Los Angeles, San Francisco, and Seattle. The basic weather elements in the hourly data files are:
- Sky condition – Cloud
height and amount (clear, scattered,
broken, overcast) up to 12,000 feet;
- The weather data for SHRP 2 L03
project was Visibility (to at least
10 statute miles);
- Basic present weather information – Type and
intensity for rain, snow, and freezing
rain;
- Obstructions to vision – Fog,
haze;
- Pressure – Sea-level
pressure, altimeter setting;
- Ambient temperature, dew point temperature;
- Wind – Direction, speed,
and character (gusts, squalls); and
- Precipitation accumulation; and
selected significant remarks, including
variable visibility, precipitation
beginning/ending times, rapid pressure
changes, pressure change tendency,
wind shift, and peak wind.
These weather characteristics have been summarized into the following annual totals that would be used in statistically models for travel reliability analysis.
- Number of hours with precipitation
amounts greater than or equal to:
0.01 inches, 0.05 inches, 0.10 inches,
0.25 inches, and 0.50 inches.
- Number of hours with measurable
snow.
- Number of hours with frozen precipitation.
- Number of hours with fog present.
|
Strategic Highway Research Program/National Cooperative Highway Research Program (SHRP/NCHRP) [35]
(continued) |
SHRP 2 Project L03: Analytic Procedures for Determining the Impacts of Reliability Mitigation Strategies, Cambridge Systematics, Inc. 2009
(continued) |
The SHRP 2 Project L03 dataset also includes traffic volume and speed data for roadway segments in a variety of cities. Additional data was collected on incident type, frequency, and duration. Where available, freeway service patrol logs were used to help confirm incident impacts and durations.
The primary purpose of this project was to evaluate travel time reliability mitigation strategies. Reliability is generally measured over long periods of time.
Status – This dataset was used in the gap analysis for Salt Lake City that is documented later in this section. The analysis shows that it can help to supplement some of the data collected from ITS and weather systems, including Clarus. However, the fact that it is hourly limits its usefulness. |
University of Michigan Transportation Research Institute (UMTRI)[36] |
Integrated Vehicle-Based Safety Systems Project |
UMTRI is engaged with the Weather Systems and Assessment Program, Research Applications Laboratory of the National Center for Atmospheric Research (NCAR) in Boulder, Colorado and plans to post process radar data that is obtained from the National Climatic Data Center with the assistance of NCAR. NCAR processes code that will allow UMTRI to calculate active precipitation from the radar data using GPS time and location information recorded on‑board the vehicles. This data can be then used in conjunction with windshield wiper state from the vehicle data to determine any potential influence that active precipitation has on driver behavior, particularly whether drivers respond to warnings provided in the vehicle, and if they respond, how quickly.
Status – This is a promising dataset but was not far enough advanced to meet the schedule for this project. An initial report on the heavy truck portion of the project was issued in August 2010. A presentation of the general results was held in October 2010. |
University of Michigan Transportation Research Institute (UMTRI)[37] |
IntelliDrive/Vehicle Infrastructure Integration (VII) |
Scientists at the National Center for Atmospheric Research (NCAR) are testing an innovative technological system in the Detroit area that will help protect drivers from being surprised by black ice, fog, and other hazardous weather conditions. The prototype system is designed to gather detailed information about weather and road conditions from moving vehicles. Within about a decade, it should enable motor vehicles equipped with wireless technology to transmit automated updates about local conditions to a central database, which then will relay alerts to other drivers in the area.
Status – This is a promising dataset but is a long-term project and therefore not far enough advanced for this project. |
California PATH [38] |
California Smart Call Box Study |
This FOT replaces a box’s existing controller card with a “smarter” card. After this swap, the boxes provide ITS services, such as performing traffic counts, detecting incidents, monitoring weather conditions, and hosting slow-scan closed circuit television cameras.
Status – This is an older study from the late 1990s. Increase in cell phone penetration has reduced interest in call boxes since that time and this technique for collecting weather and traffic information together has not caught on. |
California PATH [39] |
Finding and Analyzing True Effect of Nonrecurrent Congestion on Mobility and Safety |
This report summarizes empirical research about the causes and impact of nonrecurrent congestion. A method is presented to divide the total congestion delay in a freeway section into six components: the delay caused by incidents, special events, lane closures, and adverse weather, the potential reduction in delay at bottlenecks that ideal ramp metering can achieve, and the remaining delay, due mainly to excess demand.
Status – The results were not available in time for this study but it is recommended for further evaluation when closer to completion since it provides some information on delays related to weather. |
3.4 Data Collection for Gap Analysis
In addition to the research studies discussed in the previous section, this project included collection of data from three U.S. cities. During the FHWA study written by Hranac, et al. in 2006, a number of cities were approached for both traffic and weather data. A number of gaps in the data were identified at that time, including:
- Most of the Environmental Sensor Stations (ESS) owned by DOTs did not report precipitation intensity, making it difficult or impossible to assess the impact of precipitation on traffic flow.
- Many DOT ESS’s had reliability problems, resulting in significant gaps in the data.
As a result of the problems identified with ESS’s, ASOS data from major airports were used in the earlier study. These stations were often located at some distance from traffic detector locations, creating potential time gaps between traffic and weather data.
Reliability problems with traffic detector data were identified in many locations. These can generally be smoothed over when looking at long-term system performance, but a higher level of detail is required when evaluating the impact of weather events on traffic flow.
Desired traffic data reporting frequency for this analysis is 5 minutes, with a 15‑minute maximum. Many detector stations summarize data at lower frequencies such as 30 or 60 minutes.
Ultimately, data was used from Minneapolis‑St. Paul, Seattle, and Baltimore to develop weather-related traffic flow adjustment factors. Although the gaps identified above did exist in the data from these cities, the quality of data overall was acceptable, and the sample of those three cities reflected a good variety of weather conditions. Since this analysis was conducted approximately three years ago, there have been significant advances throughout the United States in the deployment of both traffic detection technologies and ESS. These developments are encouraging in that they can provide more data and higher quality data for use in evaluating impacts of weather on traffic and include:
- Expansion of ITS in many metropolitan areas into high-growth suburban and exurban corridors;
- Replacement of loop detectors with nonintrusive detection systems that are less prone to failure and which can be repaired more rapidly;
- Rapid entry of the private sector into the traffic detection arena, resulting in a significant increase in speed and travel time data;
- Replacement of airport AWOS stations with ASOS technology that provides surface condition data;
- Increase in the number of ESS in many States; and
- Implementation of FHWA’s Clarus system, which provides a standard format and quality control for ESS observations from over 30 states and several Canadian provinces.
The gap analysis documented in this task was designed to help FHWA determine whether these developments have provided greater opportunity to evaluate the impact of adverse weather on traffic with data that is being collected on a regular basis. While this would not eliminate the need for specialized data collection, it may at least reduce that need, as well as enabling researchers to spend more resources on analysis and less on original data collection.
The section below describes the characteristics of traffic and weather data that would help to meet the goals of this project. An initial review of available data sources was conducted in order to recommend three cities for further analysis. This review focused on criteria proposed and documented in Task 2 (Literature Search), including:
- Availability of detailed traffic flow data at 15 minutes intervals or less, preferably five minutes, with speed and traffic volume data by lane;
- Availability of detailed weather station data within close proximity to the traffic count stations, including precipitation intensity;
- Data accessible in a standard database format with documented quality control procedures;
- Data includes a variety of weather conditions, including dry, rain, snow, and ice; and
- Pavement condition data available.
Our initial review of sites, documented below yielded the preliminary recommendation to approach Minneapolis‑St. Paul, Salt Lake City, and Atlanta. A number of cities were identified as back-up if the three original selections did not yield satisfactory datasets.
3.5 Traffic Data
Through the work on FHWA’s Mobility Monitoring Program and other various state DOT projects, traffic data archives have been collected from numerous traffic management centers around the country. These traffic data are collected at ITS vehicle detection stations along major Interstates in more than 10 metropolitan areas. These stations are usually spaced at one-third mile apart.
The types of data collected include traffic volume and speed for each directional traffic lane. While 5-minute is the most common collection interval, 15-minute interval also is used in some cities.
3.6 Weather Data
Three types of data were reviewed for this task. The first is the roadway surface weather data archived by FHWA’s Clarus project, the second is the National Weather Station archives collected at National Climatic Data Center, and the third is private commercial weather archives. The latter represents a promising source in that the number of private weather sources has been increasing rapidly and the quality of the data has been improving. The drawback is that these data must be purchased and compiling large datasets required for analysis of weather impact on traffic could be prohibitively expensive for public agencies.
3.6.1 FHWA Clarus Initiative
The Clarus system, developed and operated by FHWA through its contractor, Mixon‑Hill, collects near real-time atmospheric and pavement observations from various state DOTs’ road weather information systems. Most of the stations report at 20-minute intervals, while some report at 10-minute intervals. The types of climate data collected at each station varies, while in general they include:
- Air Temperature;
- Atmospheric Pressure;
- Dewpoint Temperature;
- Maximum Temperature;
- Minimum Temperature;
- 24-hour precipitation;
- 1-hour precipitation;
- 6-hour precipitation;
- 3-hour precipitation;
- 12-hour precipitation;
- Relative Humidity;
- Subsurface Temperature;
- Subsurface Temperature;
- Surface Temperature;
- Total Radiation;
- Wet Bulb Temperature;
- Average Wind Direction;
- Average Wind Speed; and
- Wind Gust Speed.
Archives since December 2008 can be obtained from http://www.clarus‑system.com.
3.6.2 National Weather Stations
The NWS Automated Surface Observing System (ASOS) stations are located at major airports and recently have been expanding to smaller airports as well. Many ASOS stations have one-minute data archives. One-minute reports are computed from data accumulations over the following time periods prior to the report:
- Cloud Height 30 seconds;
- Visibility 1 minute;
- Photometer 1 minute;
- Present Weather 1 minute;
- Freezing Rain 1 minute;
- Temperature/Dew Point 1 minute;
- Wind 2-minute average;
- Pressure 1 minute;
- Precipitation Accumulation 15 minutes; and
- Lightning 1 minute.
The archives can be obtained from http://www.ncdc.noaa.gov/oa/climate/climatedata.html#asosminutedata.
3.6.3 Commercial Weather Archives
We examined sample weather archives maintained by weatherunderground.com. Their stations are much more densely spaced than NWS’ ASOS stations, so it is easier to find a weather station that is close to freeway traffic detection stations.
Many of these weather stations collect data continuously, and weather data collected include: precipitation rate, daily rain, temperature, dew point, pressure, wind direction, wind speed, humidity, and clouds. Figure 3.1 shows a sampling of Wunderground stations in the Atlanta area.
Figure 3.1
Wunderground Stations in Atlanta Region

3.7 Gap Analysis of Weather and Traffic Data
Based on work conducted for the Mobility Monitoring project, a number of cities were identified that could serve as one of the three sites for the gap analysis. This initial analysis included a mix of warm and cold weather cities. However, given the lack of information on impacts of snow and ice on traffic flow, more emphasis was placed on cold weather cities in later review and additional cities were added to the list. The result of this initial review is documented in Table 3.2.
Table 3.2 Initial
Screening of Cities for Gap Analysis
City |
Traffic Data Granularity |
Numbers of Nearby National Weather Stations |
Atlanta, Georgia |
Lane level, 5-minute |
6 |
Tampa, Florida |
Lane level, 1-minute |
6 |
Orlando, Florida |
Lane level, 1-minute |
4 |
Fort Lauderdale, Florida |
Lane level, 1-minute |
3 |
Miami, Florida |
Lane level, 1-minute |
1 |
Salt Lake City, Utah |
*Data source in transition from DOT to traffic.com
(see update in Table 3.4) |
2 |
Minneapolis-St. Paul, Minnesota |
*No data feed since September 2009
(see update in Table 3.3) |
4 |
Portland, Oregon |
Lane level, 15-minute |
3 |
Detroit, Michigan |
Lane level, 5-minute |
2 |
Seattle, Washington |
Lane level, 5-minute |
5 |
Three cities, Atlanta, Georgia; Salt Lake City, Utah; and Minneapolis‑St Paul, Minnesota were recommended for analysis pending further review of the data. These cities all had a good, reliable set of traffic data with varying levels of weather data. Two of the three cities, Minneapolis‑St. Paul and Salt Lake City, regularly experience winter weather. Table 3.3 shows the selecting criteria for the three cities.
Table 3.3 Data Characteristics
of Recommended Cities

|
Frequency of Data Collection and Temporal Distribution |
City |
Traffic Data |
Weather Data |
Clarus |
ASOS |
Wunderground |
Atlanta, Georgia |
Lane level,
5-minute |
N/A |
15-minute |
Continuous |
Salt Lake City, Utah |
Lane level,
5-minute |
10- to 20-minute |
15-minute |
Continuous |
Minneapolis‑St. Paul, Minnesota |
Lane level,
5-minute |
10- to 20-minute |
15-minute |
Continuous |
Tables 3.4 through 3.6 show the characteristics of traffic and weather data obtained from the three cities. During an early stage of the gap analysis, the availability and reliability of the data was reviewed to make sure that it met criteria.
Table 3.4 Traffic
Detector and Weather Station Geographic Scope and
Density in Recommended Cities

|
Geographic Scope and Density |
City |
Traffic Data |
Weather Data |
Clarus |
ASOS |
Wunderground |
Atlanta, Georgia |
On freeways, stations spaced at one-third miles |
N/A |
3 stations |
11 stations |
Salt Lake City, Utah |
On freeways, stations spaced at one-third miles |
3 stations |
1 stations |
10 stations |
Minneapolis‑St. Paul, Minnesota |
On freeways, stations spaced at one-third miles |
3 stations |
4 stations |
15 stations |
Table 3.5 Traffic
and Weather Data Elements in Recommended Cities

|
Data Elements |
City |
Traffic Data |
Weather Data |
Clarus |
ASOS |
Wunderground |
Atlanta, Georgia |
Volume, speed |
N/A |
Precipitation ID, amount |
Precipitation rate |
Salt Lake City, Utah |
Volume, speed |
Precipitation amount |
Precipitation ID, amount |
Precipitation rate |
Minneapolis‑St. Paul, Minnesota |
Volume, speed |
Precipitation type, amount |
Precipitation ID, amount |
Precipitation rate |
Table 3.6 Cost and
Quality Control Procedures for Traffic and Weather
Data Sources

|
Other Criteria |
Traffic Data |
Weather Data |
Clarus |
ASOS |
Wunderground |
Data availability and cost |
Text files, ready for processing, free. |
Text files at Clarus FTP site, free |
Text files at NCDC FTP site, free |
Text files, $80 per month 10 kilometers area all PWS data from the circle.
Minimum 10 areas. One-year minimum term. |
QC |
All raw data must pass QC procedures listed in the Scope. |
To be determined |
To be determined |
WU uses three separate checks to ensure the quality of PWS data.
First, make sure the data is physically plausible, removing such reports as temperatures colder than Antarctica’s record low and wind speeds greater than those found in tornadoes.
Check to see if the rate of change also is reasonable, this prevents observations from flip-flopping between say 50 and 80 degrees in the span of five minutes (this pattern is attributable to instrument failure).
For temperature, check the temperature against nearby stations to see if it is unusually warm or cool compared to its neighbors. If a station fails any check, they do not display the observation. |
Earlier work conducted under the RWMP program highlighted the possibility that data may not be available due to nonworking field equipment or other factors. As a result, several back-up cities were identified, all of which have significant snowfalls but limited number of ESS surface observations available. The cities and their data sources are listed in Table 3.7.
Table 3.7 Other Potential
Cities for Data Collection Effort
City |
Traffic Data |
Weather Data |
Boston |
Lane level, 5-minute; Volume, speed; On freeways, stations spaced at one-third mile |
Clarus: Available
ASOS and Wunderground: available |
Chicago |
Lane level, 5-minute; Volume, speed; On freeways, stations spaced at one-third mile |
Clarus: Stations appear to be off‑line
ASOS and Wunderground: available |
Detroit |
Lane level, 5-minute; Volume, speed; On freeways, stations spaced at one-third mile |
Clarus: N/A
ASOS and Wunderground: available |
Pittsburgh |
Lane level, 5-minute; Volume, speed; On freeways, stations spaced at one-third mile |
Clarus: N/A
ASOS and Wunderground: available |
Providence |
Lane level, 5-minute; Volume, speed; On freeways, stations spaced at one-third mile |
Clarus: N/A
ASOS and Wunderground: available |
3.8 Tests of Traffic Data and Weather Wunderground Archives
This section documents sample tests of traffic and weather data from Atlanta, Salt Lake City, and Minneapolis‑St. Paul. This provides a prototype methodology for the gap analysis that could be conducted in many major cities with the available weather and traffic data. The primary objectives of these tests were: 1) to determine what type of relationship between weather conditions and traffic data can be discerned from existing data; and 2) recommend methods to fill the gaps that are identified.
3.8.1 Atlanta Data Test
A preliminary test of the methodology was conducted in Atlanta using a Wunderground weather station and a nearby detection station on I‑285. The location of both the Wunderground and the traffic detector station are shown in Figure 3.2.
Figure 3.2
Location of Traffic Detector and Weather Station

The Atlanta test was used to focus on a methodology and used data from Sunday, August 24, 2008. Use of a Sunday for the first test eliminated the impact of the heavy congestion that occurs throughout the Atlanta region during peak periods. The traffic speed data is at five-minute intervals for each traveling lane, and the rain precipitation rate data also is at five-minute intervals.
Figure 3.3 demonstrates the rain’s impact on traffic speed. Two major spikes in rainfall are shown on the graph with rates reaching three inches an hour around 5:00 p.m. and four inches per hour around 8:00 p.m. Traffic was running at 65 to 70 mph right before the first spike but slowed down to 50 mph on the southbound side and 40 mph on the northbound side with the increase in rainfall rate. Although it continued to rain at just over one-half inch per hour after that, speeds recovered to previous levels. During the second spike at 8:00 p.m., speeds slowed down even further to less than 40 mph on the southbound side and under 30 mph on the northbound side. Rainfall continued at around one inch per hour until around midnight and speeds in both directions leveled off during this period at between 50 and 60 mph. It is likely that darkness had some impact on speed as well as the rainfall. This graph indicates that compiling this information over time could provide some functions.
Figure 3.3
Relationship of Rainfall Levels to Traffic
Speeds and Lane Selection

Figure 3.4 shows the rain’s impact on the percentages of vehicles on each lane in the northbound direction. The impact on lane distribution is harder to discern than the impact on speed. During the first spike in rainfall, at 5:00 p.m., there is a clear movement of traffic out of the left lane and the third lane along with a significant increase in the second lane. This pattern continues in part during the next three hours with traffic moving from the third lane to the second lane. This may be an impact of both wet pavement and night fall. During the 8:00 p.m. spike in rainfall it is difficult to discern any significant changes in lane use, although there is an indication of more frequent lane-changing.
Figure 3.4
Impact of Rain on Lane Distribution

3.8.2 Salt Lake City Sample Tests
Test Sites
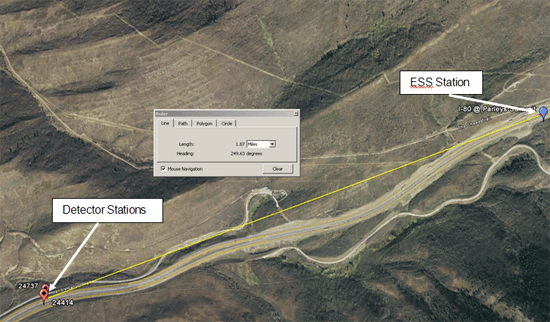
Two sites were tested in the Salt Lake City region, which has an extensive weather station network, including a large number of stations operated by UDOT. The first test site included is located near Salt Lake City International Airport (Figure 3.5) in a heavily developed area, and the second test site is near Parleys Summit (Figure 3.6), mountain pass in a more rural region east of Salt Lake City. These sites represent different environments and roadway alignments and were chosen because of the proximity to weather stations, the completeness of data coverage, and the uniformity of traffic patterns in each site. All the traffic stations in test areas experience limited traffic congestion, even during commute peak hours, which makes it easier to isolate weather’s impacts on traffic. Table 3.8 shows the detailed information for the eight traffic stations selected in the test area.
The nearby National Weather Station KSLC supplied weather data through SHRP2 Reliability Study and the NWS ASOS data archive web site. UDOT has weather stations located on I‑15 at 500 S and on I‑80 at Parleys Summit.
Table 3.8 Salt Lake
City Area Traffic Stations
Location |
STN_ID |
Milepost |
Latitude |
Longitude |
Number of Lanes |
NB I‑215-W at 500 N |
24740 |
23.35 |
40.779952 |
-111.949003 |
3 |
SB I‑215-W at 500 N |
24354 |
23.35 |
40.779955 |
-111.949221 |
3 |
NB I‑215-W at 100 N |
24757 |
22.8 |
40.772052 |
-111.949097 |
3 |
SB I‑215-W at 100 N |
24407 |
22.8 |
40.772047 |
-111.94938 |
3 |
EB I‑80 at Redwood Road |
24787 |
118 |
40.765945 |
-111.936623 |
3 |
WB I‑80 at Redwood Road |
24634 |
118 |
40.76608 |
-111.936595 |
3 |
EB I‑80 at Lambs Interchange |
24414 |
136.94 |
40.74336111 |
-111.6587333 |
3 |
WB I‑80 at Lambs Interchange |
24737 |
136.95 |
40.74373056 |
-111.6586333 |
3 |
Dates and Hours
Four days were chosen because of their unique traffic and weather patterns.
- Thursday, January 1, 2009: no inclement weather;
- Friday, January 2, 2009: Snow in test site 1 and test site 2;
- Friday, June 26, 2009: Rain in test site 1 and test site 2; and
- Saturday, June 27, 2009: no inclement weather.
Hours included in the analysis are from 12:00 p.m. to 11:00 p.m.
Figure 3.5
Stations near Salt Lake City Airport

Figure 3.6
Stations near Parley’s Summit
Weather Data
Snowfall:
- UDOT (Clarus) stations do not have precipitation data for January 2009.
- Both of the hourly national weather station archives from SHRP2 study and the ASOS data archives downloaded from NWS web site show snowfall started in the airport location around 6:50 p.m. on June 26, 2009.
Rainfall:
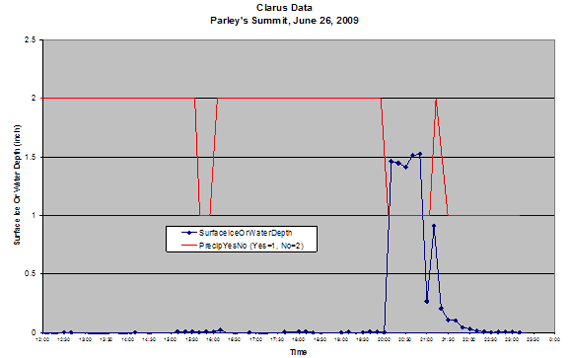
- Clarus archives for June 26 precipitation data are plotted in the following Figures 3.7 and 3.8. These figures show that rainfall started around 7:30 p.m. at I‑15, and around 8:00 p.m. at Parley’s Summit with both locations experiencing peak rainfall between 8:30 p.m. and 9:00 p.m.
- Both of the hourly national weather station archives from SHRP2 study and the ASOS data archives downloaded from NWS web site show rainfall started in the airport location around 6:40 p.m. on June 26, 2009.
Figure 3.7
Rainfall at I‑15 at 500S
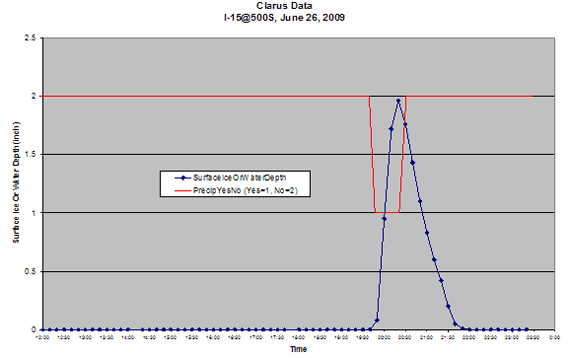
Figure 3.8
Rainfall at I‑80 at Parley’s Summit
Traffic Speed
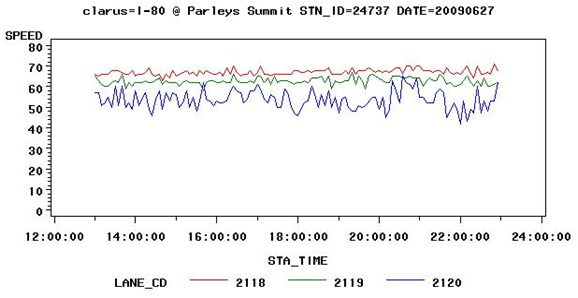
Figures 3.9 and 3.10 compare speeds on two consecutive days on I‑15 near the Salt Lake City airport. Figure 3.9 represents the speed profile on the rainy day graphed in Figure 3.7, June 26, while Figure 3.10 shows speeds on the following day June 27, which was dry. The graphs show a clear speed reduction on the evening of June 26 between 7:00 p.m. and 8:00 p.m., about the time of heaviest rainfall. Figure 3.10 shows that during the same period the following day there was no change in speed during that period, which in any case occurred after peak hours.
Figure 3.9
Traffic Speed on I‑15 on June 26/Wet Weather
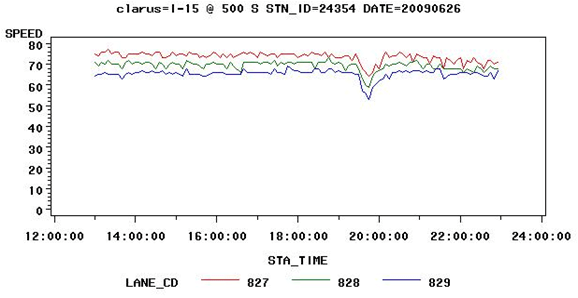
Figure 3.10
Traffic Speeds on I‑15 on June 27/Dry Weather
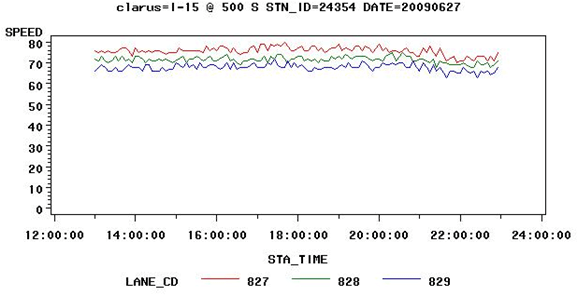
Figures 3.11 and 3.12 show the parallel data for the Parley’s Summit ESS Station. Detector data are taken from the westbound side of the highway, which has a downhill grade. There is a slight decrease in speed during the rainy period on June 26, but unlike the I‑15 stations the change in speed when compared to the dry condition is small.
Figure 3.11
Traffic Speeds on I‑80 Parley’s Summit
on June 26/Wet Weather
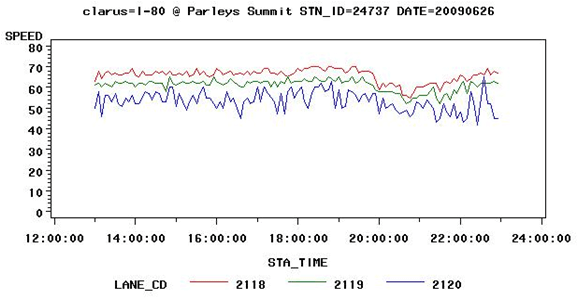
Figure 3.12
Traffic Speeds on I‑80 Parley’s Summit
on June 27/Dry Weather
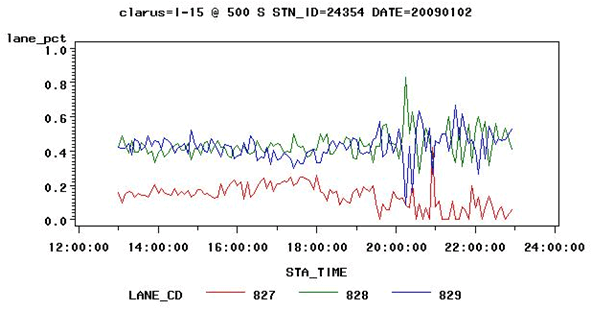
Figures 3.13 and 3.14 show the impact of snow travel speeds on I‑15. Hourly snowfall data were not available but data from the NWS at Salt Lake City Airport indicated that snowfall started just before 7:00 p.m. on January 2 at the Salt Lake City Airport. Figure 3.14 indicates a significant drop in speed during the evening hours of January 2, when compared with speeds at the same time on the previous day. Speeds dropped from over 70 mph to the 30 to 40 mph range at around 8:00 p.m. and stabilized at around 50 mph after that. Figures 3.15 and 3.16 show the change in lane distribution between the same two periods. Figure 3.16 indicates that the snowfall resulted in a shift of traffic from the high-speed lane into the middle lane at around the same time that speeds dropped. This pattern lasted for a relatively short time, however, and it is important to note that lane shifts could be impacted more by the location of snowplows than by the snowfall itself. A much larger set of data from multiple storm events would be required to analyze lane-changing behavior during snowfall.
Figure 3.13
Traffic Speeds on I‑15 on January 1/Dry Weather
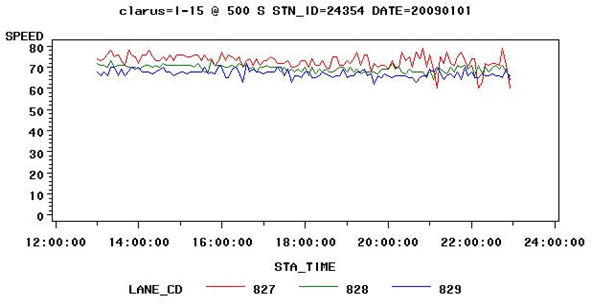
Figure 3.14
Traffic Speeds on I‑15 on January 2/Snowy
Weather
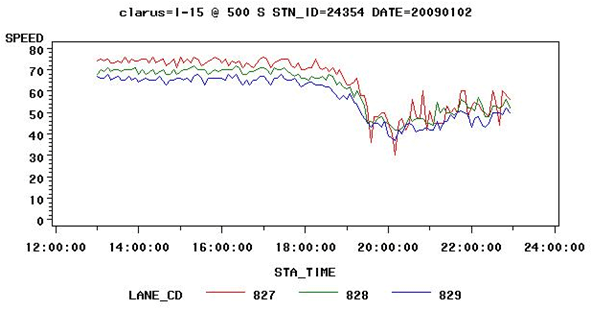
Figure 3.15
Lane Distribution of Traffic on January 1/Dry Weather
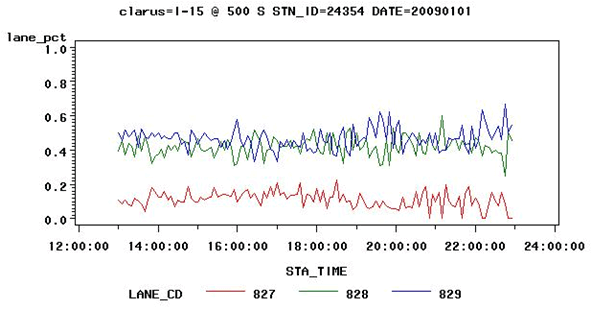
Figure 3.16
Lane Distribution of Traffic on January 2/Snowy
Weather
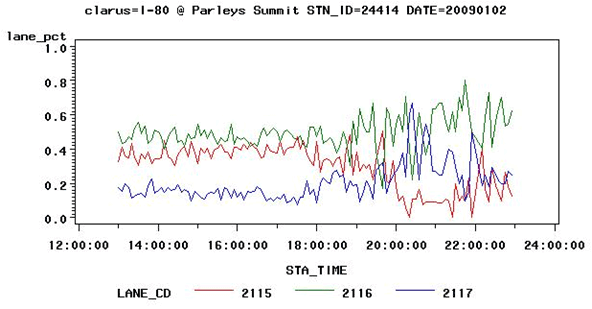
A set of graphs parallel to those shown above in Figures 3.13 to 3.16 is shown below for I‑80 at the Parley’s Summit station (Figures 3.17 through 3.20) in the mountains east of Salt Lake City. These graphs show a similar but more distinct pattern with greater speed reductions and more significant and consistent lane shifts during the snowfall period. This result is anticipated given the grades found in this area and the fact that it is darker than the urban area along I‑15. Speeds during the evening of January 2 drop down to around 20 mph just before 7:00 p.m. and stay around 30 mph for the remainder of the evening. For much of the snowfall period it appears that traffic shifted from the left lane to the middle lane. Heavier snowfall, steeper grades, plowing sequences, and less lighting are all possible explanations for the greater shift.
Figure 3.17
Traffic Speeds on I‑80 on January 1/Dry Weather
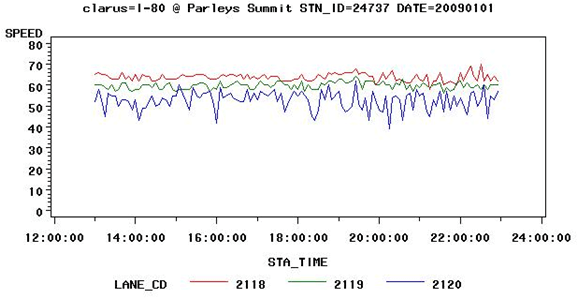
Figure 3.18
Traffic Speeds on I‑80 on January 2/Evening
Snowfall
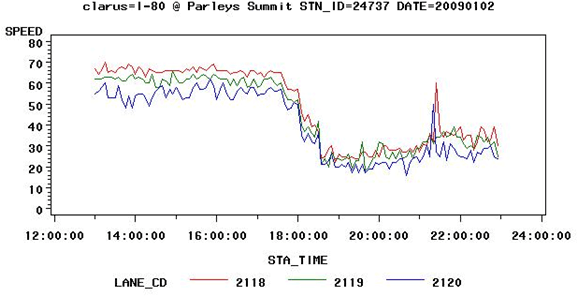
Figure 3.19
Lane Distribution on I‑80 on January 1/Dry
Weather
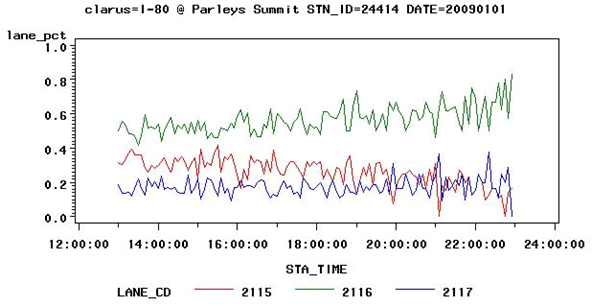
Figure 3.20
Lane Distribution on I‑80 on January 2/Evening
Snowfall
3.8.3 Minneapolis St. Paul Area Sample Tests
Test Site
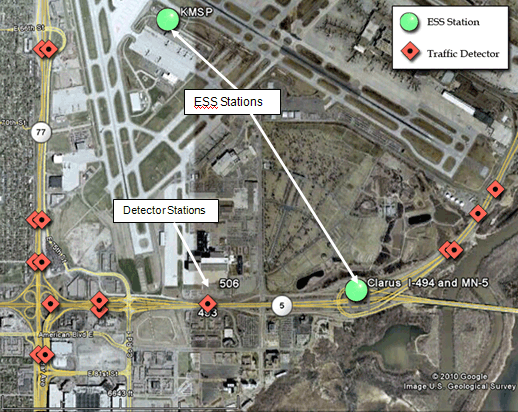
One test site was used in Minneapolis‑St. Paul, located near Minneapolis St. Paul International Airport (Figure 3.21). Two traffic stations sites were chosen because of the proximity to weather stations, and the completeness of data coverage. Table 3.9 shows the metadata for the two traffic stations selected in the test area. Peak afternoon traffic occurs in the westbound direction. The nearby National Weather Station KMSP supplied weather data through SHRP2 Reliability Study (http://144.171.11.40/cmsfeed/TRBNetProjectDisplay.asp?ProjectID=2179) and the NWS ASOS data archive web site. MnDOT has a weather station located on I‑495 at MN‑5.
Table 3.9 Traffic
Stations
Location |
STN_ID |
Milepost |
Latitude |
Longitude |
Number of Lanes |
EB I‑495 at 34th Avenue |
493 |
1.96 |
44.8619 |
–93.2290380283 |
5 |
WB I‑495 at 34th Avenue |
506 |
1.92 |
44.8623 |
–93.229026977 |
5 |
Dates and Hours
Two days were chosen for analysis because of their unique traffic and weather patterns.
- Tuesday, June 16, 2009: rainfall; and
- Wednesday, June 17, 2009: no inclement weather.
Hours included in the analysis are from noon to 11:00 p.m.
Figure 3.21
Stations near MSP Airport
Weather Data
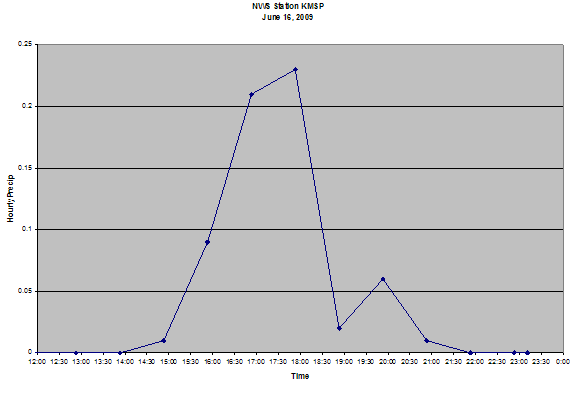
Both of the hourly national weather station archives from SHRP2 study and the ASOS data archives downloaded from NWS web site show rainfall started in the airport location around 3:20 p.m. on June 16, 2009 as shown in Figure 3.22. Clarus archives from the MnDOT ESS for June 16 could not be used for comparison as they showed zero precipitation.
Figure 3.22
Rainfall at MSP Airport
Traffic Speed
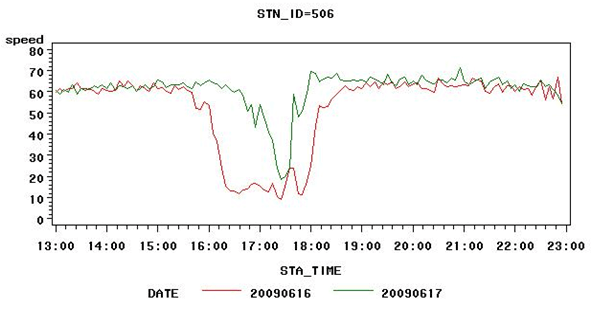
The following graphs (Figures 3.23 and 3.24)
show the average station speed on the two test days
with the green line representing dry conditions (June
17) and the red line rainy conditions (June 16).
Both of the two stations showed speed drops when
rainfall started. However, the westbound station
506 showed a significant decrease in speed on the
rainy day and a much longer peak period. A series
of graphs were developed showing lane distribution.
These are presented in Appendix A, but did not
provide conclusive evidence of lane shifting during
rainy conditions.
Figure 3.23
Comparison of Traffic Speeds on I‑494 Eastbound
on June 17 (Dry/Green Line) and June 16 (Rain/Red
Line)
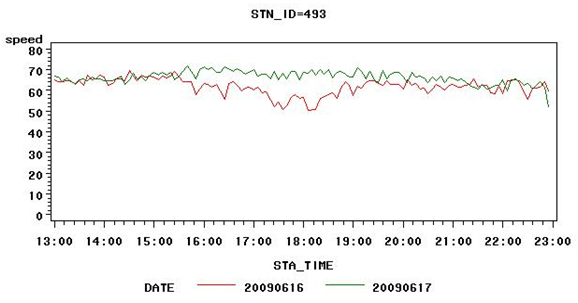
Figure 3.24
Comparison of Traffic Speeds on I‑494 Westbound
on June 17 (Dry/Green Line) and June 16 (Rain/Red
Line)
3.9 Conclusion and Next Steps
This purpose of this exercise was to conduct quick analysis of data from several cities to determine.
- How the quality and quantity has changed since a similar effort was conducted over three years ago; and
- To determine whether data selected could be used to show changes in traveler behavior (speed and lane changes) during adverse weather.
The analysis concluded that there has been an improvement in the quantity and quality of data available. This is particularly true of weather data, due to greater detail provided by NWS and a proliferation of weather observations sites through private sources. Deployment and maintenance of DOT ESS is quite uneven across the country with funding a major limitation. In addition, many of the DOT ESS stations only report precipitation occurrence, not precipitation intensity. The latter is necessary to be able plan and operate WRTM. The density and quality of traffic data available has improved as well. One of the major developments is improvement in the quality and density of speed data. This is due to the deployment of nonintrusive detectors, many of which have multiple capabilities. The proliferation of private sources of data, primarily providing point-to-point travel times, is a relatively new phenomenon that has not yet been fully tapped for analysis and research.
The analysis clearly indicated that the data could identify changes in speed and lane usage due to adverse weather. Development and analysis of much larger datasets could help transportation agencies identify parameters for weather-responsive traffic management particularly freeway-based strategies such as variable speed limits and ramp metering.
There are several implications of these findings for the Weather Responsive Traffic Management Program. While the amount and quality of both weather and traffic data are improving, data are collected primarily for operational purposes, not for research. Developing weather-related traffic management strategies requires extensive testing and simulation under a variety of both traffic and weather conditions. Multiple weather events must be included in the analysis. As a result FHWA should take two paths to continue this effort:
Work with agencies as they expand their ESS and traffic detection systems. Agencies should be encouraged to collocate detectors and should be made aware of FHWA’s ESS Siting Guidelines (http://www.itsdocs.fhwa.dot.gov/JPODOCS/REPTS_TE/14447.htm). Agencies should be encouraged to collect data, such as precipitation intensity, that provide adequate detail for this type of research.
Continue to support specific research projects that provide intensive measurement of driver response to adverse weather and traffic control strategies. Use of mobile sensors can help to provide the detailed data required for these measurements. Specific priorities for research activity will be determined through the FHWA’s five-year weather research program, which currently is being defined.
Previous | Next
|
 |

