|
Data Mining and Gap Analysis for Weather Responsive Traffic Management Studies
4.0 Information from Traffic Management Center Survey
As part of the effort to identify data gaps, the CS/VTTI team conducted a web-based survey of Transportation Management Centers around the U.S. All are operated either by state DOT staff or by private vendors under contract to state DOTs. Approximately 35 TMCs were contacted via e‑mail and 17 responded to the survey.
In addition representatives of CS and FHWA conducted a site visit to the Utah DOT TMC in Salt Lake City, which serves the entire State. With an in-house meteorological staff in place UDOT represents best practice in the integration of traffic and weather operations.
4.1 Traffic Management Center Survey Summary
The first part of this section summarizes the results of the TMC survey. Full results are included in Appendix B. Table 4.1 lists the survey respondents.
Table 4.1 List
of the TMCs that Responded to the Survey (Question
#1 TMC Survey)
Agency |
TMC |
Florida DOT |
District 4 Fort Lauderdale |
Florida DOT |
Headquarters, Tallahassee |
Indiana DOT |
Headquarters, Indianapolis |
Minnesota DOT |
Metro Region, St. Paul |
Florida DOT |
District 7, Tampa |
Michigan DOT |
West Michigan TMC, Grand Rapids |
Niagara International Transportation Technology Coalition (NITTEC) |
Multi-Agency, Buffalo, New York |
Kansas City SCOUT |
Missouri DOT and Kansas DOT, Lee’s Summit, Missouri |
North Carolina DOT |
Metrolina Regional Transportation Management Center, Charlotte |
New York State DOT |
INFORM TMC, Long Island |
New York State DOT |
Capital Region TMC, Albany |
New Hampshire DOT |
Statewide TMC, Concord |
Mississippi DOT |
Statewide TMC, Jackson |
Missouri DOT |
TMC, St. Louis |
Georgia DOT |
Statewide, Atlanta |
Michigan DOT |
Metro Region TMC, Detroit |
Texas DOT |
Austin District |
Most of the respondents were involved in TMC operations either directly or from a supervisory position. Respondents were asked what types of weather and traffic data they collect. About half the TMCs reported that they collect basic weather information, including air temperature, precipitation status, precipitation intensity, and wind speed/direction. Other weather data are collected by a much smaller number of agencies, including items such as road surface temperature and visibility, both of which are important to WRTM strategies. Table 4.2 summarizes the types of weather data collected from the TMC.
Table 4.2 What types
of weather data does your TMC collect and use? (Question
#4 TMC Survey)
Air Temperature |
9 |
(53%) |
Road Surface Temperature |
5 |
(29%) |
Road Subsurface Temperature |
1 |
(6%) |
Precipitation Status |
10 |
(59%) |
Precipitation Intensity |
8 |
(47%) |
Snow Depth |
3 |
(18%) |
Dewpoint/Relative Humidity |
3 |
(18%) |
Barometric Pressure |
3 |
(18%) |
Wind Speed and Direction |
9 |
(53%) |
Visibility |
4 |
(24%) |
Other |
4 |
(24%) |
If other, please specify |
4 |
(24%) |
Agencies also were asked what traffic data they collect, and as this is their primary purpose, virtually all respondents collect basic information such as speed, volume, incident detection/clearance times, and video data. Well over half also collect point-to-point travel times, a growing area of interest with the recent entry of multiple private contractors into the market. Data falling into the “other” category includes occupancy, performance measures, and customer satisfaction surveys. Table 4.3 shows the breakdown of traffic data collected and used by TMCs.
Table 4.3 What types
of traffic data does your TMC collect and use?(Question
#5 TMC Survey)
Traffic volumes |
16 |
(94%) |
Speeds |
17 |
(100%) |
Point to point travel times |
11 |
(65%) |
Incident detection and clearance |
17 |
(100%) |
Video data |
15 |
(88%) |
Other |
3 |
(18%) |
If other, please specify |
3 |
(18%) |
Agencies were asked their main source of weather data. Virtually all agencies use National Weather Service forecasts and a number use specialized services such as e‑mail reports. Most agencies utilize the Weather Channel and local media outlets in addition to reports off the Internet. Some agencies also make use of observations from field personnel and phone calls from the traveling public. Only 6 of the 17 respondents currently use RWIS or other field sensors but three additional agencies are in the process of planning and/or deployment.
Agencies were asked how they utilize weather and traffic data in weather-related traffic management activities. Thirteen of the 17 respondents reported that they provide weather-related traffic information while nine use the information in deciding which areas to monitor more closely with CCTV or detection equipment. Nine agencies also reported using the information to allocate duties to field personnel or TMC staff. Only three agencies reported more active weather-responsive traffic management activities such as variable speed limits, ramp metering or signal control. These agencies were Kansas City SCOUT, New Hampshire DOT, and Georgia DOT. Responses to this question are shown below in Table 4.4.
Table 4.4 How are
these information sources used in the TMC? (Question
#7 TMC
Survey)
Provide traveler information and advisories/warnings on road weather conditions (through 511, VMS/DMS, HAR, etc.) |
13 |
(76%) |
Implement weather responsive traffic control strategies (signal timing, ramp metering, variable speed limits) |
3 |
(18%) |
Decide which weather-affected or prone areas (e.g., icy roads, flooding) to monitor with CCTVs, detectors and other resources |
9 |
(53%) |
Set priorities and strategies for snow removal or other maintenance activities (wind damage, flooding, etc.) |
5 |
(29%) |
Scheduling and planning of winter maintenance activity? Nonwinter maintenance activity (striping, pothole repair, etc.)? (This is similar/related to 6d above, combine them.) |
1 |
(6%) |
Reposition/reallocate TMC staff or field maintenance personnel |
9 |
(53%) |
Other |
3 |
(18%) |
If other, please specify |
3 |
(18%) |
Many agencies currently do not have the infrastructure available to implement these strategies. A question was asked about whether agencies had an interest and/or plans to implement these strategies in the future. Five respondents expressed an interest in implementing weather responsive traffic management strategies, with small numbers of positive responses given to the other questions. Responses are shown below in Table 4.5.
Table 4.5 Are there
weather-responsive traffic management strategies you
currently are not using, that you would like to implement?
If yes, which strategies? (Question #8 TMC Survey)
Provide traveler information and advisories/warnings on road weather conditions (through 511, VMS/DMS, HAR, etc.) |
1 |
(6%) |
Implement weather responsive traffic control strategies (signal timing, ramp metering, variable speed limits) |
5 |
(29%) |
Decide which weather-affected or prone areas (e.g., icy roads, flooding) to monitor with CCTVs, detectors and other resources |
1 |
(6%) |
Set priorities and strategies for snow removal or other maintenance activities (wind damage, flooding, etc.) |
3 |
(18%) |
Scheduling and planning of winter maintenance activity? Nonwinter maintenance activity (striping, pothole repair, etc.)? (This is similar/related to above, combine them.) |
1 |
(6%) |
Reposition/reallocate TMC staff or field maintenance personnel |
2 |
(12%) |
Other |
0 |
(0%) |
If other, please specify |
0 |
(0%) |
Three of the responding agencies indicated that they had collected background information or done studies on possible implementation of WRTM strategies and two of the 17 respondents, Indiana DOT and Kansas City SCOUT, answered that they are sponsoring research studies on the traffic impacts of weather. While INDOT’s study is not yet available, KC SCOUT has documented their Weather Integration Self-Evaluation in an extensive report. While the report does not go into great detail in addressing the data requirements for WRTM, it does lay out a strategy for implementation of WRTM.
http://www.kcscout.net/downloads/Reports/Annual/WeatherIntegrationPlan.pdf 
Finally, 12 of the agencies responding indicated plans to expand traffic and weather data collection activities. These are summarized in Table 4.6.
Table 4.6 Plans for
Expanded Weather and Traffic Data Collection (Question
#12 TMC
Survey)
Agency |
Plans/Comments |
Florida DOT District 2 |
Have RWIS on all FDOT bridges and up to one RWIS every two miles |
Minnesota DOT District 4 |
Conducting an informal study on precipitation for variable speed limits |
Michigan DOT |
Deploying RWIS in some regions |
Texas DOT |
Planning RWIS deployment |
Florida DOT District 5 |
Installing visibility detection system on remote portion of I‑4 |
Kansas City SCOUT |
Currently assessing services available from third-party providers to integrate advanced weather technologies into our ATMS system as digital/polygon and road-specific elements to getter enable advanced warning using DMS and web-based notifications |
North Carolina DOT MRTMC |
Planning ice detection on high-rise flyovers |
New Hampshire DOT |
Looking to increase the number of RWIS sites and looking to develop a weather operations training program for its TMC operators |
Mississippi Department of Transportation |
Future plans may involve wind speed detectors in coastal areas and ice detection on bridges |
Georgia DOT |
Weather stations were taken off-line due to communications problems and aging equipment. Media and NWS currently are adequate for needs |
In summary, virtually all responding TMCs collect a basic set of traffic data, while about half collect a basic weather dataset. Many of the agencies that do not collect weather data are located in warmer-weather states but they are showing increasing interest in specific weather information since they are impacted by phenomena such as bridge icing, reduced visibility, and high winds. For the most part weather data are used for traveler information purposes, although there is increasing interest in weather responsive traffic management studies. The survey indicates there are a number of agencies with data available to conduct analysis of weather impacts on traffic. However, limitations of this information have been demonstrated elsewhere in this report with data obtained from Atlanta, Minneapolis‑St. Paul, and Salt Lake City. Several agencies such as Utah DOT and Minnesota DOT, which employ in-house meteorological staff provide the most promising opportunity to develop improved analysis datasets.
In spite of current limitations there are great opportunities emerging to develop good research datasets from TMC-based archives and from real-time data as well. ITS deployments are being expanded and many older systems are now being replaced with more modern equipment that uses IP, providing possible opportunities for direct data feeds to research institutions. While most agencies still make limited use of archived data, there is increased interest in this area due to upcoming Federal regulations that will require more extensive and detailed reporting of performance measures. Geographic expansion of ITS infrastructure, greater use of probe data and increase in the number and sophistication of DOT-owned ESS also are likely to provide better opportunities.
While targeted research is still required to develop effective WRTM strategies, this research is expensive and time-consuming, particularly in the data collection phase. If researchers can work directly with TMC operations personnel to use archived and real-time data scarce research funds can be leveraged. In addition this approach will help develop relationships that will enable WRTM strategies to be tested and evaluate more quickly in the field. These efforts can be expedited by bringing TMC operators and researchers together in workshops or summits. Dissemination of best practices, such as the UDOT example which follows, also will encourage further cooperation. The TMC survey indicates that this approach has great promise.
4.2 Utah DOT Site Visit
4.2.1 Introduction
One of the objectives of the project was to identify some of the more advanced agencies in the collection and integration of weather and traffic data. As discussed in Section 3.0 the consultant team identified transportation operations agencies that are most advanced in the collection and integration of weather and traffic data. Analysis was conducted on data from three cities, Atlanta, Minneapolis‑St. Paul, and Salt Lake City. After this initial review and consultation with FHWA, the project team decided to conduct a site visit to an agency which was actually using weather-related data for traffic management purposes. After considering several sites the project team settled on the Utah DOT Traffic Management Center (TMC) in Salt Lake City for a site visit. UDOT employs a team of meteorologists in the TMC and utilizes weather data in a number of operational activities. The visit was conducted on June 7 to 8, 2010 by a representative of FHWA and a representative of the consultant team.
4.2.2 Operations Center Overview
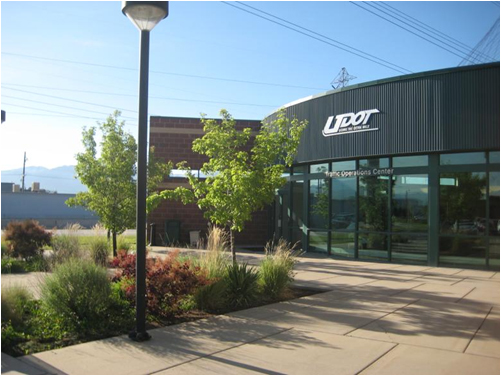
The UDOT Traffic Operations Center (TOC) is located in Salt Lake City (see Figure 4.1) but serves the entire State of Utah.
Figure 4.1
Utah DOT Traffic Operations Center
The TOC Tracks state highways through CCTV and a variety of detection equipment, including loop detectors, radar, and ultrasound. About 600 of the 700 CCTV statewide are located in the Salt Lake Valley, the State’s major population center. The remainder are scattered throughout the State, with many in mountain passes and others at major interchanges along the rural Interstate system. The UDOT ITS has been expanded over the years by building ITS into new road projects and this continues today.
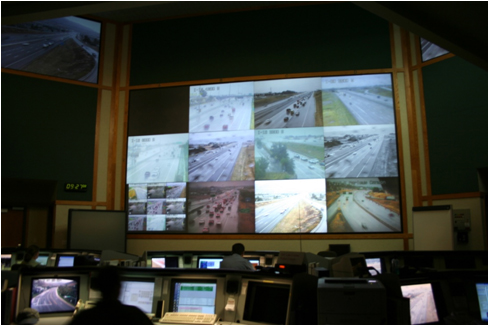
The TOC operation is described as “near 24/7.” Operators are on duty at all times except the 1:00 to 5:00 a.m. shift during early part of the week. There are generally three operators during peak periods. Operators rotate through CCTV feeds are part of their normal duties except when incidents take priority. The TOC provides data to CommuterLink which is the brand name for UDOT Traveler information web site. Communication with motorists on the highway occurs through Dynamic Message Signs (DMS). The default usage for DMS is travel times between prespecified points. UDOT interpolate speeds between adjacent detectors to obtain travel times and has found that the density of detection equipment is adequate to accurately report times. UDOT has recently been installing Wavetronix nonintrusive detectors which provide speed data as well as count information. TranSuite (TransCore) is used as the TMC Operations software and the PeMS system is used for archived traffic data. A picture of the main TOC control is shown in Figure 4.2.
Figure 4.2
Utah DOT Traffic Operations Center Main Control
Room
One station in the TOC is reserved for a traffic signal engineer who manages signal timing for 1,200 of 1,700 total signals in the State. The traffic engineer works jointly with municipalities on signal timing, a relationship that is helped by the fact that software and systems are compatible.
The Utah Highway Patrol has a dispatch center in the TOC, which enables TOC operators to have direct access to incident information reported through CAD/911. TOC and UHP personnel communicate directly during major incidents or as otherwise is necessary.
ClearChannel communications has room adjacent to TMC for traffic reporting. The presence of media within the TOC gives UDOT another way to get information out to the public. Colocation allows good communication, assuring that the information will be accurate. The TOC and ClearChannel have good working relationship. One of the benefits for UDOT is exchange of data and support from ClearChannel personnel in developing UDOT announcements.
4.2.3 Weather-Related Issues for UDOT
UDOT has a full staff of meteorologists located in the TMC. Weather is a major focus of UDOT activity for a number of reasons:
- Average snowfall is approximately 60 inches per year in Salt Lake Valley but can reach up to 600 inches per year in some of the mountainous areas. In addition to snow removal, avalanches are major safety hazard that UDOT must address. Staff includes an avalanche forecaster on staff and an avalanche control team within the DOT.
- Surface temperature data are considered critical in making winter maintenance decisions. UDOT can realize significant savings by prioritizing winter maintenance activities efficiently.
- Depending on snowfall levels and spring rains, mudslides can be severe in canyon areas, resulting in closed and/or damaged roads.
- Severe thunderstorms occur in Utah, which can be very localized. Road flooding occurs; often in spot locations.
- High winds are major issue on I‑80 west of Salt Lake City and in some other areas of the State. Heavy commercial vehicle volumes make overturned trucks a major danger. High winds also stir up dust storms which can limit visibility and result in run-off-the-road or chain-reaction crashes.
- Areas of thick fog develop around Great Salt Lake and in mountain valleys.
- Wildfires can reduce or entirely eliminate visibility in certain parts of the State.
- Extreme heat can cause buckling of concrete joints resulting in road closure and repair.
UDOT Weather-Related Activities
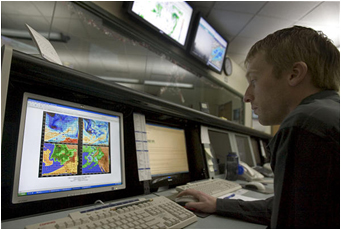
To help address the numerous issues identified above, UDOT hired a staff meteorologist to manage its weather-related activities, including a contract with Northwest Weathernet, Inc. Northwest provides seven meteorologists as well as forecasting services to both the TOC and UDOT operations and maintenance. Northwest also provides forecast service for Nevada and Wyoming using UDOT as operating base. This results in cost savings for all three agencies and helps UDOT fund contract that are critical for UDOT to know weather developing in other states, especially Nevada. Figure 4.3 shows one of the meteorological work stations in the TOC.
Figure 4.3
Utah DOT Traffic Operations Center Meteorological
Station
Northwest is responsible for maintenance of ESS around the State. Maintenance is conducted on each ESS minimum of twice per year. A dedicated maintenance bay for ESS has been set aside on UDOT property next to TOC.
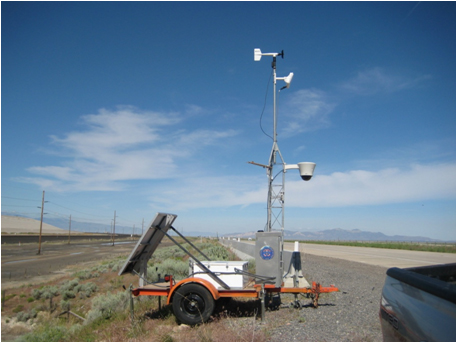
Over time, UDOT has designed customized ESS that use equipment from a variety of vendors. Campbell Scientific provides controllers and software for the system. Significant cost savings have been achieved by 1) being able to tailor each ESS to specific needs at the site and 2) having UDOT own the data rather than a private vendor. Figure 4.4 shows a new ESS recently installed north of Salt Lake City along with an inside look at the cabinet. UDOT also utilizes a mobile ESS in order to test the feasibility of different locations, or address a temporary need. A picture of the mobile station is shown in Figure 4.5. This was installed along I‑80 west of Salt Lake City, where high winds have been a problem.
Figure 4.4
New Permanent ESS Installation
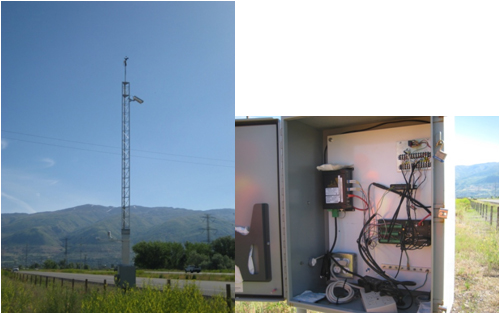
Figure 4.5
Mobile ESS
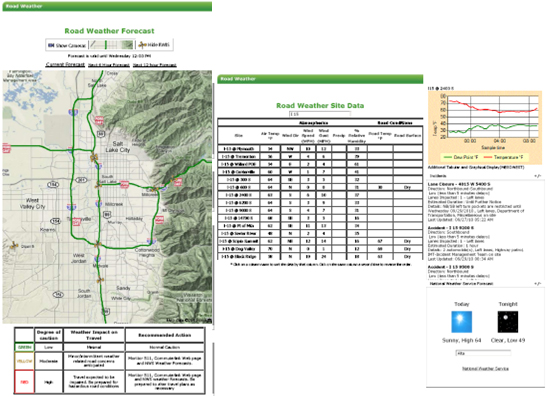
One of the recent integration initiatives of UDOT has been to develop a set of traveler information messages based on the weather forecast. A recently hired Northwest staff member has been assigned to this project. UDOT is making significant effort to develop weather-related messages that are useful to traveling public and easily understood. The meteorological staff uses three-color coding scheme to classify road conditions – green, yellow, red. Detailed color-coded maps are provided to TOC operators and other operations personnel and copies are kept as an historical record. Figure 4.6 show examples of RWIS information available to the public on the UDOT Commuterlink web site.
Figure 4.6
UDOT CommuterLink Web Site – Weather
Forecast
UDOT Weather-Related Partnerships
UDOT recently initiated a project with the National Weather Service and the University of Utah (UU) to determine what messages are most effective with public, including messages delivered through the web and DMS. UU will be doing surveys of travelers to find out how the public responds to different types and formats of weather warning messages. A subsequent activity of UDOT will be to determine what level of weather data is required to provide effective messaging. Specific activities of the project include:
- Targeted surveys related directly to three events; 400 per event;
- Assess levels of awareness among the public, sources of information used and responses to road/weather information; and
- Evaluate and identify strategies for communicating critical information.
UDOT already has developed a draft agreement with UHP regarding weather-related messages for DMS. The agreement covers a wide range of conditions, including ice, wet roads, snow, and high winds. Emergency scenarios and special events are included as well as weather. Using DMS for advisory speeds has been discussed, but UHP is opposed due to a concern that they can be confused with legal speeds. UDOT and UHP have collaborated on a set of wind warning messages with recommended actions based on wind speed. UDOT is working with UHP to prohibit truck traffic where there is severe danger of overturning an effort that also involves a freight planner who is evaluating the impact traffic restrictions on the commercial vehicle industry. The goal is to avoid negative economic impact unless absolutely necessary. There is some discussion of automating wind warning signs.
UDOT’s partnership with local National Weather Service has been very beneficial. UDOT participates actively in NWSChat and has worked with NWS on message wording. NWS grid forecasts are available on both CommuterLink and 511. The most recent collaboration is on Winter Weather Road Impact Project which includes:
- A review of the travel time index (deviation from mean travel time) during specific days and peak periods. They were able to determine that the only events that had a major impact on system reliability were winter storms and holidays.
- Detailed analyses were conducted on two separate storms to identify the factors that influenced travel time reliability. They found that both snowfall amounts and road surface temperatures, as well as level and timing of mitigation activities, could have a major impact.
- They used sensor data to obtain a good estimate of the impact of winter storms on travel demand. There appeared to be a major reduction in discretionary travel, especially during p.m. peak.
- As mentioned earlier, this effort includes development of a common message on travel warnings from NWS, UDOT, Northwest Weather net and the media.
- They continue to look for ways to increase the level of detail in weather information allows, which will allow more specific messages to be delivered. For example thunderstorm warnings could be provided on a limited number of DMS when a very localized area is impacted.
One of the more advanced capabilities of the UDOT TOC is the implementation of weather-responsive signal timing plans by the TOC Traffic Engineer. The basis for modifications is a 2001 University of Utah study which estimated a 30 percent speed reduction on arterials during snow events. There are three to four different weather responsive plans for each corridor which vary by time of day which generally involve a change in splits or offsets. A slightly different strategy is used on one road, the Baumgartner Highway, where signal timing changes are made to facilitate plowing of intersections. There is SCATS system in Park City which provides some potential to implement weather-related plans.
4.2.4 Research/Partnership Opportunities
A number of research and partnership opportunities were identified for FHWA and UDOT to work together on filling data gaps related to weather and traffic.
- A large volume of data is potentially available to estimate the impact of adverse weather on both demand and microscopic traffic flow. UDOT has CCTV and detection on some major arterials as well as freeways. They do not record video as policy but there is a possibility of exception for research purposes.
- With weather-related timing plans in place, a unique opportunity exists to look at benefits of weather-responsive arterial signal timing. Some detection would have to be added to arterials but this could provide some very useful input to the FHWA Road Weather Management Program.
- UDOT’s work on weather-related messaging, including messages and format of delivery, could be leveraged by FHWA to help identify best practices in this area.
- UDOT’s approach to development and deployment of ESS, as well as their meteorological staff, is another example of best practice that could be leveraged by FHWA.
Previous | Next
|
|