| Summary of Laboratory and Field
Studies |
 |
 |
Prediction of 28-day
Flexural Strength
The prototype PRS recommends using core testing as an indirect
measure of in situ flexural strength.(1,2,3) Cores are taken at some
reference maturity equivalent (for example, 3 days at 22 °C). The
mean compressive or splitting tensile strength of the cores from each
sublot is adjusted to a 28-day strength under standard laboratory-cured
conditions. This equivalent mean 28-day compressive or splitting
strength is then converted to a third-point loading flexural strength
using an approved interstrength relationship developed (prior to
construction) from the specific concrete mixture and project-approved
aggregates, cement, and admixtures used during construction. The
procedure was roughly outlined in the previous PRS study and evaluated
during the prediction variability portion of this investigation, as
described in appendix D of this report.(1,2,3) The developed
prediction procedure is necessary because the concrete fatigue model used
in the PRS is based on 28-day, standard cure flexural strength.
The effects of flexural strength on fatigue life performance are
well-documented in the literature. Therefore, while no further field
investigations of the effects of flexural strength on pavement performance
were performed during the current project, a laboratory study was
completed to better explore the errors associated with estimating a 28-day
standard cure flexural strength from early age strengths.
Testing
Procedure
The previous PRS study compared core and cylinder compressive
strength tested at ages of 7, 14, and 28 days for specimens cured under
identical curing conditions.(1,2,3) The study concluded
that there is no statistical difference between core and cylinder
compressive strengths at any of the three investigated maturities.
However, the study did not include data from specimens tested at an
equivalent 3-day standard laboratory maturity. Therefore, additional
laboratory testing was performed to establish whether there is a
statistical difference between 102-mm diameter core and 152-mm diameter
cylinder compressive and splitting tensile strength at 3 days.
Different coarse aggregate types and cements were sampled from each of the
four projects used for the strength prediction model study (see table
66). Each coarse aggregate was used with two cement contents to give
a total of eight mixes. The concrete mixes were batched in
accordance with the American Society for Testing and Materials (ASTM) C
192, Standard Practice for Making and Curing Concrete Test Specimens in
the Laboratory. Similar to the previous PRS study, 12 cylinders
were cast for each mix and moist-cured for 3 days. Six cylinders
were cored just before testing. The core lengths were trimmed to
meet the required length-to-diameter ratio of 2 to 1 established by ASTM C
42, Standard Test Method for Obtaining and Testing Drilled Cores and
Sawed Beams of Concrete. Along with this standard, strength
testing was performed in the laboratory in accordance with the following
ASTM specifications:
- Compressive
Strength—ASTM C 39, Standard Test Method for Compressive Strength of
Cylindrical Concrete Specimens.
- Splitting Tensile
Strength—ASTM C 496, Standard Test Method for Splitting Tensile
Strength of Cylindrical Concrete Specimens.
Compressive strength (three cores and three cylinders) and
splitting tensile strength (three cores and three cylinders) were
determined on concrete made from the same batch and cured under identical
conditions. In addition to the laboratory data collected, results of
field samples obtained during the variability investigation were also
summarized. For some of the field projects evaluated, cylinders were
cast and cored to obtain a cylinder-to-core relationship. Because
curing conditions were identical, the relationship is similar to the lab
study. In addition, cores were drilled from the field pavement at
some sampling locations. Because the variability of this
relationship is slightly increased due to inconsistencies between specific
batch constituents, the average cylinder and core strengths were evaluated
and presented.
Summary of
Strength Results
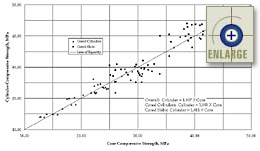
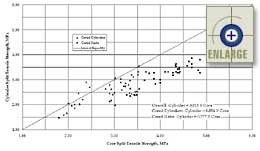
The results of the cylinder-to-core relationships are plotted in
figures 73 and 74 for the compressive and splitting tensile strength data,
respectively. On each graph, the best-fit linear equations are also
presented. As described in the previous section, relationships were
made between cylinders and cored cylinders, cylinders and cored slabs, and
overall data sets. All three equations are given in the
figures.
 |
|
Figure 73. Results of the
cylinder compressive strength versus core compressive strength
study. |
 |
|
Figure 74. Results of the
core split tensile strength versus cylinder split tensile strength
study. |
In the previous PRS study, it was concluded that there is no
significant difference between core and cylinder compressive strengths,
irrespective of mix design, coarse aggregate hardness, and coarse
aggregate geometry.(1,2,3) Since the data again
appear to be clustered around the line of equality (1 to 1), paired
t-tests were done to determine if there is a statistically significant
difference between matched pairs of core and cylinder compressive
strengths. Two-tailed t-tests were performed on data sets of 44
cored cylinders, 44 cored slabs, and 88 overall pairs. In the
analyses, the t-values were calculated to be -0.049, -0.222, and -0.099
for the cored cylinders, cored slabs, and overall data,
respectively. Therefore, the null hypothesis that there is no
statistically significant difference between core and cylinder compressive
strengths could not be rejected at the 5-percent significance level for
any of the compressive strength data sets.
For completeness, paired t-tests were also performed to confirm
that there is a statistically significant difference between matched pairs
of core and cylinder splitting tensile strengths. Two-tailed t-tests
were performed on data sets of 43 cored cylinders, 36 cored slabs, and 79
overall pairs. In the analyses, the t-values were calculated to be
3.209, 8.631, and 5.569 for the cored cylinders, cored slabs, and overall
data, respectively. Therefore, the null hypothesis that there is no
statistically significant difference between core and cylinder compressive
strengths was rejected at the 5-percent significance level for all of the
splitting tensile strength data sets.
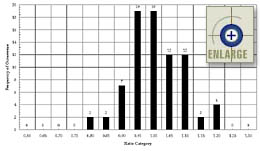
Examination of the overall distribution of the compressive
strength cylinder-to-core ratios showed an approximately bell-shaped
distribution around 1.0. The 88-point relative frequency histogram
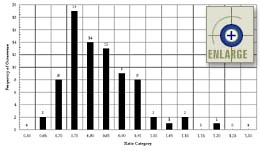
is shown in figure 75. However, as expected, an examination of the
splitting tensile strength cylinder-to-core ratios showed a very skewed
curve distributed around 0.75. The 79-point relative frequency
histogram is shown in figure 76.
 |
|
Figure 75. Relative
frequency histogram of cylinder-to-core compressive strength
ratios. |
 |
|
Figure 76. Relative
frequency histogram of cylinder-to-core splitting tensile strength
ratios. |
The current transverse joint faulting, transverse joint spalling,
and transverse cracking distress indicator models require a 28-day
flexural strength. These current distress indicator models are
described in detail in the section titled Summary of Current Distress
Indicator Models.
Effect
of Entrained Air Content on Transverse Joint Spalling
Introduction
The effects of entrained air content on pavement performance were
not well-documented in the collected literature. However, under a
previous PRS study, a laboratory materials study was conducted to evaluate
the effects of air void system parameters on transverse joint
scaling/spalling percentages.(1,2,3) That research resulted
in three different relationships in which joint spalling was a function of
different combinations of entrained air content, void spacing factor,
compressive strength, freeze-thaw cycles (at a depth of 76 mm below the
pavement surface), and presence of deicing salt. (Note: These
relationships and their inputs are presented in English units.) The
first model was a function of entrained air content (not void spacing
factor), as not all agencies collect hardened air content data.
This developed relationship is presented in equation 14.(1,2,3)
SPALL =
22.6 + 75.1 * SALT * log(FTC76) – 78.0 * SALT – 11.7 * AIR
* SALT – 0.00478 * f’c
(14)
where
SPALL =
Joint spalling, percent of joint length.
SALT =
0 if no calcium chloride is present, 1 if calcium chloride is
present.
FTC76 = Cumulative
number of estimated freeze-thaw cycles at 76 mm below the pavement
surface.
AIR =
Measured air content of the fully consolidated specimen,
percent.
f’c = Measured
compressive strength mean, psi.
The second model estimated joint spalling as a function of both
entrained air content and void spacing factor. This relationship is
presented in equation 15.(1,2,3)
SPALL =
45.0 + 77.0 * SALT * log(FTC76) – 29.3 * AIR * SALT –
0.001 * AIR * f’c
– 1955 * L * SALT – 0.439 * L * f’c
(15)
where
SPALL =
Joint spalling, percent of joint length.
SALT =
0 if no calcium chloride is present, 1 if calcium chloride is
present.
FTC76 = Cumulative
number of estimated freeze-thaw cycles at 76 mm below the pavement
surface.
AIR =
Measured air content of the fully consolidated specimen,
percent.
f’c = Measured
compressive strength mean, psi.
L =
Void spacing factor, 1/in.
The third model estimated joint spalling as a function of void
spacing factor and not entrained air content. This relationship is
presented in equation 16.(1,2,3)
SPALL =
14.1 + 74.9 * SALT * log(FTC76) – 137.1 * SALT + 1727 * L
* SALT – 0.003 * f’c
(16)
where
SPALL =
Joint spalling, percent of joint length.
SALT =
0 if no calcium chloride is present, 1 if calcium chloride is
present.
FTC76 = Cumulative
number of estimated freeze-thaw cycles at 76 mm below the pavement
surface.
L =
Void spacing factor, 1/in.
f’c = Measured
compressive strength mean, psi.
In order to use these relationships with confidence, they need to
be verified under actual field conditions. Under the preceding PRS
study, two alternatives were recommended for additional field
investigation to accomplish this task.(1,2,3) The first option
recommended using in-service pavement sections that exhibited joint
spalling due to deficient air void parameters and consolidation
levels. The various air void parameters, effects of deicer salts,
and the estimated number of freeze-thaw cycles could then be correlated
with joint spalling. This information could be used to modify or
verify the previous PRS study performance models. The advantage of
this type of study is that a field-calibrated performance model could be
incorporated into the PRS.
The second option involved the construction and long-term
monitoring of specially constructed test sections. The advantage of
this option is that the developed performance model would be based on
long-term field performance. The disadvantage is that results would
not immediately be available (due to long-term monitoring) and certain
pavement sections are essentially sacrificed ("destined" to fail because
extremely low air contents would be used in order to observe accelerated
deterioration).
The research team decided to verify (or calibrate) the entrained
air content-based joint spalling relationships using field site
evaluations. The testing procedures and model development are
described in the following sections.
Sampling and
Testing Procedures
For this research study, in-service pavements were used to
calibrate the spalling performance models developed in a preceding PRS
study.(1,2,3) Sampling was performed
at three pavement joint repair projects, as shown in table 66. The
same three projects were used for the consolidation and air content
studies for variability. A number of joints from each project,
exhibiting varying degrees of joint spalling, were selected for the
evaluation. Joint repair projects were investigated because they
allowed the retrieval of a sufficient number of 102-mm-diameter
cores. At each joint evaluated, a sufficient number of cores were
removed from between the dowel bars so that laboratory analyses of
hardened air void parameters could be performed. The tests were run
in accordance with ASTM C 457, Standard Test Method for Microscopical
Determination of Parameters of the Air Void System in Hardened
Concrete. In addition, cores were removed to determine the
compressive strength of the concrete by ASTM C 42, Standard Test Method
for Obtaining and Testing Drilled Cores and Sawed Beams of Concrete.
As seen in equations
14 through 16, the laboratory-developed relationships were functions
of the presence of deicer salt (calcium chloride).(1,2,3) However, all three
projects used to verify the relationship were in areas where deicer salts
were regularly applied. Therefore, the SALT variable was effectively
removed from the current investigation. In the previously developed
equation, the use of salt was incorporated as "1" and the non-use of salt
was included as "0," thus eliminating the salt term. For the current
study, SALT was always "1", so the SALT multiplier was simply added to the
equation constant.
The final factor necessary to develop/calibrate the joint spalling
model was the number of freeze-thaw cycles experienced by the pavement.
Because the previous study was controlled in the laboratory, the
exact number of freeze-thaw cycles was determined with the use of
thermocouples placed 76 mm below the surface of the deicer blocks.
All the field sites evaluated in the current study were constructed more
than 20 years ago, and the exact number of freeze-thaw cycles was
unknown. Therefore, an estimate of the number of freeze-thaw cycles
was calculated using the climatic model incorporated into the
Climatic-Materials-Structural (CMS) computer program.(64)
Atmospheric data obtained from weather stations located near the
three projects for the past 3 years were entered into the CMS
program. The program output includes the number of freezing and
thawing cycles that occur at any depth in the concrete based on the amount
of weather station data input. To mirror the previous laboratory
study, a freeze occurred for each pavement when the temperature calculated
at a depth of 76 mm below the surface stayed below 0 °C for at least 48
hours. The pavement is assumed to be thawed when the temperature at
76 mm below the surface rises above 0 °C. The CMS program was then
used to predict the number of freeze-thaw cycles that occurred for each
project for the years 1994, 1995, and 1996. Based on studies
published by Dempsey, the resulting number of annual pavement freeze-thaw
cycles for the projects evaluated seem reasonable. This average
annual number of cycles was then multiplied by the age of the pavements
studied to compute the total number of cumulative freeze-thaw cycles for
each project.
Transverse Joint
Spalling Model Calibration
The collected data were used to calibrate the previously developed
model predicting the percent of joint that is spalled as a function of
compressive strength, freeze-thaw cycles, and air void system
parameters. For simplicity, the model incorporating entrained air
content is preferred over the models based on other air void system
parameters. The air content model would allow the use of plastic air
content data to be used as opposed to costly linear traverse
testing.
The collected data for the model calibration is summarized in
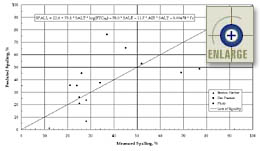
table 67. Figure 77 shows a plot of the predicted joint spalling
using the previously developed equation with entrained air content as the
only air void parameter (equation 14) versus the field-measured joint
spalling. Three new air void parameter-based regression equations
were derived using the data collected for this investigation.
Table 67. Data collected for variables
related to percent joint spalling.
|
Project |
Year Built |
Entrained Air Content, % |
Void Spacing Factor, mm |
Compressive Strength, MPa |
Number of Freeze/Thaw Cycles |
Percentage of Joint Spalled, % |
|
Benton Harbor, MI |
1971 |
10.6 |
0.1016 |
47.85 |
375 |
75 |
|
7.1 |
0.1016 |
46.82 |
375 |
28 |
|
7.8 |
0.1778 |
45.44 |
375 |
3 |
|
7.6 |
0.1016 |
46.61 |
375 |
12 |
|
5.6 |
0.2032 |
51.37 |
375 |
25 |
|
5.4 |
0.1524 |
51.09 |
375 |
28 |
|
Des Plaines, IL |
1967 |
5.7 |
0.3048 |
38.13 |
551 |
69 |
|
4.5 |
0.2540 |
48.26 |
551 |
52 |
|
6.7 |
0.1270 |
50.12 |
551 |
25 |
|
5.9 |
0.1778 |
46.75 |
551 |
34 |
|
4.9 |
0.2286 |
47.30 |
551 |
77 |
|
Philo, IL |
1970 |
2.9 |
0.2032 |
40.82 |
208 |
37 |
|
6.7 |
0.2540 |
35.37 |
208 |
21 |
|
7.1 |
0.1778 |
29.03 |
208 |
24 |
|
5.7 |
0.3048 |
38.54 |
208 |
26 |
|
4.3 |
0.3556 |
32.75 |
208 |
45 |
Note: The number of
freeze-thaw cycles was determined using air temperature data in
Dempsey’s CMS computer
program.(64)
 |
|
Figure 77. Predicted versus
measured transverse joint spalling using the "entrained air content
only" model developed under a previous PRS
project.(1,2,3) |
The first calibrated model, giving joint spalling as a function of
entrained air content only, is presented as equation 17.
SPALL =
115 – 9.29 * AIR – 0.0114 * f’c + 0.118 * FTC76
(17)
where
SPALL =
Joint spalling, percent of joint length.
AIR =
Measured air content of the fully consolidated specimen,
percent.
f’c = Measured
compressive strength mean, psi.
FTC76 = Cumulative
number of estimated freeze-thaw cycles at 76 mm below the pavement
surface.
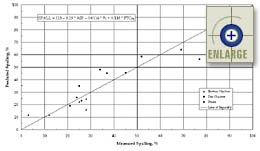
The collected data
used in the development of equation 17 are presented in figure 78.
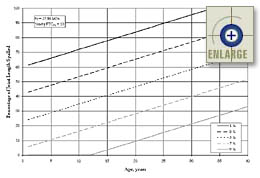
A plot showing the sensitivity of equation 17 (function of only entrained
air content) is presented in figure 79.
 |
|
Figure 78. Predicted versus
measured transverse joint spalling using the calibrated "entrained
air content only" model. |
 |
|
Figure 79. Sensitivity of
the calibrated "entrained air content only" spalling model
(percentage of joint length spalled versus age for different
entrained air content percentages). |
The second calibrated model, giving joint spalling as a function
of both entrained air content and void spacing factor, is presented as
equation 18.
SPALL =
96.1 – 8.45 * AIR + 747 * L – 0.00991 * f’c + 0.114 * FTC76
(18)
where
SPALL =
Joint spalling, percent of joint length.
AIR =
Measured air content of the fully consolidated specimen,
percent.
L =
Void spacing factor, 1/in.
f’c = Measured
compressive strength mean, psi.
FTC76 = Cumulative
number of estimated freeze-thaw cycles at 76 mm below the pavement
surface.
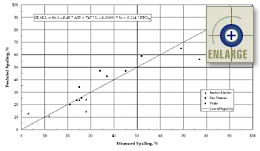
The collected data
used in the development of equation 18 are presented in figure
80.
 |
|
TFigure
80. Predicted versus measured transverse joint spalling using
the calibrated "entrained air content and void spacing factor"
model. |
The third calibrated model, estimating joint spalling as a
function of void spacing factor and not entrained air content, is
presented as equation 19.
SPALL = –7.3 + 3646 * L – 0.00403 *
f’c
+ 0.0963 * FTC76
(19)
where
SPALL =
Joint spalling, percent of joint length.
L =
Void spacing factor, 1/in.
f’c = Measured
compressive strength mean, psi.
FTC76 = Cumulative
number of estimated freeze-thaw cycles at 76 mm below the pavement
surface.
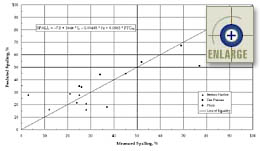
The collected data used in the development of equation 19 is
presented in figure 81.
 |
|
TFigure
81. Predicted versus measured transverse joint spalling using
the calibrated "void spacing factor only"
model. |
The complete procedure making
up the current transverse joint spalling model is described in detail in
the section titled Summary of Current Distress Indicator
Models.
Effect
of Percent Consolidation Around Dowels on Transverse Joint
Faulting
Introduction
The effects of percent consolidation level around dowels on
transverse joint faulting are not well-documented in the literature.
The three projects evaluated for the calibration of the spalling
prediction model were also evaluated for consolidation level at doweled
joints as shown in table 66. Different sections within each project
exhibiting a range of distress (faulting or loss of load transfer) were
selected for the evaluation of the effect of consolidation level on load
transfer across doweled joints. The relationship was integrated into
the current faulting prediction model, which is a function of concrete
bearing stress (BSTRESS).
Sampling and
Testing Procedure
To measure the in situ consolidation level of concrete pavements
at doweled joints, density was measured from drilled cores as previously
detailed in the consolidation variability study. For each project,
several joints exhibiting varying degrees of deterioration were selected
as part of the study. Cores were drilled through dowel bars,
between dowel bars, and away from the joint to evaluate relative
variability. Core densities were measured in a saturated
surface-dried condition in accordance with ASTM C 642, Standard Test
Method for Specific Gravity, Absorption, and Voids in Hardened
Concrete, to evaluate variability in consolidation incorporating the
effects of basket assemblies and dowel bars (above and below). The
core removed away from a joint with the highest density within a sampled
lot was assumed to be 100-percent consolidated. The remaining core
densities were compared to the 100-percent consolidated density to
determine the relative consolidation levels. This procedure
incorporates over-consolidation effects when vibration time is extended
over basket assemblies or when vibrators contact dowels for
longer-than-normal periods. Load transfer efficiency was directly
measured using a falling-weight deflectometer (FWD), and the effective
stress transfer efficiency was computed.
Summary of
Results
The variation of consolidation level was determined to be fairly
minor in the variability portion of this investigation. Therefore,
further projects were not evaluated for the collection of additional
data. However, based on the data collected for the three projects, a
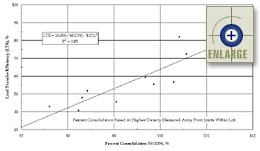
load transfer efficiency (LTE) versus percent consolidation relationship
was determined and is presented in equation 20.
LTE =
10.855 * (%CON) – 1021.7
(20)
where
LTE =
Load transfer efficiency, %.
%CON =
Computed percent consolidation around dowels, %.
The data used to
determine this relationship are plotted in figure 82. Also shown on
the graph is the derived regression equation for the relationship.
This relationship was incorporated into the current joint faulting model
(described in the section titled Summary of Current Distress Indicator
Models).
 |
|
Figure 82. Plot of load
transfer efficiency as a function of percent concrete
consolidation. |
Tie Bar Depth Versus
Load Transfer Efficiency
To evaluate the feasibility that a model could be developed
relating the tie bar depth to joint LTE, an FWD was used to measure
longitudinal joint load transfer at the Omaha, Nebraska site as shown in
table 66. As discussed in the section on tie bar variability, the
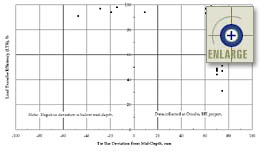
tie bars at the Omaha project were consistently placed nearly 76 mm above
slab mid-depth. However, as shown in figure 83 (for a consistent tie
bar depth), the load transfer varied from as low as 30 percent to about
100 percent. Also shown in the figure are five locations where tie
bars were placed significantly lower than average. The LTE was
approximately 95 percent for these locations. Therefore, the
collection of additional tie bar depth data from other construction sites
was aborted after data collected at the Omaha project suggested that a
reliable relationship was not likely.
 |
|
Figure 83. Load
transfer efficiency versus tie bar deviation from slab
mid-depth. |
| 


