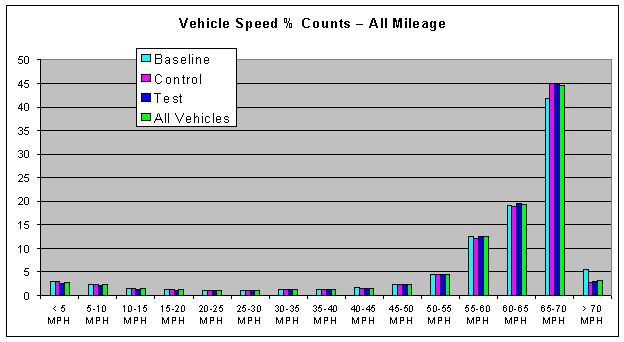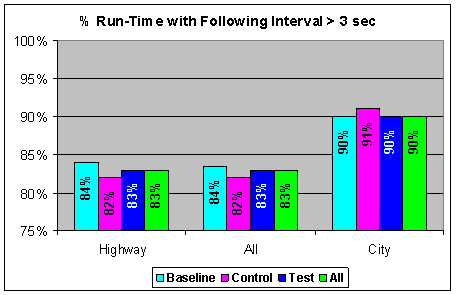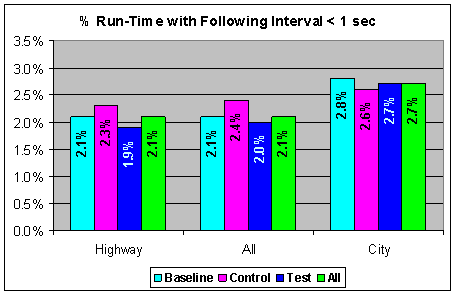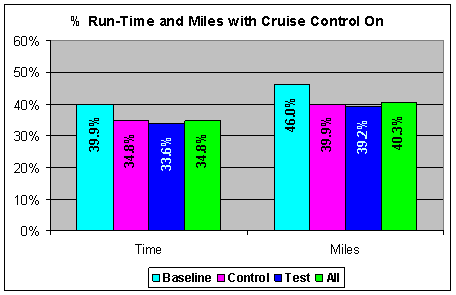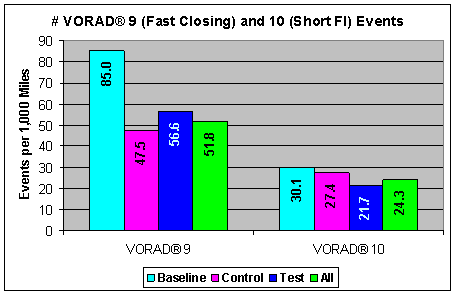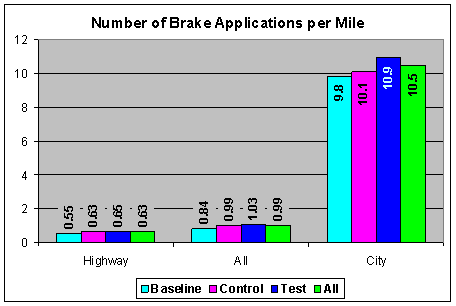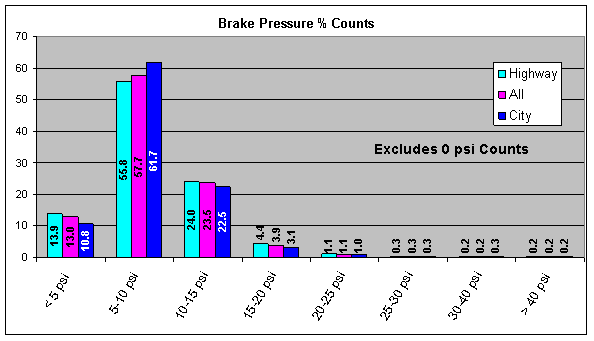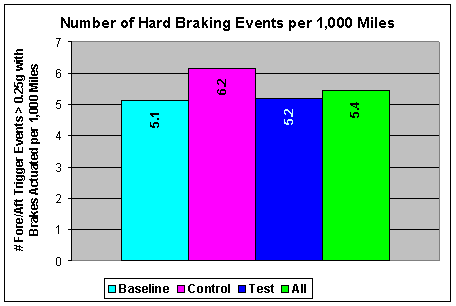
This report was prepared for the United States Department of Transportation by Volvo Trucks North America. The opinions, findings, and conclusions expressed in this publication are those of the author(s) and not necessarily those of the United States Department of Transportation, National Highway Traffic Safety Administration, or Volvo Trucks North America. The United States Government and Volvo Trucks North America assume no liability or responsibility for its content or use thereof, nor does either warrant or otherwise represent in any way the accuracy, applicability, adequacy, or efficacy of the contents. This report is offered for informational purposes only and in no way is an endorsement for any of the trade or manufacturers’ names mentioned herein.
Unless otherwise stated, and with the exception of the photograph of the U.S. DOT building on the cover page, all photographs, and illustrations are the property of Volvo Trucks North America.
The authors gratefully acknowledge the assistance and contributions of numerous individuals and organizations in preparing this report, in particular:
George Bartlett – Aberdeen Test Center (U.S. Army)
Luigi (Gino) Mastrippolito – Aberdeen Test Center (U.S. Army)
Thomas G. Domer – Domer & Company, Inc.
Jim Britell – NHTSA, U.S. Department of Transportation
Robert Miller – NHTSA, U.S. Department of Transportation
Santokh Singh – NHTSA, U.S. Department of Transportation
David Benfey – PAR/Rome Research Corporation
James Duffy – PAR/Rome Research Corporation
Marty Fletcher – US Xpress Leasing, Inc.
Steve Goodner – US Xpress Leasing, Inc.
Wally White – US Xpress Leasing, Inc.
Nicholas A. Rini – Volvo Trucks North America
Stephen Blaes – Volvo Trucks North America
A. Mac Bradley – Volvo Trucks North America
David M. Pierson – Eaton VORAD®
PDF Version 1.95 MB
2.0. DESCRIPTION OF THE VOLVO IVI FIELD OPERATIONAL TEST
2.1. Partners and Participants
2.2.2. Collision Warning System (CWS)
2.2.3. Adaptive Cruise Control (ACC)
2.3. Data Acquisition, Storage, and Preliminary Analysis (Overview)
3.0. PREPARATIONS FOR THE FIELD OPERATIONAL TEST
3.1.1. Research Plans – Volvo and Independent Evaluation
3.1.2. Integration Plan for Advanced Safety Systems
4.0. ADVANCED SAFETY SYSTEMS DESIGN, ACQUISITION, AND INSTALLATION
4.1. Control Vehicle Build, Delivery, and Preparation for Commercial Service
4.2. Baseline Vehicle Subgroup Identification and Preparation for Commercial Service
4.3. Test Vehicle Build, Delivery, and Preparation for Commercial Service
4.4. Video Recording System Installation
5.0. DATA COLLECTION AND MONITORING
5.1. Onboard Data Acquisition System Parameters
5.3. Advanced Safety Systems Durability and Reliability Data
5.4. US Xpress Maintenance Data
5.5. US Xpress Accident and Incident Data
5.6. Volvo Brake System Component Wear Data
5.7. Selected FOT Vehicle Operating Statistics
6.2.1. Sensor Failure Identification
6.4. Relative Frequency of Time Histories and Driving Conflicts Used for Analysis
6.6. Time History Pre-Trigger and Post-Trigger Perspective of Time Histories
6.8. Methods of Evaluation of Rear-End Driving Conflicts
6.8.1. Time to Collision at Braking (TTCb): Pre-Driver Response/Pre-Collision Conditions
6.8.3. Estimated Closest Approach (ECA): Result of the Driver Response
6.9. Optimization of Time Histories
6.10. Relationship of Methods of Evaluation to Optimization
6.11. Systems Analysis Considerations
6.11.1. Rear-End Collision Warning System (CWS)
6.11.2. CWS Driving Effects Analysis
6.11.3. CWS Driving Effects Analysis Summary
6.12.1. Risk Evaluation for Cruise Control
6.12.2. ECA Improvement Using Cruise Control
6.12.3. Following Interval with Cruise Control Comparisons
6.12.4. Differences in Driver Manual Deceleration from Cruise Control Deceleration
6.13. Individual Vehicle Effects
6.13.1. Individual & Overall Vehicle Deceleration Levels
6.13.2. Individual & Overall Vehicle Cruise Control Usage
6.13.3. Individual & Overall Vehicle Reaction Times to Warnings
6.14. Combined or Bundled System Effects
6.14.1. Combined Effects Comparison – Baseline vs. Control Risk Reduction
6.14.2. Combined Effects Comparison – Baseline vs. Test Risk Reduction
6.14.3. Combined ECA Improvement Effects Comparison – Baseline vs. Control
6.14.4. Combined ECA Improvement Effects of Baseline vs. Test
6.14.5. Summary of Combined Risk Reduction for Control and Test vs. Baseline
6.14.6. Combined ECA Improvement – Control and Test vs. Baseline
6.15. Systems Analysis Findings
6.15.1. Collision Warning System (CWS)
7.0. FOT VEHICLE OPERATIONAL PERFORMANCE
7.2. Collision Warning System Durability, Reliability, and Maintenance Costs
7.3. Disc and Drum Brake Durability, Reliability, and Maintenance Costs
7.4. ECBS and ABS Durability, Reliability, and Maintenance Costs
7.5. Braking System Stopping Performance Deterioration After Significant Time in Service
8.0. OBSERVATIONS AND CONCLUSIONS
8.1. Field Operational Test Observations
8.1.1. Observations Regarding Vehicle Operations
8.1.2. Observations Regarding the Collision Warning System
(Note: The following Appendices are not included in this version of the report.)
Appendix A – Research Plan
Appendix B-1 – Data Acquisition System
Appendix B-2 – Database Structure
Appendix C-1 – Optimization of Time Histories
Appendix C-2 – Collision Prediction Equations
Appendix D – Graphical Data Viewer Data Analysis Tool
Appendix E – Kinematic Motion Event Trigger
Appendix F – Vehicle History File
Appendix G – Vehicle Operational Data
Appendix H – US Xpress Accident Data
Appendix I – Brake Wear Data
Appendix J – IVI Warranty Data
Table 2.2-1. CWS Warning Levels
Table 2.2-2. Following Interval/Vehicle Speed/Following Distance Relationship
Table 5.1-1. Data Acquisition System Parameters
Table 5.2.2-1. Time History Triggers
Table 6.2-1. Failure Statistics for Flawed Sensors
Table 6.2-2. Non-Threat Target Types and Criteria
Table 6.3-1. Target Types and Statistics
Table 6.3.2-1. Number of DAS2 THs for Analysis
Table 6.5-1. Rear-End Pre-Collision Conflict Types
Table 6.5.1-1. Conflict Type Statistics
Table 6.6-1. Pre- and Post-Trigger Counts by Vehicle Group
Table 6.11.4-1. Warning Occurrences by Vehicle Type and Threat Type
Table 6.11.4-2. Probabilities for (a) Warning 1 (left) and (b) Warning 2 (right)
Table 6.12-1. Available TH Data for Cruise Control Analyses
Table 7.1-1. Summary Operational Data for the FOT Vehicles (DAS 2 Only)
Table 7.6-1. US Xpress FOT Vehicle Mileage Data
Figure 2.2-1. Volvo VN 770 Tractor
Figure 2.2-2. VORAD® Collision Warning System Components
Figure 2.2-3. Driver Display Unit (DDU)
Figure 2.2-4. ACC Operation Illustration
Figure 2.2-5. Typical S-cam Drum Brake
Figure 2.2-6. Typical Air Disc Brake
Figure 2.2-7. Brake Power, Hot Stop and Brake Recovery Characteristics
Figure 2.3-1. IVI Instrumentation System Illustration
Figure 6.2-1. Data Reduction Flow Chart
Figure 6.2-2. Distribution of File Types in IVI Database
Figure 6.3-1. Follow-On Time History Example
Figure 6.3-2. Receding Target Time History Examples
Figure 6.4-1. Time History Counts by Primary Trigger Type and Vehicle Group
Figure 6.5.1-1. Conflict Type Counts and Rates by Vehicle Group
Figure 6.7-1. Correlation of Recorded and Calculated VORAD® Warnings
Figure 6.8-1. Following Vehicle Changes Lanes and Avoids Predicted Crash
Figure 6.8-2. Lead Vehicle Turns Avoiding a Predicted Crash
Figure 6.8-3. Truck Changes Lanes After Lead-vehicle Cut-In
Figure 6.9-1. Typical Time History
Figure 6.9-2. Example of Time History Optimization
Figure 6.10.1-1. TTCb Frequency and Cumulative Probability Distribution (CPD) by Conflict Type
Figure 6.10.1-2. Relationship of Time to Collision and Deceleration
Figure 6.10.2-1. Idealized Time Plots
Figure 6.10.2-2. Corresponding Idealized Trajectory Plots
Figure 6.10.2-3. Three Sample LVCS Trajectory Variations
Figure 6.10.2-4a. Sample Brake Time CPBs with Driver Responses
Figure 6.10.2-4b. Sample Time to Collision CPBs with Driver Responses
Figure 6.10.2-5. ECA Frequency and CPD by Conflict Type (Filtered and ECA>0)
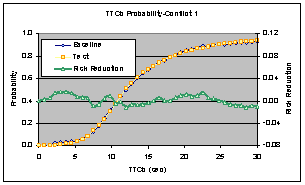
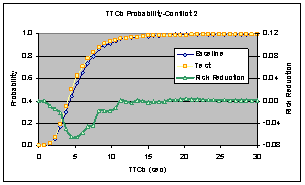
Figure 6.11.2-1. CWS Risk Reduction Based on TTCb
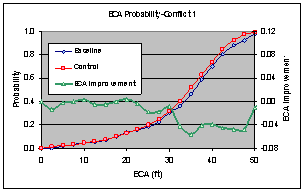
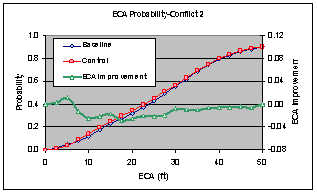
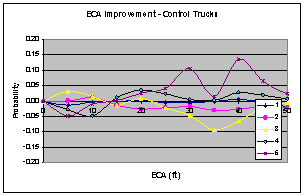
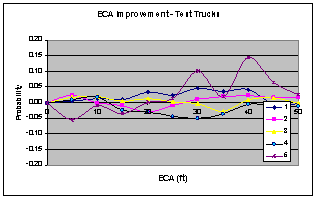
Figure 6.11.2-2. CWS ECA Improvement Based on ECA
Figure 6.11.2-3. CWS TTCb Risk Reduction at Various dL
Figure 6.11.2-4. Effect of the CWS on Driver Response at Various dL
Figure 6.11.2-5. CWS ECA Improvement at Various dL
Figure 6.11.2-6. Summary Effect of the CWS for Wide Range of dL
Figure 6.11.4-1. Warning 1 & 2 Probabilities from Threat and Non-Threat Targets
Figure 6.11.4-2. Warning Credibility
Figure 6.11.4-3. Distribution of CWS Warnings by Path Orientation
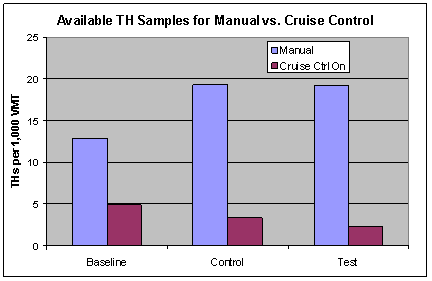
Figure 6.12-1. Available TH Data for Cruise Control Analyses
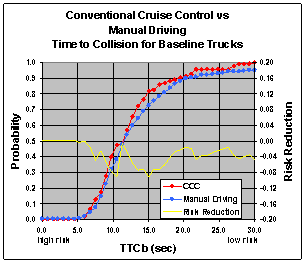
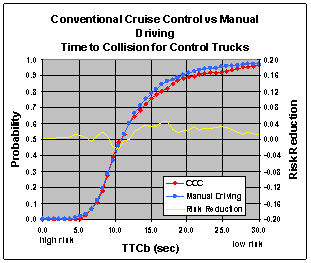
Figure 6.12.1-1. TTCb Risk Reduction Comparisons for Each Vehicle Type
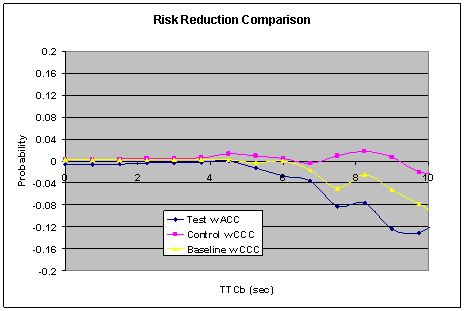
Figure 6.12.1-2. Risk Reduction Comparison of ACC With CCC
Figure 6.12.3-2. FI Improvement Summary
Figure 6.12.3-3. FI Improvement of Control and Test for Manual Driving
Figure 6.12.3-4. FI Improvement of Control and Test for Cruise Control Driving
Figure 6.12.4-1. Differences Between Manual and Cruise Control Deceleration
Figure 6.13.1-1. Individual & Overall Vehicle Decelerations
Figure 6.13.2-1. Individual & Overall Vehicle CC Usage
Figure 6.13.3-1. Individual & Overall Vehicle Reaction Time
Figure 6.13.4-1. Individual & Overall Vehicle TTCb
Figure 6.13.5-1. Individual Baseline Vehicle Following Interval
Figure 6.14.1-1. Combined Effects Comparison – Baseline vs. Control Risk Reduction
Figure 6.14.2-1. Combined Effects Comparison – Baseline vs. Test Risk Reduction
Figure 6.14.3-1. Combined Effects Comparison – Baseline vs. Control ECA Improvement
Figure 6.14.4-1. Combined Effects Comparison – Baseline vs. Test ECA Improvement
Figure 6.14.5-1. Risk Reduction Summary of Baseline vs. Control and vs. Test Vehicles
Figure 6.14.6-1. ECA Improvement Summary of Baseline vs. Control and vs. Test Vehicles
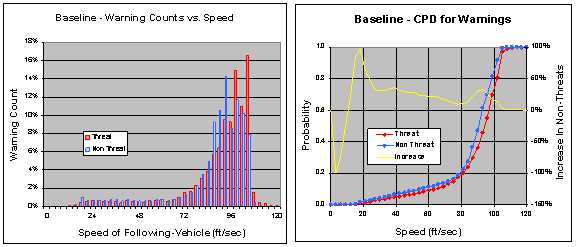
Figure 6.14.7.1-1. Warning Rates vs. Speed by Truck Configuration
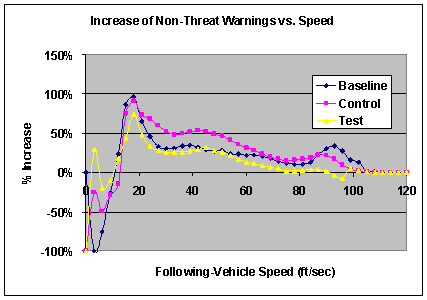
Figure 6.14.7.1-2. Increase of Non-Threat over Threat Warnings vs. Speed
Figure 6.14.7.2-1. Warning Rates vs. Following Interval for Each Vehicle Type
Figure 6.14.7.3-1. Deceleration Level To Avoid Conflict With ACC On
Figure 6.14.7.4-1. Speeds at Flying Pass Without and With Cruise Control for Each Vehicle Type
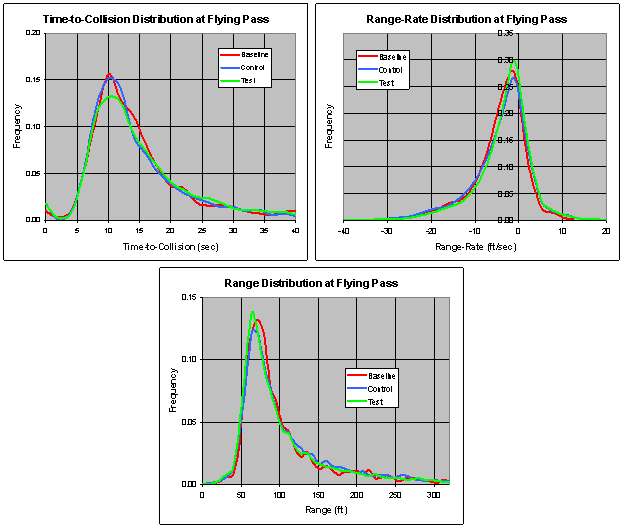
Figure 6.14.7.5-1. Range, Range-Rate and Time-To-Collision at Flying Pass for Each Vehicle Type
Figure 7.1-1. FOT Vehicle Run Time Road Speed Distribution
Figure 7.1-2. Percent of Run Time with Following Interval Greater than 3 Seconds
Figure 7.1-3. Percent of Run Time with Following Interval < 1 Second
Figure 7.1-4. Percent of Run Time and Run Miles with Cruise Control On
Figure 7.1-6. Number of Brake Applications per Mile
Figure 7.1-7. Brake Application Pressure Percent of Counts
Figure 7.1-8. Number of Hard Braking Events per 1,000 Miles
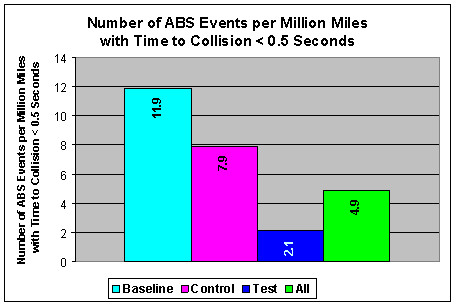
Figure 7.1-9. Number of ABS Events per Million Miles with Time to Collision < 0.5 Seconds
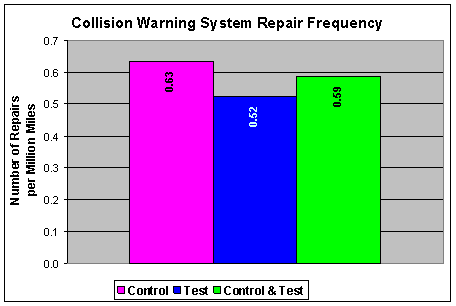
Figure 7.2-1. Collision Warning System Repair Frequency
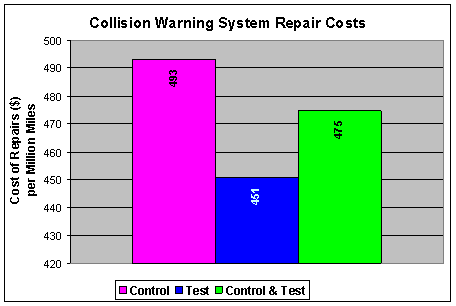
Figure 7.2-2. Rear-end Collision Warning System Repair Costs
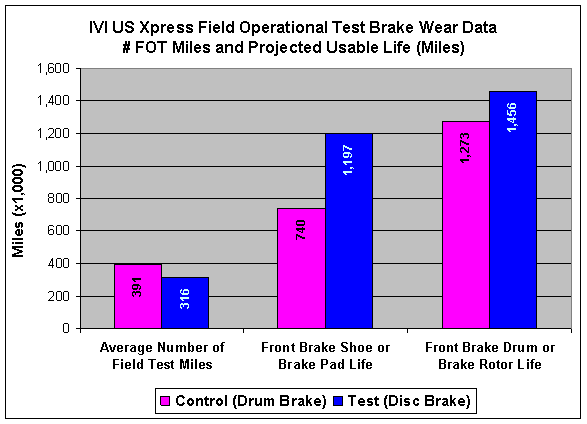
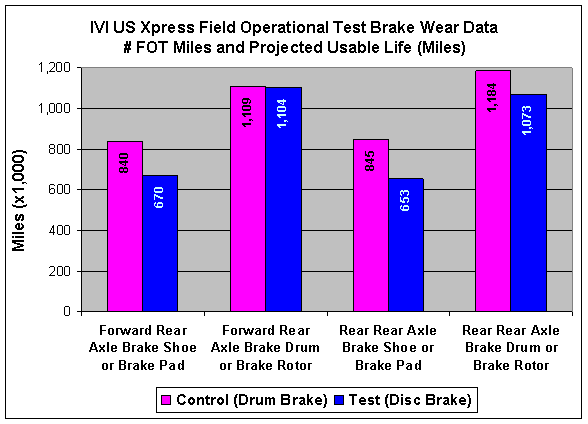
Figure 7.3-1. Projected Front Brake Useable Life Comparison
Figure 7.3-2. Projected Rear Brake Useable Life Comparison
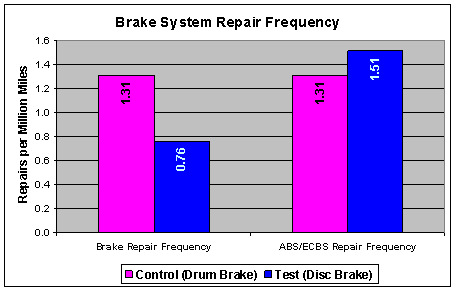
Figure 7.3-3. Brake System Frequency of Repair Comparison
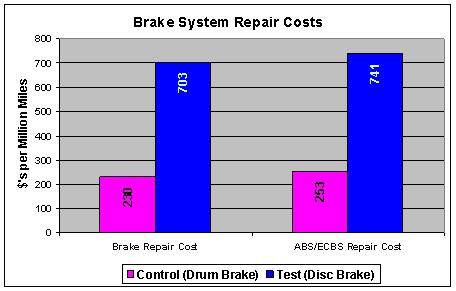
Figure 7.4-1. Brake System and ABS/ECBS System Repair Cost Comparison
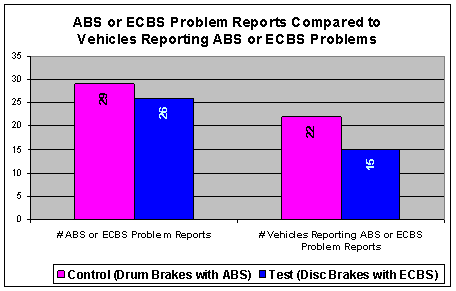
Figure 7.4-2. Comparison of FOT Vehicles with More than 1 ABS or ECBS Problem
Figure 7.5-1. Summary Results: 60 mph Stopping Distance "As Received" and with New Brakes Installed
Figure 7.5-2. Summary Results: 75 mph Stops “As Received” and with New Brakes Installed
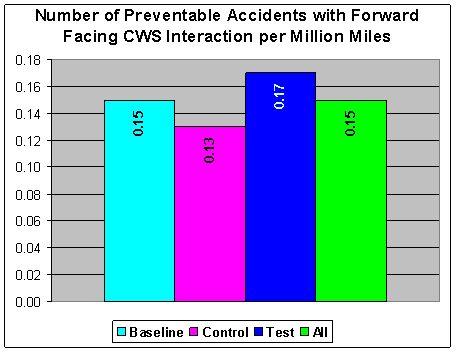
Figure 7.6-1. Number of Preventable Accidents and Incidents per Million Miles
Figure 7.6-2. Number of Preventable Accidents with Rear-end CWS Interaction
Figure 7.6-3. Number of Preventable Accidents with Rear-end CWS Interaction per Million Miles
ACRONYMS AND TERMINOLOGY
ABS |
Antilock Braking System; A system in which an onboard computer adjusts brake actuation pressure to avoid wheel lockup and subsequent loss of vehicle control. |
ACC |
Adaptive Cruise Control; a computer controlled system which, when activated, maintains a selected minimum following interval to a lead vehicle by adjusting the host vehicle’s speed based on radar information from the Collision Warning System. |
ATC |
Aberdeen Test Center (U.S. Army) |
ATH |
Abbreviated Time History File |
Baseline Vehicles |
A 20-vehicle subset of the 50 Control vehicles that were operated for part of the FOT with the Collision Warning System Driver Display inoperative. |
Bin |
Histogram interval named by the center value of the interval. |
CAN bus |
Controller Area Network bus. Main vehicle electronic data communication system connecting onboard vehicle system computers utilized to control vehicle operating systems (see J1939). |
CC |
Cruise Control – either ACC or CCC. |
CCC |
Conventional Cruise Control |
Conflict Control Vehicles |
A driving situation that would potentially lead to a collision. The 50 vehicles in the FOT equipped with normal US Xpress specified equipment, including VORAD® Collision Warning System and premium S-cam drum brakes. |
CPB CPD |
Collision Prevention Boundary Cumulative Probability Distribution |
CPU CWS DAS |
Central Processing Unit; A computer based electronic component designed to control functions of a system. Collision Warning System (See VORAD®) Data Acquisition System; An on-board, computer based device utilized to record vehicle and advanced safety system operating parameters and download the data to a central computer by remote wireless relay for analysis. |
DAS2 |
The second major revision to the list of the parameters recorded by the DAS |
ACRONYMS AND TERMINOLOGY (cont’d)
DI |
Decel Improvement – reduction of following vehicle deceleration (dF) due to the overall effect of the CWS |
dF |
Following-vehicle deceleration. |
dL DOT |
Lead-vehicle deceleration. The United States Department of Transportation |
Driving Conflict ECA |
A driving situation that would potentially lead to a collision. Estimated Closest Approach – a measure of the driver’s response to the threat posed |
ECBS |
Electronically Controlled Brake System – An advanced, computer-based integrated braking control system utilizing electronic signals to actuate wheel brakes and provide ABS functionality. |
ECU |
Electronic Control Unit |
FHWA |
Federal Highway Administration – An agency within the U.S. Department of Transportation that is charged with the broad responsibility of ensuring that America’s highways continue to be the safest and most technologically up-to-date. |
FI |
Following Interval – The separation measured as a time interval (seconds) between the time the lead vehicle passes a fixed point and the time the following vehicle passes the same fixed point. |
Flash Disk |
Data storage medium that uses integrated circuit memory chips. Removable PC Card format that emulates a standard personal computer disk. |
Flying Pass |
Lane change of vehicle at speed with no deceleration. |
FMCSA |
Federal Motor Carrier Safety Administration – An agency within the U.S. Department of Transportation that is responsible for reducing collisions, injuries, and fatalities involving large trucks and buses utilized in interstate commerce. |
FMVSS |
Federal Motor Vehicle Safety Standard |
FOT fps |
Field Operational Test – A test run under normal operating conditions in the environment typically encountered by the subject vehicles. Feet per second (1 fps = 0.682 mph or 1 mph = 1.47 fps) |
FV |
Following Vehicle – generally the subject vehicle in the FOT. The vehicle behind the lead vehicle. |
ACRONYMS AND TERMINOLOGY (cont’d)
g |
The acceleration of gravity (32.2 feet/second2 or 9.8 meters/second2) |
GES |
General Estimates System – A database maintained by NHTSA containing a probability-based nationally representative sample of all police-reported fatal, injury, and property damage only collisions. The data from GES yield national estimates, calculated using a weighting procedure, but cannot give State-level estimates. Also, GES is a sample of motor vehicle collisions, and the results generated are estimates. |
Histogram |
Data grouped into defined intervals and displayed according to their frequency of occurrence such as a bar graph where the bar widths are the defined intervals and the bar heights represent the frequency of occurrence. |
J1587 |
Commonly used to refer to the on-vehicle electronic data bus as a whole, this term specifically refers to an SAE Recommended Practice which defines the format, frequency, and circumstances of messages used on a bi-directional, serial communication bus connecting modules on the vehicle. |
J1939 |
A high-speed on-vehicle electronic control network based on CAN (Controller Area Network) technology as defined by the Society of Automotive Engineers SAE J1939 – Recommended Practice for Serial Control and Communications Vehicle Network. |
KME |
Kinematic Motion Equation used for a trigger condition. |
LV |
Lead Vehicle – generally the target vehicle in front of the subject (following) vehicle and being tracked by the VORAD® CWS as the primary target. |
mph |
miles per hour |
MSRC |
Major Shared Resource Center; Computer System at the U.S. Army Aberdeen Test Center utilized to store and organize data acquired from the Field Operational Test vehicles. |
NHTSA |
National Highway Traffic Safety Administration – An agency within the U.S. Department of Transportation that is responsible for reducing deaths, injuries, and economic losses resulting from motor vehicle collisions. The agency conducts research, sets, and enforces safety performance standards (Federal Motor Vehicle Safety Standards) to improve highway safety. |
Non-Threat Target |
A target under radar track that could not cause a conflict. |
Object |
Any entity (radar target) detected by the CWS. |
ACRONYMS AND TERMINOLOGY (cont’d)
PAR/Rome Research Corp. |
A Technical and Engineering Services organization headquartered in Rome, |
PCV |
Pressure Control Valve |
Range |
Distance between lead vehicle and following vehicle. |
Range Rate Reaction Time RR RRC |
Rate of change of following distance (range) per unit time. The time interval between a warning and the driver reaction to the warning. Risk reduction – Difference in two CPD curves as a function of TTCb. Rome Research Corporation |
SQL |
Structured Query Language |
Test Vehicles |
The 50 vehicles equipped with the advanced safety system devices including ACC, Disc Brakes, and ECBS. The test vehicles comprise half of the 100 vehicles that are the subject of the FOT. |
Target TH |
Target being tracked by the VORAD® radar. Time History; A recording of events and vehicle system parameters during a potentially hazardous (conflict) situation. Time Histories are initiated by a trigger, and document a 15 second time interval (10 seconds before and 5 seconds after a trigger). |
Threat Trigger |
A radar target under track that could cause a collision (conflict). Chosen limits of specific vehicle operating conditions which, when reached, initiate the recording of a Time History (TH). |
TTC TTCb |
Time to Collision used by the DAS for a trigger condition. Uses VORAD® range and following-vehicle velocity. Time to Collision at braking – interval of time between the initiation of a deceleration reaction (by the driver or ACC system) until the time when a collision with the target vehicle ahead would occur. TTCb is a measure of the degree of threat for a driving conflict. [Ref. Appendix C-2] |
USX |
US Xpress Leasing, Inc. |
UUID |
Universally Unique Identifier (for data files) consisting of an alpha-numeric string of characters |
ACRONYMS AND TERMINOLOGY (cont’d)
V-bus |
A proprietary implementation of the CAN bus used by the VORAD® system to communicate between the VORAD® ECU, the VORAD® Driver Display Unit, the VORAD® front radar sensor, and also the VORAD® side sensor (if installed). |
VF VIN VL VMT |
Following-vehicle velocity. Vehicle Identification Number Lead-vehicle velocity Vehicle Miles Traveled – specifically, a vehicle’s accumulated mileage recorded by the DAS. |
VORAD® |
Vehicle Onboard RADar – Eaton Corporation's trademarked collision warning system that utilizes forward-facing radar to determine the distance and relative speed between the host vehicle and objects in front of the host vehicle and warns the driver of potentially dangerous situations with visual and audible alerts. |
Warning 1 Warning 2 |
Recorded VORAD® audible warning for warning condition 6 (see Table 2.2-1) Recorded VORAD® audible warning for warning conditions 7-10 (see Table 2.2-1) |
![]()
PREFACE
This four-year Field Operational Test Project joined government and industry partners together to evaluate the performance of heavy tractor vehicles integrated Advanced Safety Systems. The vehicles were operated in normal commercial revenue-generating service throughout the 48 contiguous United States. Forward collision warning, adaptive cruise control, and disc brakes with electronically controlled brake systems comprised the Advanced Safety Systems that were studied. The Project involved 100 new tractors, 50 built to US Xpress fleet standard specifications, and 50 built with the Advanced Safety Systems. All 100 of the tractors were equipped with onboard data acquisition systems to record vehicle and system performance, and were put into service with US Xpress, a national fleet. Over the three years of Field Operational Test data collection, over 39 million miles of real world service was recorded for the 100 tractors. The objectives of the Field Operational Test were to determine the durability, reliability, operational costs, and driver acceptance of the Advanced Safety Systems, and to quantify the relative safety provided by the systems.
 EXECUTIVE SUMMARY
The Intelligent Vehicle Initiative (IVI) was established by the United States Department of Transportation as an integral part of the Intelligent Transportation System (ITS) program. By reducing the probability of motor vehicle collisions, the IVI was intended to improve the safety and efficiency of motor vehicle operations.
In September of 1999, the United States Department of Transportation, Federal Highway Administration entered into Cooperative Agreement No. DTFH61-99-X-00102 with Volvo Trucks North America in partnership with US Xpress Leasing, Inc. for a Field Operational Test (FOT) to determine the potential safety benefits of Advanced Safety Systems on heavy tractors. Additionally, Advanced Safety System durability, reliability, operational cost, and driver acceptance were to be evaluated.
The Advanced Safety Systems consisted of a vehicle-integrated rear-end collision warning system (CWS), adaptive cruise control (ACC), disc brakes, and an electronically controlled brake system (ECBS). These systems were developed to reduce the frequency and severity of rear-end collisions.
The objectives of the FOT were as follows:
- Evaluate the performance of the Advanced Safety Systems as operated in a real world environment.
- Accelerate the deployment of the Advanced Safety Systems.
- Help forge strategic partnerships in the transport industry as a model for public-private cooperation for the development and deployment of advanced transportation safety technologies.
- Assess the state-of-the-art in safety benefits analysis for vehicle integrated Advanced Safety Systems.
The 3-year data collection involved 100 new tractors consisting of 50 (Control) vehicles equipped with US Xpress normal specifications (including CWS), and 50 (Test) vehicles equipped with the Advanced Safety Systems. Baseline vehicles (a 20-vehicle subset of the 50 Control vehicles) were operated for part of the FOT with their CWS driver displays disconnected. All of the FOT vehicles were equipped with onboard data acquisition systems. Beginning in January 2001, the vehicles were placed into service with US Xpress, and were operated in normal revenue generating service throughout the 48 contiguous United States.
This report presents findings based on an engineering analysis of data collected from the onboard vehicle data acquisition systems, as well as operational data from Volvo warranty files, US Xpress accident and incident files, and vehicle brake component measurements. A separate, related report is in preparation by the FOT Independent Evaluator, Battelle, to determine safety benefits from the FOT.
The following Advanced Safety Systems were evaluated individually and as a combined system.
Collision Warning System (CWS) – The commercially available Eaton VORAD® EVT 300 CWS was installed on all 100 of the FOT vehicles. The CWS is a sophisticated, computerized device that uses forward-looking radar to constantly monitor vehicles ahead of the host vehicle. The system uses transmitted and received radar signals to determine the distance and relative speed between the host vehicle and objects in front. This information is used to warn the driver of potentially dangerous situations through visual and audible alerts.
Adaptive Cruise Control (ACC) – ACC utilizes the CWS forward-looking radar and conventional cruise control in a combined function. Eaton VORAD® SmartCruise® maintains a driver pre-set speed and following interval to the vehicle ahead of, and in the same lane as, the host vehicle. With the system operational, no vehicle within the range of the radar ahead, and no vehicle in the same lane as the host vehicle, the system operates like conventional cruise control by maintaining the speed set by the driver. If the CWS radar detects a vehicle ahead of and in the same lane as the host vehicle, the ACC will maintain a pre-set minimum following interval between the lead vehicle and the host vehicle by manipulating the electronic engine control functions via the J1939 vehicle electronic data bus.
Volvo Disc Brakes – A new generation of disc brakes for heavy vehicles that features more braking capability, resistance to brake fade, shorter stopping distances from higher speed ranges, consistent (not speed sensitive) brake torque, and improved durability and reliability.
Electronically Controlled Brake System (ECBS) – Supplied by Eaton Bosch, the computer-based system controls brake system functions electronically. The system provides shorter stopping distances due to faster brake engagement/disengagement timing, trailer braking system compatibility and adaptive braking pressure between tractor and trailer, lining wear control and warning, and anti-lock braking functions. The system includes full pneumatic brake control redundancy in the event of an electronic system failure.
Various sensors were placed throughout the tractors to provide the data necessary to evaluate the Advanced Safety Systems’ effect on the driver’s ability to avoid rear-end collisions. The US Army Aberdeen Test Center provided the onboard data acquisition systems that collected, stored, and transmitted data via cell phone to the U.S. Army’s Major Shared Resource Center for storage and analysis. Video recording devices were installed in 6 of the Test vehicles to simultaneously record forward view video imagery corresponding to the operational data. Volvo warranty data, US Xpress accident and incident data, and brake component wear data were compiled by Volvo for analysis.
- Following vehicle closing on a lead vehicle with constant velocity
- Following vehicle closing on a lead vehicle with both vehicles decelerating
- Following vehicle closing on a lead vehicle preceded by a lane change
- Following vehicle closing on a stopped lead vehicle
- Following vehicle closing on a decelerating lead vehicle
Rear-end Collision Warning System (CWS)
- In conflicts involving a high closing rate, the CWS provided drivers with more time to resolve the conflict.
- Drivers without CWS warnings (Baseline vehicles) experienced more high-closing rate conflicts.
- Despite a relatively high rate of warnings from non-threatening conflicts, driver acceptance of the CWS was high.
- CWS durability and reliability is good.
Conventional Cruise Control (CCC) and Adaptive Cruise Control (ACC)
- Driving with CCC provided drivers with more time to resolve conflicts over manual driving.
- ACC provided additional conflict resolution time over CCC.
- Drivers utilized cruise control for approximately 40% of the FOT mileage.
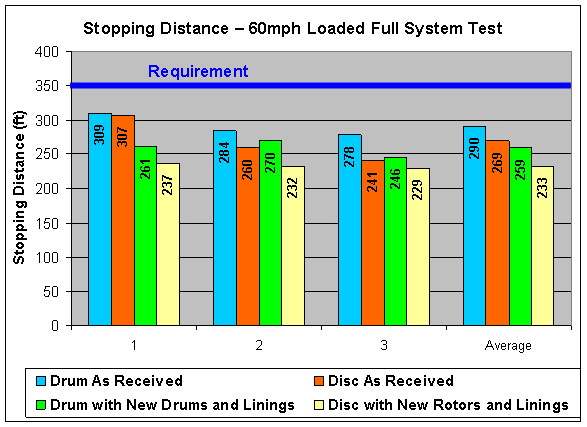
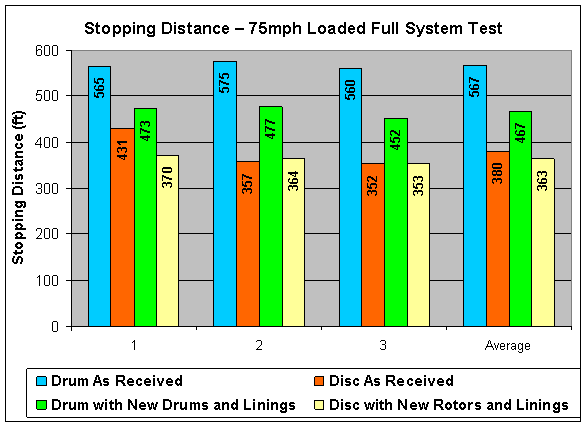
- Disc brakes provided significantly shorter stopping distances at highway speeds.
- Disc brake durability and reliability is very good.
- Disc brake cost is currently relatively high compared to drum brake cost but is expected to decrease with higher production volumes.
Electronically Controlled Brake System (ECBS)
There were no major system failures during the FOT.
Conclusions
The Advanced Safety Systems performed well in the FOT. During the 3 years of data collection there were no major system failures. The durability and reliability of the Advanced Safety Systems was as good as, or better than, comparable standard systems. The CWS provided a risk reduction for rear-end collisions by allowing more time for the driver to react to high-risk, fast-closing situations. Drivers generally adopted longer following-distance driving behavior while using CWS. CCC afforded a measure of risk reduction over manual driving in Control trucks; and ACC in Test trucks afforded additional risk reduction over CCC. As drivers utilized cruise control for approximately 40% of the miles traveled, the risk of rear-end collisions was reduced. Disc brake stopping distance performance was better than that of drum brakes, and their frequency of repair was much lower. Although the cost for disc brakes is currently somewhat higher than drum brakes, it is expected to decrease to a competitive level with full-scale production. The results of the FOT indicate that the Advanced Safety Systems provide improved safety with regard to rear-end collisions and are ready for commercial deployment.
1.0. INTRODUCTION
On December 9, 1998, the U.S. Department of Transportation, Federal Highway Administration issued a Request For Applications for Grant No. DTFH61-99-X-00003 “Intelligent Vehicle Initiative (IVI) Field Operational Test Program” soliciting bids for Generation 0 IVI field testing of Advanced Safety Systems. Volvo Trucks North America chose to evaluate the following Advanced Safety Systems: Collision Warning System (CWS), Adaptive Cruise Control (ACC), and Electronically Controlled Brake System (ECBS). The Advanced Safety Systems are expected to reduce the number and severity of accidents, thereby saving lives, lessening injuries, and reducing financial losses associated with traffic accidents. Further, secondary benefits of increased transportation mobility, productivity, and operational efficiency are expected. The Field Operational Tests (FOTs) are intended to evaluate the safety benefit of the Advanced Safety Systems.
1.1. Objectives
The four main objectives in conducting the Generation 0 FOT were as follows:
- Evaluate the performance of the Advanced Safety Systems as operated in a real world environment.
- Accelerate the deployment of the Advanced Safety Systems.
- Help forge strategic partnerships in the transportation industry as a model for public-private cooperation for the development and deployment of advanced transportation safety technologies.
- Assess the state of the art in safety benefits analysis for vehicle integrated Advanced Safety Systems.
Performance evaluations of the Advanced Safety Systems were expected to cover system hardware, software, driver-vehicle interfaces, as well as driver understanding, acceptance, and effective use of the Advanced Safety Systems. Marketing, operating, collision, and liability risks associated with serial production (deployment) of the Advanced Safety Systems were to be analyzed.
Objectives beyond Advanced Safety Systems performance evaluation were to accelerate commercialization of advanced safety system technologies by showing positive cost/benefit relationships if they existed, and to foster mutually beneficial partnerships to advance commercial vehicle operating safety, efficiency, and productivity as addressed in a separate report by the FOT Independent Evaluator, Battelle Institute.
2.0. DESCRIPTION OF THE VOLVO IVI FIELD OPERATIONAL TEST
The FOT was conducted as a Cooperative Agreement between the U. S. Department of Transportation, Federal Highway Administration, and Volvo Trucks North America in partnership with US Xpress Leasing, Inc. The purpose of the FOT was to evaluate the viability of vehicle integrated Advanced Safety Systems for commercial vehicles.
The Project was conducted in the following 5 phases.
Phase 1 – Preparation and Planning
During Phase 1, Volvo made plans and schedules for the design, development, and validation of the Advanced Safety Systems and Data Acquisition System. Volvo also planned and scheduled the build of the FOT vehicles including the DAS and additional sensors, and the delivery and integration of the FOT vehicles into the US Xpress fleet. A detailed Research Plan was prepared by Volvo, as well as training plans for FOT truck drivers and maintenance technicians.
Phase 2 – Systems Final Design, Acquisition, and Installation
Formal detail, assembly, and installation drawings along with bills of material and engineering releases were created for the collision warning, ACC, disc brake, and Electronically Controlled Brake Systems. An adaptation of ATC’s Data Acquisition System was designed. Wiring harnesses were created to tie the DAS to the vehicle systems via the vehicle electronic control data bus. The engineering release of the above noted drawings and bills of material provided the information required to procure, manufacture, assemble, and install the Advanced Safety Systems into FOT vehicles on the production line at Volvo’s New River Valley, Virginia truck assembly plant. The DAS was installed at a modification center adjacent to the Volvo truck assembly plant. Forward-facing video recording systems were installed in 6 Test vehicles after the vehicles were delivered to US Xpress.
Phase 3 – Training
Driving training for the Control vehicles consisted of the normal US Xpress driver training routine, along with an explanation of the FOT. The drivers were informed of the installation of the DAS and were also told that they would be occasionally interviewed during the FOT. Driver training for the Test vehicles consisted of a description of the Advanced Safety Systems, and in-vehicle training in the operation of the ACC system. No training was required for the disc brake or Electronically Controlled Brake System as their function was no different than standard systems from the driver’s perspective. Baseline vehicle drivers were chosen because they had neither CWS experience nor training, and were advised that CWS was to be activated subsequently during the FOT.
US Xpress Technician training was provided in mid-January 2001. Representatives from the 6 US Xpress maintenance facilities around the country were given Service and Repair manuals and were trained in the operation and maintenance of the Advanced Safety Systems (CWS, ACC, ECBS, and disc brakes).
Phase 4 – Monitor Field Test
One hundred FOT vehicles were operated in normal US Xpress revenue generating service. Commercial operations took precedence over field test requirements, assuring that the FOT reflected real world conditions and operations. Drivers were surveyed on occasion to determine their expectations, experiences, perceptions, and attitudes toward the Advanced Safety Systems.
The Data Acquisition Systems recorded and downloaded data to the U. S. Army’s Aberdeen Test Center Major Shared Resource Center computer via cell phone communication. At various intervals, the Independent Evaluator (Battelle) reviewed the status of the data collected and stored at ATC’s MSRC. Based on reviews of data, changes were made to the parameters recorded by the DAS. Driver interviews were conducted by the Independent Evaluator (Battelle) to determine driver comments regarding the advance safety systems.
As a result of the data problems identified by Battelle, a parallel data status review was commissioned. PAR/Rome Research Corporation was contracted to review the collected data, verify and validate the data, and perform an analysis. In some cases, previously unusable or corrupted data was salvaged by determining the underlying cause, and making corrections.
Phase 5 – Data Analysis and Final Report
Vehicle operational data analysis was performed individually for each of the Advanced Safety Systems. The vehicle operational data analysis addresses advanced safety system performance with regard to reliability, durability, maintenance costs, and accident rate. Driving performance parameters such as following interval, estimated closest approach, and time to collision at braking were examined and are discussed in this report. A separate, related analysis of driver behaviors resulting from interactions with the Advanced Safety Systems was performed to provide an estimated measure of safety benefits and human factors effects for each of the Advanced Safety Systems individually, and in combination by Battelle, the Independent Evaluator [ref. 1].
Vehicle operating data and Advanced Safety System performance data were collected from the FOT vehicles over the 3-year test period.
2.1. Partners and Participants
Volvo Trucks North America and US Xpress Leasing, Inc. agreed to join in partnership with the FHWA in this three-year FOT. Partner background information and main responsibilities for each are listed as follows.
Volvo Trucks North America is a subsidiary of Volvo Truck Corporation, which is a part of AB Volvo of Sweden. Volvo has produced heavy-duty commercial vehicles in the United States since 1981. At the cab manufacturing and truck assembly facility in New River Valley,
Acting in the role of lead partner, Volvo prepared and submitted the field test application, supplied the Program Manager, served as the integrator of the various technologies included in the FOT, developed the outline operational test program for Independent Evaluator and FWHA approval, shared in funding the FOT, and provided all reporting and administrative duties. Additionally, for the new generation disc brake system, Volvo finalized the adaptation design, procured tooling, supplied system components, and built the field test vehicles with the latest generation safety systems. Volvo trained mechanics and service technicians in the operation and maintenance of the Advanced Safety Systems, and maintained an inventory of spare parts.
US Xpress Leasing, Inc. (USX) is a nationwide general freight carrier with a truck fleet of over 4500 tractors that accumulate over 500,000,000 miles per year of travel. USX has 7 terminals and service facilities located throughout the United States. USX sets high safety standards for its drivers and vehicles, and continually joins with leading industry suppliers in developing safety and driver capability enhancements. US Xpress is based in Chattanooga,
USX provided and maintained the field test vehicles and educated, trained and scheduled drivers. It educated and trained service technicians in the operation and maintenance of the Advanced Safety Systems, facilitated the flow of data to the Independent Evaluator, provided the interface between the drivers and the other participants, administered day-to-day operations, provided feedback as to the performance benefits of the systems tested, and shared in the funding of the FOT.
FHWA/NHTSA provided guidance for development and approval of the FOT Program project plan, monitored the project, supplied guidance and assistance throughout the Project, provided the Independent Evaluator (Battelle), and shared in the funding of the FOT.
In addition to the three main partners, the participation of several other major suppliers was critical to the execution of the project.
Supplier participant Eaton VORAD® is a division of Eaton Corporation that markets their proprietary collision warning systems and ancillary hardware and software. VORAD® is located in Galesburg, Michigan.
Eaton VORAD® provided their EVT-300 Collision Warning System, blind spot detection (not evaluated), and ACC system. Hardware, software, vehicle integration and incident recording system interface design and implementation were supplied on a normal supplier/original-equipment-manufacturer shared-cost basis. Additionally, Eaton VORAD® cooperated and collaborated with Aberdeen Test Center in the design, construction, verification, and validation phases of the data acquisition and reporting systems. Eaton VORAD® also provided training and training materials for US Xpress drivers, mechanics and technicians as well as to Volvo’s aftermarket organization.
Supplier participant Eaton Bosch provided the ECBS, including hardware, software, vehicle integration, and incident recording system interface design and implementation. Additionally, Eaton Bosch cooperated and collaborated with Aberdeen Test Center in the design, build, verification, and validation phases of the data acquisition and reporting systems. Training and training materials were also provided by Eaton Bosch for US Xpress drivers, mechanics, technicians, and Volvo’s aftermarket organization.
Under subcontract to Volvo, the U.S. Army Aberdeen Test Center provided the integrated Data Acquisition Systems, including the design, assembly, and validation test of systems required for recording, storage, and transmission of the required data from vehicle parameters and field test systems. ATC loaded all data to a database, provided a web-based application for data summary, analysis, and daily e-mail status reports.
Volvo subcontracted with PAR/Rome Research Corporation to perform a detailed engineering analysis of the naturalistic driving data collected during the FOT. This was done to determine the performance effects of the CWS, ACC, and the Advanced Braking Systems installed on the FOT vehicles.
2.2. Vehicles and Equipment
The FOT utilized 100 new Volvo VN 770 tractors, 50 of which were equipped with commercially available collision warning systems, and with normal US Xpress specification S-cam drum brake and 6 channel ABS systems. These 50 vehicles were designated 'Control' vehicles. A 20-vehicle subset of the Control vehicles was created and was operated for part of the FOT with the Driver Display Unit deactivated. These 20 vehicles were designated 'Baseline' vehicles. The remaining 50 new tractors were equipped with the same CWS with the addition of ACC, and electronically controlled disc brakes. These 50 vehicles were designated ‘Test’ vehicles. All 100 vehicles were equipped with Data Acquisition Systems to record vehicle operational parameters as well as CWS alarms, warnings, and target data.
Figure 2.2-1. Volvo VN 770 Tractor
2.2.1. Volvo VN 770 Tractors
The FOT utilized 100 new Volvo VN 770 conventional tractors, equipped with Detroit Diesel Series 60 engines, Eaton Autoshift™ Transmissions, Meritor tandem rear axles with air suspension, and extended, high roof sleeper cabs. The 50 Control vehicles (including subset Baseline vehicles, [see section 6.1] were equipped with premium ArvinMeritor EX (Extended Life) S-cam drum brakes, Centrifuse brake drums, and Meritor WABCO 6 channel ABS. The brake system on the 50 Test vehicles consisted of pre-production Volvo Disc Brakes, and Eaton-Knorr ECBS. All of the FOT vehicles were equipped with an Eaton VORAD® Collision Warning System (CWS) and an onboard Data Acquisition System (DAS).
2.2.2. Collision Warning System (CWS)
The CWS utilized for this FOT was the commercially available Eaton VORAD® EVT-300. The CWS uses forward-facing radar, and optional right side mounted radar (not part of this FOT) to monitor vehicles in front and in the right side blind spot of the host vehicle. The forward-facing system transmits and receives radar signals, which it uses to determine the distance, azimuth, and relative velocity of target vehicles in front of the host vehicle. The CWS provides audible and visual alerts to warn drivers of potentially dangerous situations when other vehicles are within predefined distances or closing times. The right side facing radar transmits and receives radar signals to detect vehicles or objects in close proximity (2 to 10 feet) to the side of the host vehicle, and provides continuous visual alerts as well as audio alerts when the turn signal is activated. Although all 100 of the FOT tractors were equipped with the side facing radar detection and warning system, the side facing blind spot radar was not evaluated in this FOT as the test focused on rear-end collisions.
The Eaton VORAD® EVT-300 Collision Warning System is comprised of four main components: Antenna Assembly, Central Processing Unit, Driver Display Unit, and the Interconnecting Harness. Two components, the Side Sensor and Side Sensor Display (not evaluated as part of this FOT), are optional. Each of the components is shown in their approximate installed location on a vehicle (see Figure 2.2-2), and their functions are described in the following paragraphs.
The Antenna Assembly located on the front of the vehicle transmits and receives low power, high frequency radar signals. The Antenna Assembly is usually mounted in the center of the bumper, and this mounting location ensures that the radar beam is aimed directly in front of the vehicle. The transmitted radar signals are reflected off objects in front of the vehicle and are received back at the Antenna Assembly. The Antenna Assembly compares the difference between the transmitted and received signals, converts this information into a digital format, and transmits it to the Central Processing Unit for additional processing. The Antenna Assembly will simultaneously monitor up to 20 objects within a 350-foot range, whether moving or stationary.
The Central Processing Unit (CPU) is the electronic control unit for the EVT-300 Collision Warning System. The CPU compiles information from the Antenna Assembly, Engine Control Unit, Speedometer, optional Side Sensor (not evaluated), Brake, and Turn Signal Circuits to produce audible and visual warnings. The CPU and Antenna Assembly are programmable through a slot located in the opposite end from the cable connection on the CPU. System parameters can be set with a Prolink Diagnostic Tool or ServiceRanger. For the FOT, the CPU was located below the center dashboard.
Figure 2.2-2. VORAD® Collision Warning System Components
The VORAD® warning lights and tones are emitted as summarized in Table 2.2-1.
The Driver Display Unit (DDU) contains controls and indicators related to the system operation (see Figure 2.2-3). The Driver Display Unit controls system power-up, speaker volume, the range for vehicle warnings, and following interval thresholds for the SmartCruise® Adaptive Cruise Control system. A slot is also provided at the front bottom edge of the Driver Display Unit to insert the optional Driver Identification Card. Driver Display Unit indicator lights come on to indicate system power, system failure, absence of the Driver Identification Card, whether or not SmartCruise® is enabled, and multiple stages of warning levels. A light sensor in the face of the Driver Display Unit adjusts indicator brightness, which changes with ambient light. The Driver Display Unit also contains a small speaker that provides audible alert tones. The alert tones are sounded when the vehicle is closing on an object, or if an object is detected by the Side Sensor (not evaluated) and the turn signal is activated for a lane change. Additionally, the speaker provides informational tones relating to volume level, system failures, and Driver Identification Card related tones. For the FOT, the Driver Display Unit was mounted on top of the center dashboard in an area that is easily visible and accessible to the driver. For a portion of the FOT, the 20 Baseline vehicles were operated with the DDU deactivated. That is, no lights or tones were emitted by the DDU for the time that the vehicles were operated as Baseline vehicles. Nonetheless, during this time, the VORAD® system alerts were recorded on the DAS. Later in the FOT, the DDUs in the Baseline vehicles were activated. This was done to compare driver behavior with and without the VORAD® alerts.
Table 2.2-1. CWS Warning Levels
Alarm Type |
Alarm Level |
Alarm Lights Displayed |
Unsafe Driving Condition |
Audible Tone |
None |
0 |
None |
None |
No |
Detect |
1 |
Yellow |
Target in our lane, < Rangemax from host vehicle/object |
No |
Creep |
2 |
Yellow |
Target < 15 feet, closing, relative speed < -0.5 mph, host velocity < 2 mph |
Double Pulse1 |
2 to 3 Seconds |
3 |
Yellow, Orange |
Target in same lane, 2 to 3 second following interval, opening/closing, target < Rangemax, Host speed > 10 mph |
No |
2 Second, Opening |
4 |
Yellow, Orange |
Target in same lane, 1 to 2 second following interval, target velocity > 101% of host velocity, target < Rangemax, Host speed > 10 mph |
No |
1 Second, Opening |
5 |
Yellow, Orange, Red |
Target in same lane, < 1 second following interval, target velocity > 105% of host velocity, target < Rangemax, Host speed > 10 mph |
No |
2 Second, Closing |
6 |
Yellow, Orange, Red |
Target in same lane, 1 to 2 second following interval, target velocity < 101% of host velocity, target < Rangemax, Host speed > 10 mph |
Single Pulse1,2,3 |
1 Second, Closing |
7 |
Yellow, Orange, Red |
Target in same lane, < 1 second following interval, target velocity < 105% of host velocity, target < Rangemax, Host speed > 10 mph |
Double Pulse2,3 |
Stationary |
8 |
Yellow, Orange, Red |
Target < 3.4 mph, in same lane, within 3 seconds and target range is < 220 feet or Rangemax whichever is smaller, host speed > 10 mph |
Double Pulse2,3 |
Slow Moving |
9 |
Yellow, Orange, Red |
Target in same lane, within 3 seconds, target range < 220 feet or Rangemax whichever is smaller, and host vehicle velocity is 25% greater than target velocity, host speed > 35 mph |
Double Pulse2,3 |
½ Second |
10 |
Yellow, Orange, Red |
Target in same lane, < 0.5 second following interval, opening/closing, host speed > 10 mph |
Double Pulse2,3,4 |
Notes: |
1. |
Configurable on or off. |
||
2. |
Tone disabled in hard turns (< 750 feet radius). |
|||
3. |
Tone disabled with brake on. |
|||
4. |
Repeats constantly twice per second. |
|||
Audible tones as follows: In steady closing scenarios, tones occur once each, when the target crosses the threshold into the 2 second and 1 second zones. However, tones reoccur every time the target transitions from opening to closing if the target has opened for more than 2 seconds during a transition cycle. The following intervals can be modified based on the heading knob input. Tones that are not continuous shall only be sounded when the applicable alert level is initially entered. Once a tone has been sent, only higher-level alerts shall initiate new tones. The same or lower level tones shall be allowed after 2 seconds have elapsed since the previous tone was initiated (and the alert level drops to a lower level than the previous tone). |
||||
Figure 2.2-3. Driver Display Unit (DDU)
2.2.3. Adaptive Cruise Control (ACC)
ACC utilizes the CWS forward radar and conventional cruise control in a combined function. Eaton VORAD® SmartCruise® provides a driver convenience enhancement by maintaining a driver pre-set speed and following interval in relation to the vehicles ahead of and in the same lane as the host vehicle. When no vehicle is within the range of the radar ahead and in the same lane as the host vehicle, the system operates like conventional cruise control by maintaining the speed set by the driver. If the CWS radar detects a moving vehicle ahead of and in the same lane as the host vehicle, the ACC will maintain a pre-set following interval between the lead vehicle and the host vehicle. SmartCruise® allows the driver to pre-set the following interval between 2¼ and 3¼ seconds. For the FOT, the range set option was disabled, and the following interval was set at 3¼ seconds. ACC operation is illustrated in Figure 2.2-4. Table 2.2-2 shows the relationship of following interval in seconds and following distance in feet at various speeds.
Figure 2.2-4. ACC Operation Illustration
Table 2.2-2. Following Interval/Vehicle Speed/Following Distance Relationship

When the gap between the lead vehicle and the following vehicle increases, such as when the lead vehicle increases speed, the ACC will inform the engine electronic control module via the J1939 data bus to increase throttle and thereby increase the following-vehicle speed (up to the pre-set speed) to maintain the following interval. Conversely, when the gap between the lead vehicle and the following vehicle decreases, the ACC informs the engine electronic control to decrease the fuel supply to the engine, apply the engine brake, and downshift the automated transmission (if so equipped) to reduce the following vehicle’s speed and maintain the following interval. The ACC does not control the vehicle’s service brakes. Therefore, depending on vehicle load, road grade, and vehicle performance parameters, the deceleration activated by the ACC is limited to a range of between 0.1 g and 0.2 g. Driver intervention is required for rapid closing rates beyond the deceleration capabilities of the ACC as it is set up for the FOT. In the future, service brake application may be included in the scope of the ACC system, thereby allowing higher g decelerations and possibly complete stops.
2.2.4. Brake Systems
2.2.4.1.Drum Brake and Disc Brake System Differences
The majority of air braked vehicles on U.S. highways are equipped with drum type brake systems. An air actuated drum brake uses an S-shaped cam (S-cam) to rotate a pair of shoes with friction material in contact with the internal surface of a rotating drum. An air actuator (chamber) and lever (brake or slack adjuster) are used to rotate the S-cam shaft when the driver requests braking. A typical S-cam heavy vehicle drum brake is shown in Figure 2.2-5. The drum brake systems are known to have several inherent characteristics that affect braking performance, such as:
- drum expansion due to temperature changes,
- brake lining fade, and
- limited air chamber pushrod stroke reserve for emergency situations.
However, the S-cam air drum brake has provided many million miles of safe operation for many years. The desire to improve vehicle braking performance demands that these limitations be addressed.
Figure 2.2-5. Typical S-cam Drum Brake
(drum omitted for clarity)
(ArvinMeritor photo)
Many of these characteristic limitations are addressed by disc type brake systems, where the friction material contacts the external surfaces of a rotating disc. As with the drum brake, an air actuator and internal lever cause the friction material to press against the rotating disc in response to driver demand for braking. A typical air disc brake is shown in Figure 2.2-6.
Figure 2.2-6. Typical Air Disc Brake
(ArvinMeritor photo)
Heating of the rotor causes the rotor to expand towards the friction material, unlike the S-cam drum where heating of the drum causes the drum to expand away from the friction material. Thus the disc brake is not subject to many of the shortcomings of the drum brake.
2.2.4.2.Disc Brake Performance Advantages
Volvo Trucks North America undertook a series of tests in the late 1990s to understand the performance improvements offered by disc brakes and ECBS. These tests were made using the Volvo Duco series disc brakes, a brake being prepared for production in Europe.
The first test was made using a Volvo 6x4 VN tractor fitted with 375 mm rotor front brakes and 430 mm rotor rear brakes, which were controlled with a conventional pneumatic system with ABS. This test showed a 12% reduction in overall stopping distance when compared to a typical production Volvo 6X4 VN of the period, but more importantly demonstrated no brake fade in a series of 6 stops, and no in-stop fade. When tested to the FMVSS 121 requirement of at least one stop in less than 355 feet from an initial speed of 60 mph [ref. 4], the best stop was 216 feet, representing a 39% reduction from the FMVSS 121 requirement.
Based on this success, the brake system design was fine-tuned and the Volvo IVI project initiated.
2.2.4.3.IVI Disc Brake Platform Design
The Volvo disc brake platform for the Volvo IVI is a complete system design, in that the total wheel end was redesigned for disc brakes. The Volvo disc brake platform required unique axles, bearings, hubs, rotors, calipers, and air actuators to meet the Volvo quality, reliability, and performance requirements.
Brake Calipers
The Volvo Duco brake calipers are designed to maximize reliability. The caliper is based on a twin tappet adjuster design, which provides even contact pressure on the pads resulting in even pad wear across the friction surface. All components that potentially could be exposed to contaminant were made of corrosion resistant materials. The tappet shafts are normally rubber booted for protection, but the Volvo Duco includes secondary shaft seals and the previously mentioned corrosion resistant materials.
The Volvo disc brake platform consisted of the “C” sized Duco brake for the front axle, and a new “C+” (later D-LE) sized Duco brake for the drive axles.
The friction material was chosen to provide maximum life for both the pad and the rotors. Advances in friction material technology provided a material that meets both of these requirements and provides outstanding braking performance. As an example, the FMVSS 121 Dynamometer tests show the improvements in fade and recovery performance of the disc over the drum brake (see Figure 2.2-7). The lower pressure required by the disc brake to maintain the deceleration requirements show the disc brake is much less subject to fade than the drum brake.
Rotors
The Volvo design uses flat, ventilated rotors that attach to the hub through a splined attachment. This design concept reduces coning or warping that frequently occurs when hat shaped rotors are used. A unique metallurgy provides additional resistance to coning and cracking. The rotor diameters utilized were 375 mm and 410 mm for the front and drive axle brakes respectively.
Figure 2.2-7. Brake Power, Hot Stop and Brake Recovery Characteristics
Wheel Bearings and Hubs
The hubs and wheel bearings are unique to the Volvo product. The front and rear wheel bearings are unit-bearing construction. This wheel bearing provides maximum bearing life and reliability. Improved tolerances in the hub and bearing provide better control of rotor position within the brake caliper.
Actuators
The brake actuators or “chambers” are direct mounted to the brake caliper. Special seals around the output shaft are provided to prevent contaminants from entering the brake caliper.
2.2.5. Electronically Controlled Brake System (ECBS)
The ECBS used in the IVI vehicles is an integrated system combining an electronic control system for pneumatically actuated brakes, with a dual circuit pneumatic back up for safety. The ECBS system consists of the following:
Foot Valve
The foot valve incorporates position-sensing technology to determine the driver’s brake pressure demand. This generates a signal that is sent to the ECU. The foot valve also incorporates primary and secondary pneumatic valving for the backup pneumatic systems.
Single and Tandem Pressure Control Valve (PCV)
The single and tandem pressure control valves have similar designs. Each is connected to the ECU via a Controller Area Network (CAN) bus. The PCVs have electronics on board for communication with the ECU, and an electronically controlled relay valve for controlling airflow and pressure to the brakes. The PCV also performs analysis of wheel speed signals and antilock function if the wheel speed signals indicate wheel lock is occurring. The PCVs receive brake pressure demand from the ECU and activate the relay valve with closed loop pressure control. The PCVs are capable of providing air pressure to the brakes when in the pneumatic back up mode, and are fitted with valves that turn off the pneumatic back up mode when the system is functioning normally. The tandem PCV consists of two separate single PCVs in one housing. The tractor steer axle and drive axles are each fitted with a separate tandem PCV. A single PCV is used in the tractor’s trailer brake circuit to provide rapid application of the trailer brakes.
Electronic Control Unit (ECU)
The ECU provides the primary control of the ECBS. It performs several functions:
- System functionality: The ECU monitors all components for status and indicates faults as appropriate.
- Brake demand: Inputs from the foot valve indicate the driver’s demand for braking. The ECU interprets this demand and commands the pressure control valves to activate.
- Brake proportioning: The ECU calculates tractor and trailer loading based on tractor rear suspension air pressure, and proportions the brake load between the tractor steer axle brakes, the tractor drive axle brakes, and the trailer axle brakes accordingly.
- Brake wear indication: The ECU receives brake pad wear information from the brakes and notifies the driver if action is required.
2.2.6. Data Acquisition System
A means to record, store, and retrieve data was essential for this project. A modified version of the U.S. Army Aberdeen Test Center’s standard vehicle data acquisition system was developed by ATC for use in this FOT. The hardware is termed ‘IVI Data Acquisition System’ or DAS [ref. Appendix B-1]. This is a ruggedized computer equipped system with a battery-backup power supply, data collection inputs, flash disk storage, and an analog cell phone modem. The unit was installed in the cab of the FOT vehicles and operated without human intervention. It automatically transmitted collected data via the cell modem to a database computer, located in the Army Research Laboratory Major Shared Resource Center (MSRC) at the Aberdeen Proving Ground. The DAS was remotely configurable so that long term testing could be accomplished without interruption.
Data was captured based on several criteria. ‘Triggered Time Histories’ captured real-time data for a period of time that extended from 10 seconds before the trigger to 5 seconds after. Numerous trigger events were defined, based on potential driving conflict situations. Histogram data was captured any time the vehicle’s ignition key was on, and was intended to capture overall driving patterns and trends rather than any specific event. The data sources and parameters are listed in Table 5.1.1.
In addition to the DAS systems, video recording devices were installed in 6 of the Advanced Safety System equipped vehicles to capture the driver’s field of view during critical events. Critical event triggers, such as 0.5 second following interval, triggered video capture of 10 seconds before the critical event, and 5 seconds after the event. Video frames were captured synchronously with the data.
The data-gathering period of the FOT was to last for 2 years. However, due to various problems with vehicles and FOT related systems, which were compounded by the necessity for DAS modifications, the data acquisition period was extended. ‘Control’ vehicles collected data for 3 years, while ‘Test’ vehicles collected data for 2½ years.
2.3. Data Acquisition, Storage, and Preliminary Analysis (Overview)
Figure 2.3-1. IVI Instrumentation System Illustration
If a given vehicle was unable to establish the cell phone modem connection, the data was still preserved in the flash disk up to its capacity and was retrieved by physically accessing the DAS.
Due to the amount of data involved with the captured video, video data required manual intervention to retrieve. The video was stored on removable flash memory cards that were mailed to ATC and replaced with empty cards.
2.4. Analysis and Reporting (Overview)
The data residing in ATC’s MSRC database [ref. Appendix B-2] was accessible for monitoring and preliminary analysis through the Internet by FOT analysts that had obtained the required security clearances. The method for viewing retrieved data was an on-line database with Web-based tools and a graphical user interface. Preliminary data analyses indicated a need to modify some of the DAS parameters to obtain improved data quality or quantity. These modifications were made through the cell phone modem communication system integrated into each DAS box. Further ongoing data analysis indicated the need for additional DAS capabilities, which required physical exchange of the onboard data acquisition systems.
Remote monitoring and preliminary analysis provided the ability to detect trends, and to make changes early enough to resolve problems that arose during the course of the FOT.
3.0. PREPARATIONS FOR THE FIELD OPERATIONAL TEST
3.1. Planning and Scheduling
A great deal of planning and scheduling was required to coordinate activities among the various FOT partners and suppliers due to the number of vehicles in the FOT, the number of new components to be developed, and the verification and validation requirements of the new components and systems. Particular attention was devoted to the development of the DAS, the integration of the Advanced Safety Systems into the vehicles, and a comprehensive research plan.
3.1.1. Research Plans – Volvo and Independent Evaluation
A detailed Research Plan (Appendix A) was developed in conjunction with the Independent Evaluator (Battelle). The research plan identified a test plan for each objective, measures of effectiveness, data elements needed, and methods of evaluation.
3.1.2. Integration Plan for Advanced Safety Systems
Plans and schedules for the integration of the Advanced Safety Systems and Data Acquisition System into the 100 FOT vehicles were developed at the outset of the project. The plans and schedules covered specifications, design, development, design verification, system validation, manpower, component lead time, and vehicle build and delivery schedules.
3.1.3. Development Plan for Data Acquisition System
A detailed plan for the design, development, verification, validation, and production of the Data Acquisition System was created. Volvo developed a specification for the DAS based on the data requirements anticipated in the preliminary research plan. Subcontractors were pursued to supply the DAS for the FOT, as well as collect and store data in a dedicated database.
3.1.4. Training Plans for Drivers and Technicians
Since the Advanced Safety Systems installed on the Test vehicles were unique pre-production components, new maintenance and repair methods were required. Plans and schedules were created for the development of repair and troubleshooting documentation, as well as training for the maintenance technicians. Additionally, training plans and schedules were created for FOT truck drivers in order to familiarize them with the features and operation of the unique systems.
4.0. ADVANCED SAFETY SYSTEMS DESIGN, ACQUISITION, AND INSTALLATION
Formal detail, assembly, and installation drawings along with bills of material and engineering releases were created for the CWS, ACC, disc brakes, and ECBS. A unique rear suspension, special rear axle housing weldments, and unique front and rear axle hubs were designed. An adaptation of ATC’s standard vehicle data acquisition system was designed. Additional wiring harnesses were created to tie the DAS to the vehicle systems via the vehicle SAE J1587 and J1939 data buses and VORAD® V-bus. The Engineering Release of the above noted drawings and bills of material provided the information required to procure, manufacture, assemble, and install the Advanced Safety Systems on the production line at Volvo’s New River Valley, VA truck assembly plant, and install the DAS at a modification center adjacent to the Volvo truck assembly plant.
4.1. Control Vehicle Build, Delivery, and Preparation for Commercial Service
While the 3 initial Test vehicles were in the verification and validation process, the 50 Control vehicles were built on the production line at Volvo’s New River Valley production facility beginning in September 2000. They were put into US Xpress commercial revenue generating service during the November 2000 – January 2001 timeframe.
4.2. Baseline Vehicle Subgroup Identification and Preparation for Commercial Service
In order to evaluate the CWS effect on driver performance, 20 of the 50 Control vehicles were slightly modified and then designated as ‘Baseline’ vehicles. These were to be operated for a 6-month period with the CWS driver display and audible warnings deactivated. A CWS software change was required to allow the CWS to operate and record data with the driver display and audible warnings deactivated. Rounding up the 20 Baseline vehicles to install the special software proved to be difficult as 9 of the vehicles were already in service and spread throughout the country. The expected 6-month Baseline vehicle operational timeframe extended to 2 years.
4.3. Test Vehicle Build, Delivery, and Preparation for Commercial Service
The production of the 50 Test vehicles followed production of the Control vehicles beginning in January 2001. Test vehicles began entering US Xpress commercial service in June 2001.
4.4. Video Recording System Installation
Forward-facing video recording systems were installed in 6 Test vehicles in the July 2001 timeframe. Operation of the video recording system is described in section 5.2.4.
4.5. Driver Selection and Training
For the Control vehicles, experienced US Xpress drivers were rotated out of older tractors that were being processed out of the US Xpress fleet. Driver training for the Control vehicles consisted of normal US Xpress driver training combined with an explanation of the FOT and information on the DAS. Drivers were also informed that they would be periodically interviewed regarding their experiences with the Advanced Safety Systems. Since the CWS had been included in the entire fleet prior to the IVI FOT, driver training on the CWS for the FOT consisted of ensuring driver familiarity with the system.
Newly employed drivers for the 20 Baseline vehicles were selected based on their having zero experience with the CWS. Since the CWS driver display units were not activated in the Baseline vehicles, no CWS training was required for these drivers.
Driver training for the Test vehicles began as the new vehicles were put into commercial service. The training consisted of a description of the Advanced Safety Systems and in-vehicle training in the operation of the ACC system. No training was required for the disc brake or ECBS as their operation was no different than standard systems. Due to the turnover of drivers, which was greater than 100%, driver training continued throughout the FOT.
4.6. Technician Training
US Xpress Technician training was provided in mid-January 2001. Representatives from the 6 US Xpress maintenance facilities around the country were given Service and Repair manuals, and trained in the operation and maintenance of the Advanced Safety Systems (CWS, ACC, ECBS, and disc brakes). The technical sessions also covered the DAS and the unique rear suspension incorporated on the Test vehicles. A telephone hotline to Volvo service technicians was established to answer calls from dealer technicians not familiar with the Advanced Safety Systems.
5.0. DATA COLLECTION AND MONITORING
5.1. Onboard Data Acquisition System Parameters
The DAS captured data from several sources and stored it in formats as shown in Table 5.1-1.
Table 5.1-1. Data Acquisition System Parameters
Parameter Name |
Parameter Source |
Time History |
Histogram |
Metadata |
Count |
Vehicle Speed |
SAE J1939-Engine ECU |
Yes |
Yes |
||
Throttle Percentage |
SAE J1939-Engine ECU |
Yes |
|||
Brake Pedal Percentage |
SAE J1939-ECBS ECU |
Yes (only test vehicles) |
|||
Brake System Pressure |
SAE J1939-ECBS ECU |
Yes (only test vehicles) |
|||
Following Distance |
VORAD® |
Yes |
Yes |
||
Relative Velocity |
VORAD® |
Yes |
|||
Lead Vehicle Azimuth |
VORAD® |
Yes |
|||
Relative Acceleration |
VORAD® |
Yes |
|||
Yaw Rate |
VORAD® |
Yes |
|||
Driver Display Lights |
VORAD® |
Yes |
Yes |
||
Driver Display Audio |
VORAD® |
Yes |
Yes |
||
Lead Vehicle ID |
VORAD® |
Yes |
|||
Number of Vehicles |
VORAD® |
Yes |
|||
Service Brake Activation |
SAE J1939-ECBS or ABS ECU |
Yes |
Yes |
Yes |
|
Engine Brake Activation |
SAE J1939-Engine ECU |
Yes |
Yes |
||
Cruise Control Active |
SAE J1939-Engine ECU |
Yes |
Yes |
Yes |
|
ABS Status |
SAE J1939-ECBS or ABS ECU |
Yes |
Yes |
||
Ambient Temperature |
SAE J1939-Engine ECU |
Yes |
|||
Odometer |
SAE J1939-Engine ECU |
Yes |
|||
Steering Position |
Analog Sensor |
Yes |
|||
Lateral Acceleration |
Analog Sensor |
Yes |
Yes |
||
Longitudinal Acceleration |
Analog Sensor |
Yes |
Yes |
||
Vehicle Identification Number |
SAE J1708-Engine ECU |
Yes |
|||
Vehicle Fault Codes |
SAE J1708-All ECUs |
Yes |
|||
Time to Collision |
Processed |
Yes |
Yes |
||
Following Interval |
Processed |
Yes |
Yes |
||
Longitude and Latitude |
GPS |
Yes |
|||
Time and date stamp (GMT) |
GPS |
Yes |
|||
Video recording |
Video System |
Yes (6 vehicles only) |
5.2. Recorded Files
The FOT engineering analysis approach utilizes a number of key files collected over a 3 year period to reveal various effects of the major subsystems installed on the Volvo trucks. The files used in the analysis are described as follows:
- Histogram files
- Time history files (from which the conflicts are determined)
- Video files
- Abbreviated time history files
5.2.1. Histogram Files
Histogram files represent continuous periods of driving and encompass segments of mileage over a 3-hour period. Recorded within the histogram files are frequencies of occurrence by value of certain vehicle driving conditions, namely:
- Time to collision
- Road speed
- Following distance
- Following interval
- Longitudinal acceleration
- Engine brake usage
- Service brake usage
- Cruise control usage (conventional and adaptive)
- Brake pressure (test vehicles only)
5.2.2. Time History (TH) Files
Within the driving period of the histogram recordings, there are usually numerous triggered driving events, which represent potential driving conflicts. These driving conflicts are recorded as time history files, each of which lasts 15 seconds each time triggered driving conditions occur. Triggers were designed to coincide with possible conflicts and record the triggered period – a 10 second buffered period prior to the trigger event plus 5 seconds after the trigger event. The triggers utilized to initiate time history data recordings are shown in Table 5.2.2-1.
Table 5.2.2-1. Time History Triggers
Description |
Conditions Required to Trigger Data Collection |
Longitudinal Acceleration |
> 0.25 g with service brakes applied |
Lateral Acceleration |
> 0.20 g |
Steering Rate |
Steering Wheel Rotation > 120o per second |
Kinematic Motion Equations |
Calculated value from real time algorithms utilizing CWS range, relative velocity, relative acceleration, speed, and other parameters that initiated data acquisition when a specified value was exceeded for a minimum of 0.67 seconds (ref. Appendix E) |
Time to Collision (TTC) |
< 4 seconds as calculated from the CWS range and relative velocity parameters (continuous for 0.67 seconds) |
Following Interval |
< 0.5 seconds as calculated from CWS range and road speed (continuous for ½ second) |
Anti-lock Brake System (ABS) active |
Active ABS parameter from the J1939 data bus |
Recorded channels of data within the final configuration of the time history files are as follows:
- Time
- VORAD® relative acceleration
- VORAD® yaw rate
- VORAD® azimuth
- Brake pedal %
- Acceleration pedal %
- Road speed
- Brake pressure
- Following distance
- Relative velocity
- Longitudinal acceleration
- Lateral acceleration
- Steering position
- DDU display update message
- Cruise control state
- Brake status
Using this data, each valid time history file has been classified into one of 5 driving conflict scenarios. Further subsystem analysis is used in order to analyze safety effects for different kinematic situations.
5.2.3. Video Files
Video data was utilized to visualize critical events as well as to correlate the critical events and their resolution to the numerical data recorded by the DAS. Video recording boxes were provided by ATC and recorded video in a compressed digital format to solid-state flash disks. Video recordings were initiated by a DAS trigger event, the ½-sec following interval trigger, and captured 15 seconds of video (10 seconds prior to the event, and 5 seconds after the event). Due to budget constraints, only 6 of the 50 Test vehicles were equipped with a video camera and a video capture box.
The video recordings were retrieved manually when the vehicle arrived at the US Xpress depot, mailed back to ATC, and then decompressed and distributed. The video clips were also integrated with the database so that video and data could be viewed simultaneously. Using video files, lane changes and cut-ins by lead vehicles can be clearly observed. While there were a small number of videos compared to the other digital data recorded, there were enough to construct lane change, turn, and cut-in algorithms for use with the time history files.
5.2.4. Abbreviated Time History (ATH) Files
In order to identify vehicle operating conditions whenever the CWS issued an audio warning, an additional event file was implemented midway during the FOT. This is the ATH file. A record in the ATH file is generated when the audio tone bit changes state on the V-bus. An ATH record is a snapshot of all of the time history variables as well as a smoothed longitudinal acceleration value. The ATH data files created are synchronized with histogram files. Abbreviated time history and video files are used to derive warning frequency. These files can be used to supplement the time history audible warnings.
5.3. Advanced Safety Systems Durability and Reliability Data
The Advanced Safety Systems durability and reliability data were obtained from the warranty reports compiled by Volvo for the 100 FOT vehicles [ref. Appendix J]. Since US Xpress had purchased extended warranty coverage for the vehicles in the FOT, all vehicle repair costs were captured in the Volvo Warranty System. The total mileage utilized for normalizing Repair Frequency and Repair Costs is larger than the mileage accumulated while the DAS was onboard since most of the FOT vehicles remained in US Xpress service after the DAS was removed from the vehicle. The combined Control and Test vehicle total mileage used for durability and reliability calculations (through December 31, 2003) was approximately 39 million miles as compared to 31 million miles the FOT vehicles accumulated with the DAS onboard.
5.4. US Xpress Maintenance Data
US Xpress maintenance costs for the FOT vehicles were captured in the US Xpress Fleet Assist system. These included costs for normal preventative maintenance, routine repairs, and road service for breakdowns. These maintenance costs do not include repair costs that were chargeable against the Volvo Warranty system. Since these costs include charges for breakdowns not related to equipment malfunctions, e.g., road hazard damage repairs, no direct durability or reliability conclusions can be reached.
5.5. US Xpress Accident and Incident Data
The US Xpress Safety Department compiled accident and incident information on the 100 FOT vehicles [ref. Appendix H]. Specifically, an “accident” involves a collision between the subject vehicle and another vehicle or object. An “incident” generally is a non-impact type event such as landscape damage or a trailer disconnect. The reports are broken down further into “preventable” and “non-preventable” events. Preventable events are those in which a determination was made that the driver failed to do everything reasonable to prevent the event from happening. These events were defined using U.S. Department of Transportation, American Trucking Association, and National Safety Council guidelines. Additionally, the reports include information regarding CWS interaction and driver injuries.
5.6. Volvo Brake System Component Wear Data
In order to determine and compare the projected life of brake system wear components, measurements of brake shoes and drums, as well as brake pads and rotors, were required after the vehicles had accumulated significant service mileage [ref. Appendix I]. Near the end of the data-gathering segment of the FOT, individual vehicles were brought in to have the DAS and other instrumentation removed. At the same time, the wheels were removed and brake system wear components were measured. Component measurements were recorded by the wheel position and associated with the vehicle serial number, vehicle accumulated mileage, and measurement date. A total of 26 Control vehicles (with drum brakes) and 46 Test vehicles (with disc brakes) were measured.
5.7. Selected FOT Vehicle Operating Statistics
The FOT presented the opportunity to collect millions of miles of naturalistic operational data from various vehicle systems running in commercial revenue generating service throughout the contiguous United States. The data gathered by the DAS were stored in the MSRC IVI database. Queries were written to interrogate the database and generate summary data for each FOT vehicle [ref. Appendix G]. Examples of data obtained include the number of brake applications per mile, the percentage of miles run with cruise control operating, the percentage of run time with following interval less than 0.5 seconds, and the number of collision warning alarms per mile. See Appendices D and E for a description of the queries and data generated.
5.8. Driver Interviews
Driver interviews were conducted by the Independent Evaluator (Battelle) to determine driver opinions regarding the Advanced Safety Systems. Results [ref. 1] were reported in October 2004.
5.9. Data Monitoring
The DAS units were designed to download data to the Aberdeen Test Center computer via cell phone communications when the vehicle was stationary. Soon after the first vehicles were put into US Xpress service, sporadic cell phone modem data download problems were noted. Additionally, some of the recorded data parameters needed to be changed. This necessitated the retrieval and exchange replacement of DAS units in all of the FOT vehicles. DAS exchanges were made at the US Xpress Tunnel Hill maintenance facility when FOT vehicles were in for normal maintenance or repairs.
At various intervals, the independent evaluator (Battelle) reviewed the status of the data collected and stored at MSRC. Generally, a large amount of data appeared not suitable for some of the safety benefits analysis due to flawed sensors or incomplete data. As a result of the data problems identified by Battelle, a parallel data status review was commissioned. PAR/Rome Research Corporation was contracted to review the collected data, verify and validate the data, and perform an analysis. In some cases, previously unusable or corrupted data was salvaged by determining the underlying cause, and making corrections. Due to time, funding, and contractual constraints, corrupted data that required extensive efforts to salvage were not pursued and therefore not included in the analysis. The cleansed database consists of 10.20 million VMT, 237,811 THs, 57,707 histograms, and 36,180 ATHs.
5.9.1. Vehicle History File
A vehicle history file [ref. Appendix F] has been constructed from histograms and other data to determine the operational status of each of the 100 vehicles during the entire FOT as a function of time and as a means of insuring data integrity. Some of the data contained in the vehicle history file is as follows:
- Vehicle VIN
- Vehicle type (Baseline, Control, or Test)
- Recorded mileage by calendar date
- Mileage gaps
- Odometer anomalies
- Incomplete data mileage
- Complete data mileage
- Baseline to Control upgrade
- DAS configuration change
6.0. DATA ANALYSIS
6.1. Approach
The IVI Volvo FOT Engineering Analysis is centered on the Eaton VORAD® collision warning system (CWS), the adaptive cruise control (ACC) system, and the Volvo disc brakes with electronically controlled brake system (ECBS) installed in Test vehicles. These units are referred to as the Advanced Safety Systems. Special emphasis is given to analysis of the CWS and its effect on drivers in the presence of the Advanced Safety System units.
The CWS gives information to the driver via displays and sounds while the ACC controls the following interval between the Test truck and any vehicle ahead. It is important to determine the impact and usefulness of the CWS and ACC on the driver-in-the-control-loop both with and without the operation of any other interacting systems. The primary approach for this analysis was to isolate discernable safety effects of the CWS and ACC systems due to the fact that representative driving scenarios are rather infrequent and make up only about 14% or less of the analyzable driving scenario population derived after data reduction. It is absolutely essential to evaluate this smaller set of comparable driving situations with each other, rather than the data population as a whole, in order to isolate the individual safety effects. The Collision Prevention Boundary (CPB) analysis method is the primary approach (see Section 6.8) to this evaluation. In the CPB method a consistent comparison that objectively represents the driver response and driving conflicts is used.
It is also essential to evaluate comparable driving situations with each other for differently equipped vehicles in order to isolate the individual safety effects. To effectively implement this type of system isolation, the vehicles were configured in three distinct ways for the FOT: Baseline, Control, and Test vehicles, defined as follows:
- Baseline vehicles were a 20-vehicle subset of the 50 Control vehicles. Baseline vehicles were equipped with conventional cruise control (CCC), the CWS (operational for recording data but not giving any warnings to the driver), and drum brakes.
- Control vehicles were equipped similarly to the Baseline vehicles with the exception that the warning system was operational in order to record data and provide audible and visual warnings to the driver. Near the end of the FOT, Baseline vehicles were “converted” to Control vehicles to isolate the effect on the drivers’ reactions after adding the CWS warnings to the individual units.
- Test vehicles had equipment differences from Control vehicles in the form of ECBS, disc brakes, and ACC.
To evaluate the CWS alone, Control and Test vehicle data is selected where the truck has not activated cruise control. CCC and ACC are evaluated with CWS and ECBS operating normally only when cruise control is activated. Combined or Bundled effects use all of the data together regardless of which systems are operating.
6.2. FOT Data Reduction
Considering the magnitude of the data collected, manpower available, and cost considerations, a data reduction process was employed to derive a set of time history data that was truly representative of the FOT driving results. Due to time constraints, any data that was suspect for various reasons was not utilized (but was retained for possible future examination). That data usually resulted from the following:
- Data collected due to failed sensors
- Data from non-threatening targets
- Data from follow-on time histories
- Data from time histories with receding targets
This reduced data set still represents a large enough sampling of naturalistic driving practices to be statistically meaningful. See Figure 6.2-1 for a schematic representation of the data reduction process.
Figure 6.2-1. Data Reduction Flow Chart
Flawed data (from failed sensors) was flagged so as not to be considered in any analyses. Non-threatening targets were flagged and were not considered for driving conflict analyses. Follow-on and receding target time histories were filtered and eliminated as well when selecting time histories for conflict analysis. Non-threatening and receding target time histories were used in determining non-threatening alarm rates and the effectiveness of the CWS.
The FOT data collection effort amassed 105 GB of raw data, which is stored in an Oracle database. This includes the additional file space required for database indexing and auxiliary files. File counts in the database amounted to the following (shown graphically in Figure 6.2-2):
- Time Histories 1,549,447
- Histograms 222,482
- Video Files (matched to time history files) 250
- Abbreviated Time Histories 36,180
- Diagnostic Files 515
Video files were used to validate the kinematics of time history files for such situations as lane change, cut-ins, receding targets, and driving conflicts.
Figure 6.2-2. Distribution of File Types in IVI Database
6.2.1. Sensor Failure Identification
Four types of sensor failures were observed during the FOT:
1) Accelerometer (fore/aft and lateral) failures
- Were indicated by large constant accelerations.
- Caused continuous time history recordings.
2) VORAD® CWS failures
- Were indicated by a constant value in the target range data.
- Resulted in no time history recordings based on CWS-related triggers, and no CWS CWS-related histogram data.
3) CANBUS failures
- Were indicated by an ambient temperature reading of –273 degrees F.
- Absent data elements, such as road speed, etc.
4) Steering sensor failures
- Were indicated by erratic or constant steering data.
Files with flawed sensor data were flagged in the database; additional flags were determined for histograms with duration or mileage out of range. Histograms and time histories were associated based on the date/time of recording. If a histogram (or time history) was flagged, the associated time history (or histogram) was also flagged. Table 6.2-1 shows occurrences of sensor faults.
Table 6.2-1. Failure Statistics for Flawed Sensors
Failure Mode: |
Accelero-meter |
CANBUS |
VORAD |
Steering Sensor |
Total |
Flag # |
1 |
2 |
3 |
4 |
|
# Histogram Files |
172,757 |
172,757 |
172,757 |
172,757 |
172,757 |
# Flawed Histograms |
2,675 |
8,059 |
6,079 |
7,711 |
24,524 |
% Flawed Histograms |
1.5% |
4.7% |
3.5% |
4.5% |
14.2% |
# TH Files |
811,762 |
811,762 |
811,762 |
811,762 |
811,762 |
# Flawed THs |
87,533 |
10,041 |
12,340 |
188,865 |
298,779 |
% Flawed THs |
10.8% |
1.2% |
1.5% |
23.3% |
36.8% |
6.2.2. File Associations in the Database
In order to properly determine event statistics based on recorded mileage, histogram and time history files were “associated” (co-referenced) based on date and time of recording. If a time history file did not have an associated histogram, it was flagged accordingly (as an “orphan” time history) and not used for conflict analyses. Histograms without associated time history files were not flagged, as it is possible that no trigger events occurred during the histogram recording time. Abbreviated time history files were also associated with histogram (and time history) files in the same manner.
6.2.3. Non-Threatening Radar Returns
The Eaton VORAD® radar is designed to detect and track vehicles which may be potential collision threats to the host vehicle. Time histories were also recorded when VORAD® detected a target that did not in fact represent a driving conflict. These “non-threat” time histories were determined and flagged accordingly. All time histories were interrogated to determine whether the critical target in the time history was a threat. While VORAD® does track multiple targets, one such target is designated as the critical target. The critical target was defined as the VORAD® target present when the time history trigger condition was met.
Six types of radar targets – short presence, stopped target, out of lane target, crossing lane target, high lateral acceleration target, and target with no driver reaction – were designated and identified as non-threatening targets as defined below.
Type 1 – Short presence target
- Target that is present (being tracked) for a very short period of time. Criteria for short presence varied depending on whether the target was stopped or moving:
- Stopped critical target (|VL| < 4 fps): present < 1 sec.
- Moving target: present < 2 sec.
Type 2 – Stopped or oncoming target on curve
- Stopped or oncoming critical target defined as VL < 4 fps.
- Curve condition: following-vehicle yaw rate > 2 deg/sec for > 3 sec continuously
Type 3 – Out of lane target
- Stopped critical targets only.
- Out of lane condition is defined as the condition when the lateral distance to the critical target from the projected following-vehicle path > 2 ft for all points during critical target presence.
- While the 2 ft criterion appears small, this was determined empirically from time history video/data sets.
Type 4 – Crossing lane target
- Stopped critical targets only; note, target apparent (relative) velocity is used here.
- Crossing lane criteria: Critical target is out of lane for > ½ sec to one side of the lane at the start of presence, and out of lane for > ½ sec to other side at the end of presence.
Type 5 – High lateral acceleration target
- Stopped critical targets only.
- High lateral acceleration condition is such that the FV must perform an unreasonably high lateral steering move in order to avoid the target. Since this acceleration is unreasonable, the target must have been non-threatening.
- Required Angle:

where: qR is the required angle, TW is half the vehicle width (4 ft), R is the range, and qAz is the azimuth angle.
- Turn Radius:

- Required lateral acceleration:

where VF is the FV velocity and g is the force of gravity (32.2 ft/sec2).
- If the required lateral acceleration exceeds 0.4 g for > ½ sec during the Critical Target presence, then the target is considered to be a high lateral acceleration non-threat target.
Type 6 – No driver reaction (conditions)
- Stopped critical targets only.
- For reaction to be considered, it must occur after the time point at which the critical condition began.
- If the critical target is stopped and none of the following driver reactions occur, then the critical target is a non-threat target.
- Brake application or following-vehicle deceleration requirement – service brake is applied or the following-vehicle deceleration exceeds 2 ft/sec2 (0.0625 g).
- Decrease in acceleration pedal – several ranges of acceleration pedal changes.
- Lane change – lane change by the following vehicle.
If any of the above non-threat target conditions are determined to be true, then the time history was considered to be a non-threat event and flagged accordingly in the database. There is no hierarchy or precedence of one non-threat target type over another. A definition summary for non-threatening targets is shown in Table 6.2-2.
Table 6.2-2. Non-Threat Target Types and Criteria

6.3. Data Audit Results
In order to properly account for all time histories in the database, all of the defined criteria for flawed data and non-threatening targets were applied, counted, and identified. The results are given in the Table 6.3-1. Note that type 0 targets are considered threat (conflict) time histories.
6.3.1. Follow-On Time Histories
Follow-on (FO) time histories are two or more time histories that occur in succession. This happens because trigger conditions persist from the first time history beyond the period 0 to +5 seconds of the first time history. Whenever this condition occurs, follow-on time histories will be generated. Follow-on time histories are not of particular interest for general analysis, as they do not represent a new driving conflict other than the original conflict. Follow-on time histories are therefore not used in the conflict analysis; only the first of a series of time histories is of interest in the analysis of conflict resolution.
Table 6.3-1. Target Types and Statistics

Identification of follow-on time histories was done by observing the time history date/time stamps, which were separated by 15 sec ±1 sec. The critical target from the preceding time history continues into the following-time history. Typically, the time history trigger time occurs prior to t=0 sec in follow-on time history(s). An example of a series of follow-on time histories is shown in Figure 6.3-1. Following- and lead-vehicle velocities and range are plotted vs. time over 2 consecutive time histories.
Figure 6.3-1. Follow-On Time History Example
6.3.2. Receding Targets
A receding target is defined as a lead vehicle (critical target) pulling away (positive range rate) from the vehicle following the critical time, TCrit. This sort of target may cause a trigger without causing a driving conflict. Thus, a time history will be recorded but is again of little interest from a threat and safety standpoint. The conditions used to identify receding targets are as follows:
- Range rate > 0 for > ½ second following TCrit
- Receding targets are typical of a cut-in where the lead vehicle is accelerating
- Result is that the time history is not representative of a conflict condition
Three examples of time histories with receding targets are shown in Figure 6.3-2 where the following- and lead-vehicle velocities and range are plotted vs. time. Also shown is cruise control usage (1st plot) and service/engine brake (3rd plot). All 3 cases show the critical target appears (range drops from infinite to small value), followed by a steadily increasing range.
Figure 6.3-2. Receding Target Time History Examples
On the basis given above, follow-on and receding target time histories were identified and summarized. Table 6.3.2-1 shows the resulting number of time histories used for conflict analysis after removing those containing follow-on targets and non-follow-on receding targets. Figures are broken down by vehicle group. Also shown is the normalized number of time histories. Normalization is obtained by dividing the counts by Vehicle Miles Traveled (VMT) for each vehicle group.
6.4. Relative Frequency of Time Histories and Driving Conflicts Used for Analysis
Figure 6.4-1 shows counts and rates (counts per VMT) of time history generation for each of the three CWS-related triggers (see Table 5.2.2-1) and by vehicle group. It should be noted that there was somewhat less Baseline data than Control or Test; however, the rate of time histories is roughly the same over the 3 vehicle groups. It has been observed by US Xpress management and/or theorized that Baseline drivers, being relatively new to the USX fleet, may have a tendency to drive more conservatively in an aggregate sense. This may be reflected in the data results herein.
Table 6.3.2-1. Number of DAS2 THs for Analysis

Figure 6.4-1. Time History Counts by Primary Trigger Type and Vehicle Group
6.5. Driving Conflicts
A major feature of this analysis is the use of five (5) distinct driving scenarios/conflicts. These are derived from pre-collision conditions as identified in the GES [ref. 2] database. The determination of the type of conflict is made from an examination of each of the usable recorded time history files similar to those shown in Figure 6.3-2. Each time history conforms to one type of driving conflict but is recorded based on pre-defined trigger conditions. At the time of trigger and the recording of a time history, the CWS radar is tracking one or more targets. The object of interest is termed the “critical” target; and the driving conflict definitions are based on the critical target characteristics as recorded during the tracking period. These five driving GES-type scenarios/conflicts for the truck driver are defined in Table 6.5-1.
The purpose of conflict categorization is to identify appropriate triggered events into specific types of potential rear-end collision types and thus provide a logical structure for further analysis. Analyses of driving risks can also be further categorized as to how they relate to the 5 rear-end collision types which is shown in the Combined (Bundled) Analysis Section. All 57,550 time histories were analyzed and categorized according to the calculated conflict type using this structure.
Table 6.5-1. Rear-End Pre-Collision Conflict Types
Conflict Type |
FV Lane Change Prior to Critical Point |
Following-Vehicle Speed |
Lead-Vehicle Speed |
|
1 |
Constant velocity for both vehicles |
No |
Constant |
Constant |
2 |
Either a decelerating or constant speed lead vehicle and a decelerating following vehicle |
No |
Decelerating |
Constant or Decelerating |
3 |
Lane change by following vehicle and constant velocity for both vehicles |
Yes |
Constant |
Constant |
4 |
Stopped lead vehicle |
No |
Constant or Decelerating |
Stopped |
5 |
Decelerating lead vehicle |
No |
Constant |
Decelerating |
The definition table shows the 5 conflict types used based on the following conditions:
- Following- and lead-vehicle conditions (constant velocity, decelerating, or stopped)
- Lane change before critical point
- Constant velocity condition: absolute value of deceleration < 2 ft/sec2 during critical period; note that the constant velocity condition also includes an accelerating vehicle (deceleration < -2 ft/sec2)
- Decelerating condition: deceleration > 2 ft/sec2 at any point during critical period
- Stopped condition: absolute value of velocity < 4 ft/sec during critical period
From a practical standpoint, a conflict is presented to a driver when a vehicle cuts in front of the driver’s vehicle, when a short following interval is experienced, or a high closing rate with the vehicle ahead is experienced. When any of these situations occur, the driver often can foresee how the situation will develop and act accordingly. For instance, if a following vehicle’s driver is planning to leave the roadway via a nearing exit ramp, the following vehicle may come quite close to a vehicle ahead and then pull off of the highway onto the ramp. Similarly, a lead vehicle may be slowing and signaling to exit onto a ramp and again present the following vehicle a short-term conflict situation, which is resolved by the exit action. Thus, with many short-term conflicts a driver may take no action at all and the situation will be resolved during the normal course of driving. Nonetheless, it is convenient to use the conflict structure to discuss driving conflicts.
It can be seen that conflict type 3 is identical to conflict type 1 except for the fact that the host vehicle makes a lane change prior to the critical point. In addition, conflict types 1, 2, and 5 could be cases in which the lead vehicle changes lanes prior to the critical period. Regardless of the absolute speed considerations, relative speed is also considered in that the lead vehicle is either receding from or closing with the following vehicle. For this analysis, any cases of a receding lead vehicle will not be considered as a conflict.
Under the combined effects analysis (see Section 6.15) the frequency with which all three tractor configurations encounter these five conflicts is determined for all subsystem analysis combinations. Differences in the safety equipment performance effects of each of the subsystems are itemized by the analysis.
6.5.1. Conflict Counts by Vehicle Group
Table 6.5.1-1 shows overall statistics for conflict types excluding follow-on and receding target time histories; and Figure 6.5.1-1 delineates these by vehicle group for the remaining time history files.
Table 6.5.1-1. Conflict Type Statistics

Again, there was somewhat less Baseline data than Control or Test, however the rate of time histories is roughly the same over the 3 vehicle groups.
Figure 6.5.1-1. Conflict Type Counts and Rates by Vehicle Group
6.6. Time History Pre-Trigger and Post-Trigger Perspective of Time Histories
After the removal of all types of data that were not pertinent for this analysis, the database was assessed for frequency of occurrence of various important actions of the truck drivers and the systems. These are conditions that occur during a trigger event before the driving conflict is apparent such as cruise control usage, possible lane change, and warning given to the driver.
Pre-trigger conditions of audible warning issuance and cruise control action are important for conflict analysis. Post-trigger reactions of braking, lane change, or cruise control braking (ACC only) are also evaluated. Table 6.6-1 summarizes these parameters for the analyzable database for each of the three vehicle groups.
Table 6.6-1. Pre- and Post-Trigger Counts by Vehicle Group

The pre-trigger period corresponds to -10 sec to 0 sec. Pre-trigger conditions generally correspond to pre-conflict conditions. Post-trigger is 0 sec to +5 sec for a total of 15 sec. Driver reactions generally occur in the post-trigger period and usually take place just before or after warning (which typically occurs at approximately the trigger point). Note in Table 6.6-1 that individual time histories may contain combinations of the pre- and post-trigger conditions listed; thus, each row cannot be simply added to get the total number of time histories for each vehicle, trigger, and conflict type combination. The right-most column (“All”), however, shows the total number of time histories for each combination of vehicle, trigger, and conflict type.
6.7. Warning Counts
An inconsistent rate of recorded VORAD® warnings was observed in the IVI database in that many audible warnings appeared not to have been recorded. This problem was initially identified in the version of software as installed in the Baseline vehicles where the VORAD® warning status was not present on the VORAD® data bus. However, this inconsistency was observed on both Control and Test vehicle recordings as well. In order to evaluate this problem, the ten VORAD® warning levels were calculated (based on the kinematics of each time history) and compared to time history cases where warnings were recorded in order to determine accuracy of the calculations. The DAS recorder groups the 5 audible warning levels into two groups – denoted as Warning 1 (relating to VORAD® audible condition 6) and Warning 2 (VORAD® conditions 7-10). Warning 1 is somewhat cautionary in nature while Warning 2 is indicating a collision threat [ref. Table 2.2-1].
Figure 6.7-1 shows the degree of correlation of the calculated vs. recorded warnings for both types of warnings. The charts show correlation of recorded to calculated VORAD® warnings for both types 1 and 2. Comparison shows the time difference between the occurrence of the first warning as calculated and recorded. Both show a peak at 0 seconds error, and rapidly fall off to either side. The strong peak at Dt = 0 sec shows that the calculated warnings are indeed valid. Both cumulative probability distribution[1] (CPD) curves show that approximately 70% of calculated warnings coincided within ±2 sec of the respective recorded warnings. Considering other potential differences (e.g., latency, noise, etc.) between calculations and recordings, this was deemed to be satisfactory for analysis purposes. Since there was a high rate of unrecorded warnings across the database time histories, calculated warnings were used in the analysis for this report.
Figure 6.7-1. Correlation of Recorded and Calculated VORAD® Warnings
6.8. Methods of Evaluation of Rear-End Driving Conflicts
The net effect of this safety equipment was determined in part by analysis of relevant individual triggered driving conflicts from the FOT. Since each driving conflict is analyzed relative to safety, it is important to know both the degree of the safety threat, the driver response to the threat, and the final result of the response. It has been shown [ref. 6] that time-to-collision at braking (TTCb) is an effective indicator of degree of the threat before the driver responds to the threat. The referenced paper develops an analysis approach to rear-end driving conflicts termed the Collision Prevention Boundary (CPB) method that outlines a method of assessing the response as well as an estimate of the result of the response. In the CPB method, use is made of the following-vehicle response to the conflict by determining the deceleration level and time delay of the response to a set of initial driving conditions for the driving conflict. The initial conditions of the driving conflict define a CPB curve of response time vs. deceleration level; and the time delay and braking level can be plotted with respect to the CPB curve. Responses on each side of the CPB curve represent either collisions or safe responses. It has also been shown that the CPB curve is most sensitive to the lead-vehicle deceleration; and CPB curves can exist for the two major groups of lead vehicle decelerating (LVD) and lead vehicle constant speed (LVCS). Thus, TTCb reflects initial conditions before the driver response to the conflict; and the driver response is compared via braking level to the CPB curve.
Thus, a driving threat will cause a response by the truck driver to brake, change lanes, or some combination of both responses. After the truck driver response of a braking action and/or a lane change at a certain time after TTCb is ascertained, the value of the estimated closest approach (ECA) is determined. ECA is proportional to the length of a normal line to the CPB curve; and is an effective measure of the result of the driver response to the threat posed [ref. 6]. ECA reflects the combination of time delay of the driver to react to the conflict as well as the level of braking taking into effect any braking by the following or the lead vehicle. If ECA is zero or negative, then a crash is predicted; and if ECA is positive, the driver response predicts the avoidance of a crash. In order to calculate the variable ECA, the start time of deceleration of the lead vehicle and following vehicle as well as the deceleration levels of each must be known. Knowledge of the start of deceleration for the truck will also permit calculation of the response time of the driver.
Response time is defined as the elapsed time between a reference time (such as the time of an audible warning or the start of the driving conflict scenario) and the time that the truck driver or the ACC takes an action to remove or resolve the conflict. These values – deceleration values, deceleration start times, and response time - are all obtained using a process of simultaneously finding a best linear fit to seven dynamic parameters recorded in the time history file that describes the driving conflict. This process is termed “Time History Optimization” (ref. Appendix C-1). Thus, each time history will be optimized and assessed as to the pre-collision conditions, the driver response, and the result of the response.
6.8.1. Time to Collision at Braking (TTCb): Pre-Driver Response/Pre-Collision Conditions
In this analysis, TTCb is defined as the interval of time between the initiation of a deceleration reaction (braking by the truck driver or ACC system) until the time when a collision with the lead vehicle would have occurred had nothing happened to avoid a crash. If TTCb is small (4 sec. or less), risk of a crash is relatively high; and if TTCb is large, risk of a crash is relatively low. TTCb is calculated based on the kinematics of the driving situation at the time of the deceleration reaction and on the assumption that no deceleration reaction had occurred previously. Equations for calculation of the variable TTCb are given in Appendix C-2.
6.8.2. Driver Response
The driver response to a conflict may be a lane change, braking, or braking with a lane change. The exact driver response itself will vary depending on the driving conditions and the choices made by the driver. The response point may be compared to the CPB curve in effect at the initiation of the driving conflict. For driving conflicts where the risk is high, deceleration might be higher and/or earlier than for conflicts where the risk is low. The two types of driver responses considered in this analysis are deceleration due to braking and lane change by the following vehicle to effectively remove the lead vehicle from the conflict. The time that both of these actions take place must be determined. Thus, it is hypothesized that a time delay of the driver response to a warning might be short and that the braking level might also be altered with a warning. In comparison with a very similar driving situation where a warning is not given to the driver, response time should be higher with commensurate changes in braking level.
6.8.3. Estimated Closest Approach (ECA): Result of the Driver Response
ECA is a measure of how close the driver came to a crash after responding to a driving conflict. When a lead vehicle and the following vehicle brake at a constant level, they will both stop at some point. The ECA is defined as the projected minimum distance that will exist between the lead vehicle and the following vehicle when they stop or as they pass from a closing situation to a receding situation. ECA is directly proportional to the distance from a CPB curve. Thus, ECA is the net effect of the driver response to the conflict. In order to accurately compute ECA, determination must be made as to which vehicle stops first if both are braking. If the lead vehicle stops first, there will be a point at which the two vehicles either collide or come to their minimum separation when the following vehicle stops. When the following vehicle stops first, ECA will be the separation of the two vehicles when the lead stops. If the two vehicles are considered to be virtual vehicles, then the following vehicle could possibly proceed to pass through the lead vehicle and stop at some negative value of ECA beyond the lead vehicle. Thus, ECA will be computed as negative or zero values, where either just hitting or passing through by the following vehicle is predicted. Negative ECA constitutes a collision. Such values of ECA indicate that the driver did not react sufficiently to avoid the collision but something else prevented the collision.
There is also the possibility that a driving conflict may be resolved even though a negative or zero ECA is computed. One example is when a following vehicle is approaching an exit ramp and continues to close on a lead vehicle for a few seconds, but then the action of the lead vehicle turning off the roadway onto the ramp while the following vehicle proceeds in a straight line eliminates the threat altogether. A negative ECA may thus be projected but a collision does not actually occur due to action of the lead vehicle. The closest approach in such cases would conceptually be the smallest distance prior to the lead-vehicle turn-off. In the subsequent analysis herein, however, the calculated ECA value is used for consistency except in Sections 6.15.3, 4, and 5 for combined effects analysis.
Negative or zero ECAs may result from rather benign driving situations as represented by the following examples:
- Following vehicle approaches a lead vehicle then changes lanes or turns;
- Lead vehicle changes lanes or turns after the following vehicle approaches;
- Following vehicle changes lanes after a lead vehicle has cut in to avoid a crash.
Three examples of time histories similar to Figure 6.3-1 that exhibit these respective situations and a negative ECA are illustrated in Figures 6.8-1, 2, 3.
Figure 6.8-1. Following Vehicle Changes Lanes and Avoids Predicted Crash
In this time history, both vehicles are decelerating at -10 sec. at approximately 0.11g. The truck initiates a lane change and lets off of the brakes at -2 sec. when the Range between the two vehicles is about 100 feet and Range Rate is -2.3 feet per second. The truck completes the lane change at approximately +1 sec. losing radar track of the lead vehicle at that time. Computed ECA for the encounter is -60.9 feet predicting a crash which was avoided by the lane change of the truck.
Figure 6.8-2. Lead Vehicle Turns Avoiding a Predicted Crash
Here the truck hits the brakes at approximately -5 sec. at a Range of 210 feet when encountering a slower moving lead vehicle that also began to brake at -5 sec. at 0.12g. Range rate is initially -8 feet per second. The truck ceases to brake at -2 seconds but does not change lanes maintaining a constant velocity of 50 ft./sec. from -2 sec. thru =0.33 sec. Track on the lead vehicle, however, is lost at +0.33 sec. indicating a lane change or a turn off by the lead vehicle. Anticipation of this lead vehicle turn-off was indicated by the truck driver at -2 sec. when truck braking ceased. The computed ECA for the encounter was -84.5 feet predicting a crash. That predicted crash did not occur due to the fact that the lead vehicle disappeared (turned out of the truck lane) at a Range of 140 feet.
Figure 6.8-3. Truck Changes Lanes After Lead-vehicle Cut-In
In this final scenario the truck has already begun to brake at 0.11g apparently anticipating a lead vehicle cut in at -9.67 seconds at which time Range is about 90 feet. The lead vehicle decelerates after cutting in as well at about 0.11g. The truck ceases to brake and initiates a lane change at -2 sec. moving at a velocity of 50 feet per second. Lead tracking is lost at zero seconds upon completion of the lane change by the truck. ECA was computed at -13.9 feet in this scenario predicting a possible crash; but the crash did not occur due lane change by the truck.
Equations for calculating the ECA variable are given in Appendix C-2. The most critical driving conditions occur when 0<ECA<10 feet. Such conditions clearly indicate a braking response by the truck to a conflict where a crash was narrowly avoided. It is in this ECA region where the safety equipment is expected to make the biggest difference.
6.9. Optimization of Time Histories
A plot of some variables from a typical time history is shown in Figure 6.9-1. This shows an example of some of the kinematic variables recorded in a time history:
- Following and lead-vehicle velocities (dark blue and red)
- Following distance or range (dark green)
- Large range values (R>350 ft) indicate no target is being tracked
- Service and engine brake conditions (light blue and yellow, resp.) – on/off
- Cruise control state (light green) – on/off
- Target switches are indicated by step changes in range and/or lead-vehicle velocity
- Target switches are important in order to detect and track presence of the critical target; a target switch is seen in Figure 6.9-1 at approximately t=3 sec as denoted by the large jump in both range and lead vehicle velocity
An automated process called parameter optimization [ref. 3] was implemented in order to analyze each of the recorded time history conflicts consistently and efficiently.
Figure 6.9-1. Typical Time History
Optimization of FOT time history files consists of a process to find a “best fit” of the primary kinematic variables recorded at a rate of 6 per second for the time history. This is convenient due to the number of variables involved and the fact that the variables are continuously changing over the entire time history of 15 seconds.
The seven time history variables fitted to linear equivalents are:
- Following vehicle: initial velocity, time of braking, and deceleration
- Lead vehicle: initial velocity, time of braking, and deceleration
- Initial range
Time and level of lead- and following-vehicle braking are also derived. Numerous other variables are computed for analysis based on optimization; and TTCb and ECA are derived as well from the optimization process.
Time histories in general usually represent driving conflicts where the two vehicles are closing for some reason. Optimization assumes that any lead- and following-vehicle decelerations can be represented by a constant value beginning at a specific time and ending at a specific time during the course of the time history. The output of performing this mathematical process is a single line of data that completely describes the time history event [ref. 3]. In the case of the FOT data, a number of other variables such as ECA and TTCb were calculated and added to the output summary line.
The input variables to the optimization process from the recorded time history are lead-vehicle velocity, following-vehicle velocity, and the distance (range) between the lead and following vehicles. These data were derived from the recorded variables of range, range rate, and following-vehicle velocity. Additional input processing steps derived the lead and following-vehicle deceleration values as a function of time using a five-point regression technique.
The best fit derived by the optimization process involves variation of the deceleration levels and start times for the lead and following vehicles to achieve a suitable match of the velocity and range variables over the optimization period. A start time is chosen to begin the optimization as well as an end time. During the optimization period a lead vehicle must be present which dictates the choice of the start and stop times. Optimization is an iterative mathematical process that assumes certain values (initial guesses) of deceleration levels and deceleration times while calculating a parameter termed SSE (sum of the square of the error). SSE computes the difference between the dependent variables of velocity and displacement of the two vehicles from the input recorded values. Optimization acts to minimize SSE.
The actual optimization processing used for FOT data has been refined to two steps. The first step fitted the following-vehicle velocity curve alone to values of initial velocity, deceleration, and start of the deceleration. Following-vehicle velocity is the most reliable data recorded which was the rationale for this step. Lead-vehicle velocity is derived from following-vehicle velocity and range rate. A second optimization step is then performed on the lead-vehicle velocity and range similar to the first optimization step. An SSE value is calculated for both steps to determine the relative value of the optimization process. An optimization algorithm internal to Microsoft Excel is used to determine the point of diminishing returns for the process.
Outputs of the optimization consist of the final values of lead- and following-vehicle constant-deceleration values are calculated as well as the start times of those decelerations. In addition, lead and following-vehicle velocities, range, range rate, and lead- and following-vehicle displacements at the start of the optimization process – otherwise termed as time zero – are determined. A number of other variables are computed or derived and added to the output summary line to assist the total analysis effort.
Figure 6.9-2 shows an example of time history optimization of recorded FOT data. This is the same data as the example shown earlier (Figure 6.9-1). The top left plot shows following and lead-vehicle velocities (blue and red, resp.). Actual velocities are shown as thin lines, and optimized velocities shown as thick lines. Blue and red dashed lines indicate the point at which each
Figure 6.9-2. Example of Time History Optimization
vehicle applied a braking action (either applied brakes or otherwise decelerated). The top right plot shows actual and optimized plots of vehicle distance traveled and range (green). The bottom left plot shows actual and optimized decelerations. The bottom right plot shows actual and optimized range vs. range rate (phase plot). In order to produce these results, optimization uses a two-part linearization to model the continuously varying kinematics of the time history.
6.10. Relationship of Methods of Evaluation to Optimization
As has been described, TTC is computed based on current position of the lead vehicle and the following vehicle as well as their predicted positions if the following vehicle does nothing to prevent a collision, i.e., does not react (see Appendix C-2). TTCb therefore is a measure of driving conditions at the instant that the following-vehicle driver does react by braking for the conflict. Small TTCb is considered high risk inasmuch as a short time exists until a collision could occur. Larger TTCb results in a lower risk situation using the same reasoning. For two driving scenarios where TTCb1 is lower than TTCb2, and where TTCb1 poses more of a risk than TTCb2; TTCb2, gives the following-vehicle driver a longer time to react to the risk than in the scenario producing TTCb1.
When comparing one or more driving scenarios using TTCb, inasmuch as TTCb is a function of time, it is useful to define a new function called risk reduction, which is also a function of time, RR. In the case of TTCb1 and TTCb2 posed above, RR is the difference in the likelihood of a driver beginning to brake at a larger value of TTC:
Risk Reduction (RR) = P(TTCb1>t) - P(TTCb2>t) = CPDTTCb1 - CPDTTCb2
where CPDTTCb represents the cumulative probability distribution of the TTCb function for a number of time histories. The value of RR is positive if the probability of TTC being a certain value at t is greater for condition 1 than it is for condition 2, i.e. at value t, CPD1-CPD2 > 0.
Figure 6.10-1. Notional CPD and Risk |
Similarly, estimated closest approach (ECA) will be used to derive a comparative estimate of the ECA improvement between two types of vehicles for comparative situations after a driver has reacted to a conflict by braking and/or steering. ECA is computed based on the current positions, velocities, and decelerations of the vehicles as well as the following-vehicle driver’s reaction to avoid a collision (see Appendix C-2). ECA is the projected closest distance that the two vehicles are projected to come to each other. The comparative estimate to be used with ECA is defined as the ECA improvement. Thus, ECA is a projection of the final “safe” driving situation after the following-vehicle driver reacts to the conflict. Consideration is given to the driving kinematics to determine which vehicle would stop first in the equations of C-2.
- Low values of ECA (10 feet or less) represent predicted near collisions that are unsafe, whereas larger ECAs represent a final wider separation in range and, therefore, a safer reaction.
- Negative ECAs are possible, but may be benign if either the following- and/or lead vehicle changed lanes in order to avoid a collision as described in paragraph 6.8.2.
From an analysis standpoint, ECA can be considered in a similar manner as TTCb discussed above. In Figure 6.10-1, if the x-axis was ECA and y-axis was “Probability & ECA Improvement,” the CPD curves (blue and red) would represent ECA calculations for two sets of conditions, again without and with a safety system, and the ECA Improvement curve (yellow) would represent the difference in the CPD curves. Thus, the ECA improvement of CPDECA2 relative to CPDECA1 is defined as the difference of the CPD values across the ECA span:
ECAI = P(ECA1 > x) - P(ECA2 > x) = CPDECA1 - CPDECA2
Thus, ECA improvement will be used to give an estimate of the net change in the final outcome of the driver reaction for one set of driving conditions over another.
6.10.1. TTCb and Risk Reduction
Figure 6.10.1-1 shows TTCb probability density and cumulative probability distribution (CPD) curves for each conflict type in the reduced database. Recall that the five conflicts types are briefly described as,
- Closing with constant velocity,
- Closing with both vehicles decelerating or with lead at constant speed,
- Closing preceded by following vehicle lane change and constant velocity lead vehicle,
- Closing on stopped lead vehicle,
- Closing with decelerating lead vehicle.
Recall also that TTCb is a measure of risk level presented to the driver by the conflict where lower TTCb indicates a higher risk. To drive safely, drivers should keep TTC as high as possible on average so that there is plenty of time to react to any emergency ahead. Ideally, then, for safer driving the distribution curves for a conflict type should stretch out to the right indicating that most of the TTCb values are relatively high. Conversely, unsafe or risky driving is indicated by a distribution curve where the TTCb values lie between 0 to 4 seconds. Thus, the least safe curves of conflict performance would be to the left and the safest curves would be to the right.
The probability density curves for TTCb are obtained by normalizing the respective conflict frequency curves (left plot in Figure 6.10.1-1). Conditions for each curve can be compared by observing the relative CPD at a given value of the independent variable, in this case TTCb. As shown in the right plot in Figure 6.10.1-1, conflict type 4 (stopped vehicle) represents the highest risk condition for FOT drivers, followed by conflicts 2 and 5 with types 1 and 3 representing similarly lower risk conditions. Conflict 3 is basically the same as conflict 1 with the exception that the truck makes a lane change prior to encountering a lead vehicle.
As to the general pattern of truck driver braking (dF) relative to TTCb, comparison was made of following vehicle or truck braking level, dF, to TTCb for the FOT as a whole. It is expected that as TTCb increases, dF reactions would approach zero. Likewise, if TTCb approaches zero, dF would need to approach infinity in order to prevent a crash. Figure 6.10.1-2 displays this overall result for the FOT data when pure deceleration is involved in the conflict resolution, i.e. there is no cruise control action and no lane change as a driver reaction. The exact mathematical relationship derived from regression analysis is shown in the figure. It can also be observed from the right hand axis of Figure 6.10.1-2 that well over 95% of the dF values are less than 0.25 g which can be considered hard braking.
Figure 6.10.1-1. TTCb Frequency and Cumulative Probability Distribution (CPD)
by Conflict Type
Figure 6.10.1-2. Relationship of Time to Collision and Deceleration
6.10.2. ECA Improvement
Similar to the previous TTCb plots, density and distribution curves are shown for positive ECA in Figure 6.10.2-5 for all conflicts regardless of cruise control usage or lane change. ECA is the measure of the predicted net result of the driver braking reaction to a driving conflict. If a driver brakes early at a severe level, a relatively high ECA will be calculated; and if a driver brakes late (e.g. TTCb < 4 sec.) and at a low braking severity level, a relatively low ECA will be calculated. High ECA indicates a large resultant margin of safety; and low ECA indicates a smaller resultant margin of safety after the driver reaction. Note that an ECA of 0 (zero) indicates that the following vehicle will just touch the lead vehicle at its closest approach. A negative value of ECA indicates that a collision is expected, requiring either the following or lead vehicle to change lanes in order to avoid the collision.
Review of types of ECA results is given in Figure 6.10.2-1 and 2. Section 6.8.3 explains the origin of negative values of ECA in some driving events and provides justification for not including these events in further analysis. Therefore, our primary focus is on the CPD values where ECA >= 0 ft.
ECA occurs when Range Rate is zero. In order to visualize this idea with ECA, it is convenient to generalize conflicts 1, 3, and 4 as lead vehicle constant speed (LVCS) and conflicts 2 and 5 as lead vehicle decelerating (LVD) as time histories. Idealized time history plots of LVCS and LVD situations are shown in Figure 6.10.2-1. Corresponding plots of Range Rate and Range (or trajectories) for both cases are shown in Figure 6.10.2-2.
Figure 6.10.2-1. Idealized Time Plots
Figure 6.10.2-2. Corresponding Idealized Trajectory Plots
Considering the case of the LVCS plots, the ECA point in time results when Range Rate equals 0 and ECA > 0 at roughly 90 ft. as a safe response avoiding a crash. In the LVD plot, when Range Rate equals zero, Range will be negative resulting in a negative ECA and a projected crash. This shows two typical cases - for LVCS, the truck driver would have braked with excess margin and have avoided a crash; and for the LVD case the truck would have braked insufficiently resulting in a crash. In summary, Figure 6.10.2-3 shows three possible ECA variations for LVCS rear-end conflict trajectories.
Figure 6.10.2-3. Three Sample LVCS Trajectory Variations
The three LVCS trajectories shown in Figure 6.10.2-3 illustrate typical aspects of the ECA concept as related to idea of crashes and non-crashes. In the “Crash” trajectory ECA is -125 ft. when Range Rate is zero, i.e. ECA < 0 predicting a crash. For the “No Crash” trajectory, ECA is 90 ft. when Range Rate is zero; and finally, for the “Touching” case, ECA is zero when Range Rate is zero. In all three cases the following vehicle braked at the same time during the time history but at different levels such that three different results were produced-crash, touching, and no crash.
An important aspect of the three types of driver responses may be viewed for LVCS and LVD cases with respect to the Crash Prevention Boundary (CPB), as shown in Figure 6.10.2-4a and 6.10.2-4b, where the initial driving conditions are the same. These figures show the no-crash 10-foot danger zone adjacent to the CPB along with three driver responses with respect to the LVCS case. It can be seen that if the kinematics of the driving conflict were changed to LVD where dL=0.1g or 0.2g, both the tFb (the instant in time when the following vehicle applies the brakes) and TTC no-crash areas are reduced. The driving situation thus is more dangerous for LVD with similar initial conditions; and the three driver responses of Figure 6.10.2-4a (tFb vs. dF) become crashes. Likewise of the three driver responses of 6.10.2-4b (TTC vs. dF), for LVD at least two of the responses would result in crashes. This illustrates the effect of driving kinematics on the crash/no-crash boundary and the possible different responses required of the driver in similar situations.
The perpendicular (normal) distance from the CPB to the driver response point is directly proportional to ECA. Driver responses on the crash side of the CPB represent negative ECA values while driver responses on the no-crash side of the CPB have positive ECA values.
The “safe”, i.e. no-crash, driver responses shown for LVCS represent an ECA of approximately 50 feet or more. Safe responses such as these do not represent real crash threats as they are a long distance from the CPB. A “danger” region exists along the CPB where ECA < = 10 feet
and is also shown in Figure 6.10.2-4a and 6.10.2-4b for the LVCS CPBs. This danger zone represents an area where the CWS needs to make a difference to prevent crashes and near misses; and the danger region is always in a region where ECA > 0.
Therefore, a data selection criterion where 0 < ECA < 10 feet will be used to focus the CWS analysis on responses where the danger region of the CPB is definitely highlighted.
Figure 6.10.2-4a. Sample Brake Time CPBs with Driver Responses
Figure 6.10.2-4b. Sample Time to Collision CPBs with Driver Responses
Consistent with the discussion of paragraph 6.8 the situations where lead-vehicle action resolves the conflict are really not germane to this analysis. Restricting the analysis of driving conflicts to cases where the following-vehicle action resolved the conflict with emphasis on the danger region is a reasonable way to determine CWS effects. To do this, the time history data should be confined to ECA predictions of positive values alone (ECA > 0) since there were not a significant number of crashes in the FOT. In this light, Figure 6.10.2-5 depicts the ECA profile where the following vehicle alone resolved the conflict, ECA as calculated is positive, cruise control is not used, and lane change is not a maneuver. The relative ECA values for each conflict type are as seen in relation to one another in Figure 6.10.2-5. It can be seen that conflict type 4 has the highest percentage of points in the danger region of the CPB than the other conflicts, followed by conflict 2.
Figure 6.10.2-5. ECA Frequency and CPD by Conflict Type (Filtered and ECA>0)
Thus, conflicts 4 and 2 are the most difficult for drivers, while the other conflict types are resolved with less difficulty in the CPB danger zone.
6.11. Systems Analysis Considerations
When considering potential deployment of safety systems, it is important to understand the quantitative improvement, if any, of each of the separate systems used in the IVI Volvo FOT. The various subsystem considerations and the analysis conditions used herein are given below.
- Rear-End Collision Warning System (CWS) – independent of the cruise control systems
- Cruise Control Systems – with and without warnings
- Driver Reactions – with and without warnings
- Individual Effects – variation in measurements and driving characteristics by individual tractor
- Combined (Bundled) System Effects – risk and safety with all systems working simultaneously
6.11.1. Rear-End Collision Warning System (CWS)
Design of the Eaton VORAD® CWS is based on providing warnings of progressing severity. The primary intent of design of the Eaton VORAD® CWS in the FOT configuration is to modify driver behavior to maintain a safe following interval. Drivers are influenced as to what following interval is safe as a result of driving a VORAD® equipped vehicle. The system then continues to work to notify the driver when following too close – and it ceases to provide alerts once the driver is beyond a 3 sec following interval. In effect, the system is constantly working to get the driver to increase the following interval when he/she is following too close – driver behavior modification.
The severity of the warning depends on the severity of the driving conflict as defined by Eaton VORAD® and shown in Table 2.2-1. Low level warnings consist of lights and progress to audible warnings for more severe driving conflicts. The most severe warning is repeating double audible warnings every ½ second.
The CWS analysis will consider that:
- Baseline vehicles did not have VORAD® providing warnings (audible or visible) to the driver.
- Control and Test vehicles did have audible warnings.
- Effectiveness of the CWS is thus performed by comparing Baseline vehicles to Control and Test vehicles.
The available data consists of 57,550 time histories that were used in the CWS analysis (Baseline: 6,711; Control: 24,965; and Test: 25,874). The distribution of conflict type for these events is presented in Table 6.5.1-1.
6.11.2. CWS Driving Effects Analysis
CWS risk evaluation was performed by calculating TTCb for the three vehicle types and then comparing TTCb values between CWS unequipped vehicles (Baseline) with CWS equipped (Control and Test) vehicles. Risk analysis is followed by ECA analysis. The cumulative values of risk reduction (using TTCb) and ECA improvement (as defined in Section 6.10) are shown in Figures 6.11.2-1 and 6.11.2-2, respectively for conflicts where cruise control operation and lane change did not occur.
Initial comparison showed little or no difference between vehicle types when compared this way. Shown in Figure 6.11.2-1, TTCb curves line up very closely across the 3 vehicle groups. For this data, cruise control was selected to be off, lane change was not a following vehicle response to a driving conflict, and ECA was greater than zero. Thus, only manual driving performance is used in the comparison. These constraints avoid any ambiguity between the different CC systems or driver responses other than braking within the various vehicle groups.
Figure 6.11.2-1. CWS Risk Reduction Based on TTCb
Figure 6.11.2-2. CWS ECA Improvement Based on ECA
ECA overall comparisons (Figure 6.11.2-2) showed 40% ECA improvement within the range of 0 to 10 feet with a non-improvement in the range of 10 to 30 feet. At ECA distances beyond 30 feet there is not much change in ECA improvement indicating a more detailed analysis was in order.
Consistent with the CPB analysis approach of [ref. 6], lead-vehicle deceleration, dL, as calculated from the optimization process, is the most sensitive parameter for making the needed comparisons to determine the individual effect of the CWS using TTCb and ECA. Emphasizing dL correlates with the use of driving conflict initial kinematic conditions used in previous studies. Using dL as a parameter for comparing driving conflicts, time history samples were grouped by ranges of dL values (0.08, 0.10, 0.12, 0.15, 0.18, and 0.21g varied ±0.02g around each dL value) to make comparisons. In doing this, approximately 85% of the time histories with low levels of dL were excluded from the analysis. Next, TTCb, dF, and ECA comparisons were made. Relative to the definitions given in Section 6.10, the following normalized measures of improvement are used for this analysis:
Risk Red. = {CPD(TTCbBase) - avg.[CPD(TTCbCtrl), CPD(TTCbTest)]}/ CPD(TTCbBase)
Decel. Imp. = [CPD(dFBase) – CPD(dFCtrl or Test)]/CPD(dFBase)
ECA Imp. = {CPD(ECABase) - avg.[CPD(ECACtrl), CPD(ECATest)]}/ CPD(ECABase).
As a result, a larger difference was found between Baseline vs. Control and Test vehicles at higher dL levels. This is shown in Figure 6.11.2-3 (TTCb Comparisons), Figure 6.11.2-4 (dF Comparisons), and in Figure 6.11.2-5 (ECA Comparisons). Summary comparisons for all three variables over a wide range of dL values are also shown in Figure 6.11.2-6.
TTCb comparisons of Figure 6.11.2-3 show a trend of generally greatest risk reduction in the range of TTCb from 1 to 3 seconds. Improvement is greatest at higher dL levels and when TTC is less than 3 seconds. Drivers have a greater likelihood of braking earlier (more safely) with the CWS equipped truck than without it in this region. TTCb less than 3 seconds is a critical area for the following vehicle. If the following vehicle driver brakes earlier due to the CWS warning as is indicated, then there is a positive safety effect. This positive effect is most noticeable when lead braking is 0.15 or greater. Thus the CWS appears to have the most positive effect when the risk of a crash is greatest.
Braking levels (the variable dF) by drivers were evaluated whether or not a warning was issued in this analysis. This takes into effect any driver behavioral modifications that the CWS may have caused. In Baseline vehicles, while a warning may have been indicated by driving conditions, it was never heard by the driver. This eliminates any possible effect of the CWS for Baseline. However, the warning would have been heard in the Control and Test vehicles. As in the previous comparisons for TTCb and ECA, the dF comparison was made for situations without cruise control and no lane change as part of the truck driving maneuver so as to isolate the safety effect, if any, to the CWS alone. Figure 6.11.2-4 shows the effect on driver braking considering various initial dL conditions as well as the absence of cruise control use and any effect of steering as part of the driver response. Based on results shown in Figure 6.11.2-4 the braking response shows no significant improvement but is instead about the same with or without the CWS. The axis to the right on each plot is the degree of braking improvement between Baseline, Control, and Test trucks.
Likewise, the ECA comparisons shown in Figure 6.11.2-5 using the same segments of lead braking ranges show that the quality of the truck driver response is improved for the general range where 0 < ECA < 10 ft.; otherwise there is not much improvement. In summary the greatest ECA improvement takes place when lead-vehicle braking is highest for a truck equipped with CWS equipment vs. one that is not equipped with CWS. This appears to be a positive effect by the CWS on driver behavior to mitigate driving conflicts.


Figure 6.11.2-3. CWS TTCb Risk Reduction at Various dL
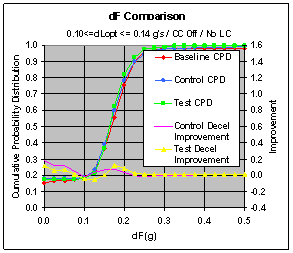
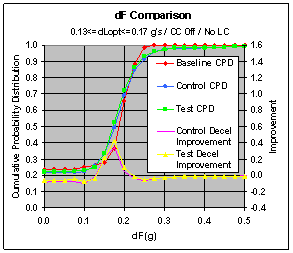
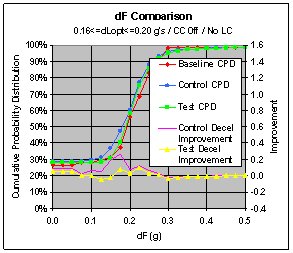
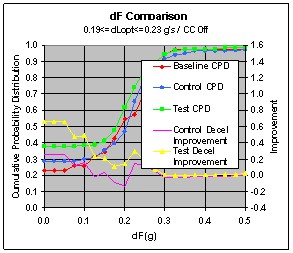
Figure 6.11.2-4. Effect of the CWS on Driver Response at Various dL

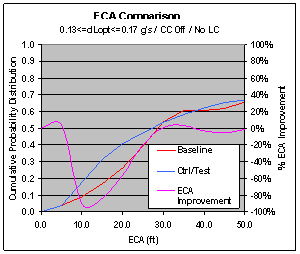
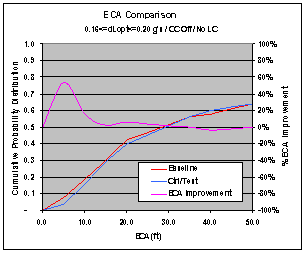

Figure 6.11.2-5. CWS ECA Improvement at Various dL
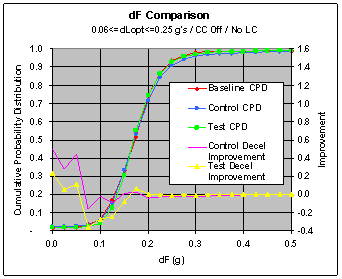
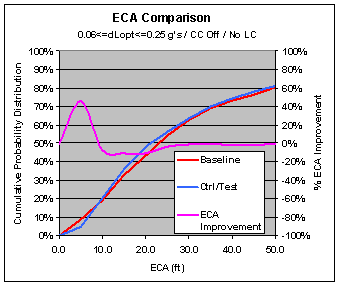
Figure 6.11.2-6. Summary Effect of the CWS for Wide Range of dL
Figure 6.11.2-6 summarizes the three variables, TTCb, dF, and ECA for a wider range of dL (0.06 g < dL < 0.25 g). It can be seen that over this wider range of lead deceleration that for high risk situations (where 0 < TTCb < 3 seconds) a maximum risk reduction of 20 per cent is achieved. Deceleration Improvement effectively shows no net change as some improvement at small braking levels is offset at higher braking values. ECA Improvement shows a maximum of 40 per cent in the CPB danger zone of 0 < ECA < 10 feet. This is slightly offset for higher ECA values that are not within the danger zone of the CPB.
6.11.3. CWS Driving Effects Analysis Summary
Figures 6.11.2-3 thru 6.11.2-5 compare CWS risk reduction, deceleration improvement, and ECA improvement for similar segments of lead-vehicle deceleration (dL). Risk reduction at low values of dL (0.06g < dL < 0.13g) is slightly negative or very small. At higher ranges of dL (0.14g < dL < 0.23g) there is positive risk reduction of more than 50 per cent. Deceleration improvement does not change a great deal with the variation of dL for the range considered. ECA improvement is positive and amounts to as much as 50 per cent over the full range of dL considered.
This indicates that CWS-equipped drivers are responding to conflicts more safely overall than non-CWS-equipped drivers at more threatening levels of lead vehicle deceleration. High-risk reduction in driving conflicts shows that drivers with CWS equipment will be able to react sooner in a conflict situation. This results in about the same level of braking as CWS-equipped vehicles approach a decelerating lead vehicle. However, the rather high levels of ECA Improvement for CWS equipped vehicles means that the earlier average driver response results are safer than without CWS.
Thus, it is observed that the lead-vehicle condition that puts the driver into a driving conflict situation definitely affects the type of response the driver makes as well as the result. If a warning is heard, the driver tends to be more alert to discerning the critical driving situations at hand. Where the risk reduction of the conflict is high, the drivers of Control and Test vehicles apparently do not need to brake harder than drivers in Baseline vehicles but do brake earlier and therefore produce a significant, projected ECA improvement in the CPB danger zone.
6.11.4. CWS Warning Credibility
Consideration must be given to the fact that it is also important to look at the relative performance of the two recorded warning types for the CWS. When a driver hears a warning, it is either a warning from a target that is a threat or a target that is a non-threat. Threat targets would be any type of moving or stationary vehicle within the same lane of the vehicle. Non-threat targets would typically be stationary objects out of the same lane as the vehicle. The relative importance that the driver intuitively assigns to a warning when he hears it signifies the warning’s credibility. This is a subjective quantity termed the credibility factor. The credibility assigned to an audible warning will vary from driver to driver.
Credibility assigned in a specific case by a specific driver is highly subjective; and due to that fact, the performance of the CWS warning credibility will be examined as a probability that either a threat or a non-threat warning will occur based on data collected from the FOT. Subjectivity is also a result of the fact that the driver is privy to a great deal more information than the radar has. The driver will intuitively evaluate the situation based on all the available information. The warning data from the FOT are presented in Table 6.11.4-1. (Note, for Baseline vehicles, warnings were not actually presented to the driver.)
The individual probability of occurrence of each of the warning types is shown in Table 6.11.4-2. These are computed on the basis that both of the warning events (counts) are given by the equations:
Probability of warning for a threat: ![]()
Probability of warning for a non-threat: ![]()
where C refers to the number of counts,
i refers warning type 1 or 2 (Wi refers to warning 1 or 2), and
T and NT refer to threat or non-threat, respectively.
In the above equations, the numerator refers to the number of counts where a warning (1 or 2) was given for the particular target condition (threat or non-threat), while the denominator is the total number of counts for that warning. Warning counts include counts where only the specific warning occurred (1 or 2) plus those where both warning 1 & 2 occurred. Note, also, that the equations do not include those counts where no warning occurred.
Table 6.11.4-1. Warning Occurrences by Vehicle Type and Threat Type

Table 6.11.4-2. Probabilities for (a) Warning 1 (left) and (b) Warning 2 (right)

Likewise, Figure 6.11.4-1 graphically depicts the values in Tables 6.11.4-2 (a) and (b). Two observations may be noted from this data. First, the probability of a warning from a non-threatening target is greater than from a threatening target for both warning 1 and warning 2. Second, the probability of a warning 2 occurring from either a threat or a non-threat target is higher than the probability of a warning 1 occurring (as noted in by the relative quantities of warning 1 and 2 instances in Table 6.11.4-1). This latter observation, however, may be an artifact from the DAS triggering logic in that triggers are more “tuned” to warning 2 conditions than warning 1 conditions. A warning 1 may indeed have occurred for many of the time histories but actually occurred prior to the beginning of the time history time span. Alternatively, a driving condition may have actually skipped over the warning 1 condition, such as occurs during a lead-vehicle cut-in. Thus, fewer warning 1 recordings were acquired.
Figure 6.11.4-1. Warning 1 & 2 Probabilities from Threat and Non-Threat Targets
In addition, the ratio of threat to non-threat warnings (1 or 2) from a non-threat target is lowest for Baseline compared to Control and Test, while Control and Test are about the same. This characteristic may be in part due to more conservative driving habits of the Baseline vs. Control and Test drivers. The occurrence of warnings (1 or 2) for threat targets is about the same for all three vehicle types. The ratio of threat warnings to non-threat warnings indicates the chance of a particular warning given as being credible. This is shown in Figure 6.11.4-2 and is an indication of the credibility one might assign to a given warning. Of course, the Baseline drivers hear no warnings; but the data indicate the occurrences nonetheless. For warning 1, credibility is lowest for Baseline and about the same value (0.25) for Control and Test. For warning 2, Baseline is again the lowest while Control and Test for warnings are about 15% higher in credibility. Thus, there appears to be a high number of non-threat warnings that might concern some drivers depending on their particular viewpoints. Control and Test vehicles are by far more favorable in this aspect than Baseline vehicles. Again, Baseline characteristics may be due to driving habits.
Figure 6.11.4-2. Warning Credibility
6.11.5. Allocation of Warnings by Radar Target Path
In consideration of warnings for threats and non-threat targets it is desirable to know the orientation of the non-threat warnings relative to the following-vehicle path. There are three categories of immediate interest for warnings:
a. In Following-Vehicle Lane – the target is always in the same lane during approach by the following vehicle. Lead-vehicle-accelerating cases were removed from this count, leaving the following three cases for consideration:
- Lead-vehicle-decelerating case
- Lead-vehicle-at-constant-speed case
- Lead-vehicle-stopped case
b. Out of Following-Vehicle Lane – the target is never in the same lane during approach: typically these warnings are due to stationary objects such as signs, posts, overpasses, etc.
c. Transitional to Following-Vehicle Lane – the target is in the same lane for a short time and then passes out of the lane.
Relative distribution of these three categories from FOT data is shown in Figure 6.11.4-3.
Figure 6.11.4-3. Distribution of CWS Warnings by Path Orientation
6.12. Cruise Control Systems
Drivers using cruise control instinctively know that their “next reaction” will be to change lanes with cruise control on or to brake in order to increase the gap between the following and lead vehicles. Drivers will often make this decision independently of the warning system, even though one exists, based on their perception of the driving threat. Other drivers will tend to rely more on the warning system and cruise control system if it exists. As to the cruise control equipment used:
- CCC equipment on Baseline and Control vehicles is not integrated with the CWS or other controls, and maintains a set speed determined by the driver.
- ACC equipment on Test vehicles uses the Eaton VORAD® CWS to determine following interval and maintain a fixed following interval or gap. If no target is acquired by the radar system, ACC maintains the speed set by the driver identical to CCC.
Preliminarily, it is expected that drivers will increase following interval slightly when using cruise control to allow for more flexibility in action time. Baseline and Control vehicle drivers will either disengage the CCC function and/or apply brakes to revert to manual control. For Test vehicle drivers, ACC will automatically decelerate the vehicle but the driver may also apply brakes to disengage. The net result may be that vehicles will maintain a longer following interval when using cruise control. Table 6.12-1 shows the makeup of the reduced database for cruise control (shown graphically in Figure 6.12-1).
Table 6.12-1 shows that there were many more time histories with manual driving than with cruise control active: ratio of approximately 2.5:1 for Baseline and approximately 7:1 for Control and Test vehicles. The data are indicative of lower cruise control use, particularly by Test vehicles. Note, this is not representative of overall driving with cruise control active, but rather this represents cruise control usage during conflict conditions.
Table 6.12-1. Available TH Data for Cruise Control Analyses
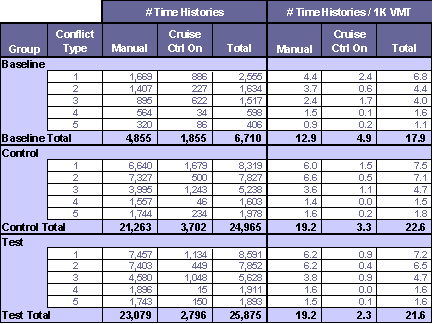
Figure 6.12-1. Available TH Data for Cruise Control Analyses
6.12.1. Risk Evaluation for Cruise Control
As was done in the analysis of the CWS, TTCb and ECA will be used to assess driving risk and safety, respectively, for the two types of cruise control (CCC and ACC) systems deployed in the FOT. As in previous sections, TTCb is used to evaluate the effect of cruise control as opposed to manual driving. Low TTCb is high risk and is indicative of a situation where a driver waits to react. High TTCb is indicative of driver reaction well before any problem and is a low risk reaction. Figure 6.12.1-1 shows the comparisons of manual driving to CCC and ACC for each type of vehicle. The risk reduction (RR) factor in these graphs is defined in Section 6.10.
Figure 6.12.1-1 compares the risk reduction for each type of vehicle. It is observed from this that the Test vehicles have a slightly greater risk reduction over Control and Baseline (lower right plot of Figure 6.12.1-1). Based on the TTCb data, there is no significant risk reduction in the region of 0<TTCb<5 seconds when comparing CCC use in Baseline trucks with CCC in Control and ACC in Test trucks. Likewise, when ACC is compared with CCC as shown in Figure 6.12.1-2, there is no significant risk reduction for 0<TTCb<5 seconds using cruise control alone.
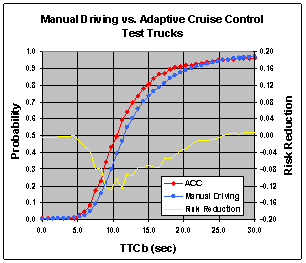
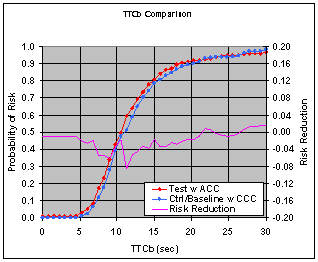
Figure 6.12.1-1. TTCb Risk Reduction Comparisons for Each Vehicle Type
Figure 6.12.1-2. Risk Reduction Comparison of ACC With CCC
6.12.2. ECA Improvement Using Cruise Control
Cruise control usage is also evaluated using Estimated Closest Approach (ECA) as defined in Section 6.10. ECA is the theoretical final distance of the following vehicle from the lead vehicle based on driver reaction to the conflict. When using cruise control, the driver reaction to a driving conflict might be generally different than manual driving. This assessment attempts to determine the nature of any difference.
Based on driver reactions, CCC and ACC appear to perform with a 4 per cent and a 2 per cent negative improvement respectively in the danger zone (0<ECA<10 feet). Comparing ACC with CCC as is done in the lower right panel of Figure 6.12.2-1, there is approximately a 2 per cent improvement in the danger zone. This indicates a slight advantage of ACC over CCC.
The ECA metric does not appear to be appropriate for cruise control. Cruise control was not designed to avoid a collision but rather offer a type of steady state speed or gap control. Thus, it shows rather problematic results from an ECA improvement standpoint. The reaction of drivers in such an environment is therefore different from manual driving as drivers have turned over a certain amount of control to the cruise control system. Reaction involves intervention of that control before the driver returns to manual driving.
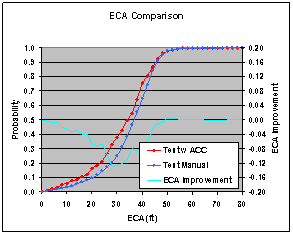
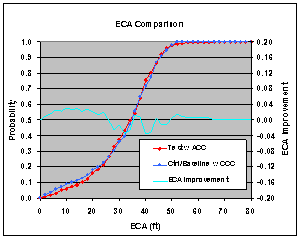
Figure 6.12.2-1. ECA Improvement Comparisons for Each Vehicle Type –
Cruise Control vs. Manual Driving
6.12.3. Following Interval with Cruise Control Comparisons
Following interval (FI) is the time gap between the following vehicle and the lead vehicle, calculated as following distance divided by road speed of the truck. FI comparisons were made for Baseline, Control, and Test vehicles when using cruise control as given in Figure 6.12.3-1. Histograms are presented here (left plots in Figure 6.12.3-1) to show how the FI values are distributed for the three types of vehicles. It can be observed that the maximum points of these histograms are different for manual driving vs. cruise control driving. This overall comparison is important to correlate with other analysis results and the general driving behavior experienced in the FOT. Similar to previous analysis, the CPD curves for FI with and without cruise control were generated as shown in the right plots in Figure 6.12.3-1.
It can be seen via the CPD plots that Control and Test vehicle FI values when comparing cruise control and manual driving do not substantially improve FI. Figure 6.12.3-2 shows this comparison which amplifies the fact that Control and Test vehicles drive with greater FI than Baseline vehicles when using cruise control but there is not a great deal of difference in FI from manual driving.
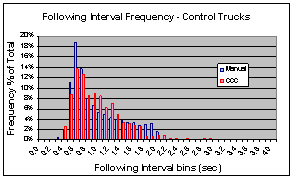
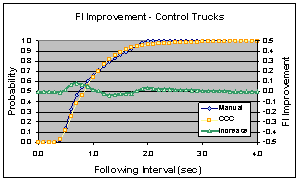
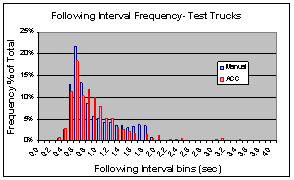
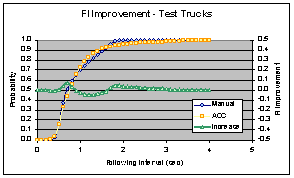
Figure 6.12.3-1. Following Interval at Histograms (Left) and CPD Curves (Right)
With and Without Cruise Control for Baseline, Control, and Test Vehicles
Figure 6.12.3-2. FI Improvement Summary
Figure 6.12.3-3. FI Improvement of Control and Test for Manual Driving
Figure 6.12.3-4. FI Improvement of Control and Test for Cruise Control Driving
6.12.4. Differences in Driver Manual Deceleration from Cruise Control Deceleration
For the use of cruise control it is important to know whether cruise control or the driver decelerated the vehicle when involved in a driving conflict. To do this, the driver reaction, and thus the variable ECA, was examined for specific conditions which are as follows:
a) Following-vehicle deceleration > 0.04 g, and
b) Cruise control is on at time of deceleration.
The first condition insures that there was definitely a deceleration. The second condition insures that cruise control was engaged at the time the deceleration began. In Figure 6.12.4-1 that there is no significant ECA improvement in the danger zone. This is summarized in the lower right panel of Figure 6.12.4-1 (manual deceleration vs. cruise control deceleration).
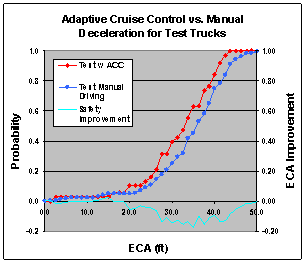
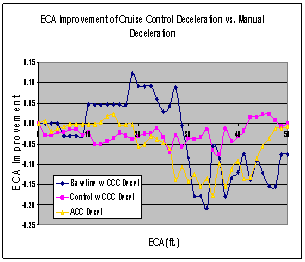
Figure 6.12.4-1. Differences Between Manual and Cruise Control Deceleration
6.13. Individual Vehicle Effects
In order to show the variation in important driving data within the driving conflict database, individual vehicles must be considered to allow for driver differences. Reports from the USX operations indicate that drivers are very sensitive to the safety equipment on their vehicles. Unlike driving data from simulators and test tracks, observations of naturalistic driving data show many outliers in the data. Part of this may be due to the recording equipment as well as noise and vibration generated by the vehicle. The data indicates a rather wide variation in the driving mannerisms of different drivers from vehicle to vehicle. Thus, the data set of valid time histories is examined in this section in more detail to note the degree of variation in individual vehicles.
Inasmuch as drivers change trucks frequently, these data variations may reflect the effect of the presence of several drivers for a particular vehicle. Several variables were picked to illustrate the variation in individual vehicle driving characteristics. The variables examined are:
- Deceleration level
- Cruise Control usage
- Warning reaction time
- TTCb
- Following interval
In each case, averages or percentages for each of the variables are used along with a summary figure (showing median values for each vehicle group and standard deviation error bars indicating variability across each group). Note that all of these effects are based on triggered time histories rather than histogram data.
6.13.1. Individual & Overall Vehicle Deceleration Levels
Figure 6.13.1-1 shows individual and overall vehicle statistics for deceleration levels. Deceleration of a vehicle can be caused by several actions: 1) accelerator release, 2) brake application, 3) engine brake action, 4) CCC/ACC speed decrease from set speed by driver, and 5) ACC deceleration to maintain set following interval. Deceleration values for all time histories are averaged as derived from the optimized scenarios. Deceleration is a key derived variable which helps characterize the database. In the final plot comparing the three types of vehicles, the median values across all vehicles with the standard error is shown. This figure gives a feel for the wide variation of deceleration values across the dataset which when taken as a whole is fairly uniform for each vehicle type.
Figure 6.13.1-1. Individual & Overall Vehicle Decelerations
6.13.2. Individual & Overall Vehicle Cruise Control Usage
Figure 6.13.2-1 shows individual and overall vehicle average braking for cruise control usage for the valid time history dataset. Cruise control usage is based on the percentage of time histories using cruise control out of the total number of time histories. It can be observed that this parameter varies widely from vehicle to vehicle depending on driver preferences but is fairly uniform across vehicle types in the final analysis.
6.13.3. Individual & Overall Vehicle Reaction Times to Warnings
Figure 6.13.3-1 shows individual and overall vehicle statistics for reaction times to warnings. Reaction time is important due to its relationship to the CWS. This variable is defined as the time from the sound of the first audible warning until a driver (or system) reaction occurs to change the course of the vehicle. The types of reactions that can occur include deceleration for any reason or lane change. Of course, Baseline vehicle drivers do not hear an audible warning even though the CWS equipment exists on the vehicles. Therefore, we expect to see more delay in this parameter for Baseline vehicles than for Control and Test vehicles.
Across vehicle types it can be seen that there is not much variation in median values in reaction time. This indicates that the drivers are perceiving driving conflicts and threats fairly uniformly and reacting about the same way. The difference between Baseline variations and the others can be attributed to the CWS in that the CWS is promoting a more consistent driving pattern for the vehicles than unassisted driving.
Figure 6.13.2-1. Individual & Overall Vehicle CC Usage
Figure 6.13.3-1. Individual & Overall Vehicle Reaction Time
6.13.4. Individual & Overall Vehicle TTCb
Figure 6.13.4-1 shows individual and overall vehicle statistics for TTCb, which is derived from the optimization process. Using vehicle velocity, lead-vehicle velocity, decelerations, and relative position, TTCb represents the time it would take for a collision to take place if the following vehicle does nothing, i.e. takes no action to avoid the conflict and potential collision. TTCb does not show wide variation by vehicle type as did some other variables. It can also be seen that Control and Test vehicles exhibit a slightly higher average TTCb than Baseline vehicles. Since TTCb is a risk indicator, this shows some risk reduction on an overall basis for Control and Test vehicles with CWS visual and audible warnings over Baseline without CWS visual or audible warnings.
Figure 6.13.4-1. Individual & Overall Vehicle TTCb
6.13.5. Individual Vehicle Following Intervals
Figure 6.13.5-1 shows individual and overall vehicle statistics for following interval. Following interval (FI) is measured in time units and is indirectly related to TTCb. This relationship is such that if FI is generally high, then TTCb will probably be high as well as a higher FI represents a lower risk driving situation than a lower FI. It can be seen that there is a modest amount of variation in the FI values from vehicle to vehicle. However, the median values for Test vehicles are slightly lower than for Control and Baseline.
Figure 6.13.5-1. Individual Baseline Vehicle Following Interval
6.14. Combined or Bundled System Effects
The main purpose of this combined system analysis is to evaluate the safety systems as a whole in each of the five defined driving conflicts. Combined effects will consider all of the data where ECA > 0 as well as all operating conditions working simultaneously for Control and Test vehicles evaluated against Baseline vehicles. This analysis adds the driver reactions to the combined environment of all of the other safety systems operating simultaneously and emphasizes the results using the driving conflict types as the analysis structure. All 57,550 conflict time histories are considered with the ECA restriction and the focus on conflict types 1 through 5. As was done in previous sections, risk reduction is determined using TTCb and ECA improvement is assessed for each conflict type. Figures 6.14.1-1, 6.14.2-1, 6.14.3-1, and 6.14.4-1 show TTCb and ECA comparisons for each of the five conflict types for:
- Baseline vs. Control trucks, and
- Baseline vs. Test trucks
As discussed previously these assessments are made with the restriction on ECA that ECA>0 where it is certain that the truck driver was required to resolve the driving conflict.
6.14.1. Combined Effects Comparison – Baseline vs. Control Risk Reduction
Figure 6.14.1-1 compares TTCb values for the sampled dataset within each of the five conflict types. It is observed that that there is risk reduction only in the cases of conflict type 5 for TTCb values between 0 and 5 seconds. Conflict type 3 shows little to no risk reduction for the period of 0 to 10 seconds; while conflict types 1 and 2 show negative risk reduction between the period 0 to 10 seconds.
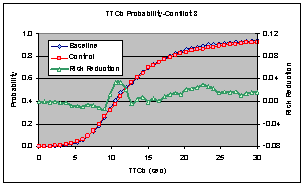
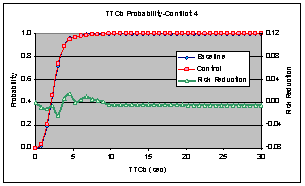
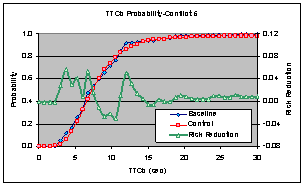
Figure 6.14.1-1. Combined Effects Comparison – Baseline vs. Control Risk Reduction
This figure shows that conflicts 5 will have that risk reduced due to the overall effect of the combined safety systems on the Control vehicles. The relative risk of other conflict types (1, 2, 3 and 4) is basically neutral for the safety systems.
6.14.2. Combined Effects Comparison – Baseline vs. Test Risk Reduction
Figure 6.14.2-1 shows the combined effects comparison for Baseline vs. Test vehicle risk reduction. In comparing risk reduction by driving conflict type for Baseline and Test, a different result is obtained than for the Baseline and Control comparison. In the Test vehicles, it is found decreased risk takes place in conflict types 1, 3, and 5 – 2 and 4 show negative risk reduction. While the risk reduction in conflict type 1 is small, the risk reduction for conflict types 3 and 5 is as high as 0.6 between the TTCb range of 0 to 10 seconds. By contrast, conflict types 2 and 4 show a negative risk reduction or increased risk – conflict type 4 being - 0.05 between TTCb of 0 to 10 seconds.
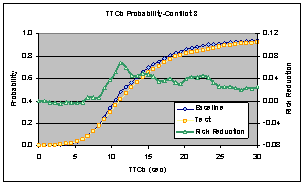
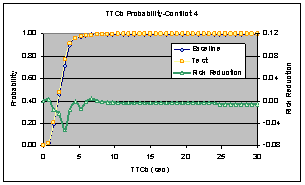
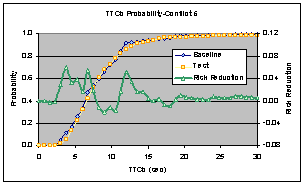
Figure 6.14.2-1. Combined Effects Comparison – Baseline vs. Test Risk Reduction
Very little reduction in risk is seen at all for conflict 1; but 6% risk reduction is experienced for conflict 3 in the region of 5 < TTCb seconds. It should be noted that conflict 4 TTCb values are generally much shorter (less than 5 sec.) than any of the other conflicts; and that at least 4% negative risk reduction is evident in that region.
6.14.3. Combined ECA Improvement Effects Comparison – Baseline vs. Control
The effects of driver responses to conflicts are evaluated using the ECA Improvement parameter derived from optimization of the time histories. Recall that the danger zone is where ECA < 10 feet and samples are filtered on the criteria that ECA is greater than zero.
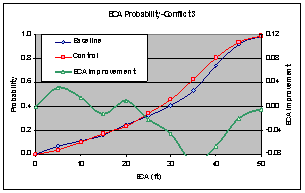
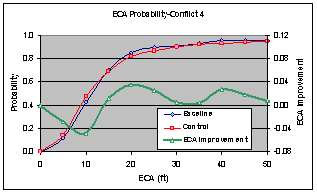
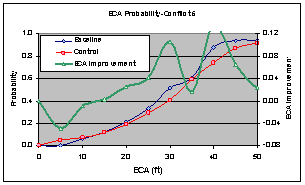
Figure 6.14.3-1. Combined Effects Comparison –
Baseline vs. Control ECA Improvement
Figure 6.14.3-1 shows the combined effects of Baseline vs. Control vehicle ECA Improvement. It can be seen that conflict 3 (constant speed lead vehicle preceded by a truck lane change) is the only situation in which some ECA improvement is apparent for ECA values from 0 to 10 ft while conflict types 4 (stopped lead vehicle) and 5 (decelerating lead vehicle) show a negative ECA improvement in the same area. The other conflict types show only small changes both positively and negatively. The stopped-lead-vehicle situation is therefore very difficult for the driver to resolve in the danger zone even with the safety systems. This implies that the Control truck drivers are reacting similarly to Baseline drivers for a combination of effects regardless of the driving scenario in the presence of the safety systems except for the cases of the decelerating and stopped lead vehicles (conflict types 5 and 4, respectively). Therefore, where ECA < 10 feet, the Control vehicle drivers are responding in such a way that the outcome of the result driver response is approximately the same as for Baseline vehicles.
6.14.4. Combined ECA Improvement Effects of Baseline vs. Test
Figure 6.14.4-1 shows the combined effects of ECA Improvement comparison for Baseline vs. Test vehicles and the 5 driving conflict types. ECA improvement is shown, albeit very small, in the driver response for conflict types 1, 2, 3, and 4 in the danger zone 0<ECA<10. Conflict type 5 shows a negative improvement in the danger zone. In summary, the Test vehicle drivers are responding in such a way that the final outcome of the driver response is slightly improved over that for Baseline vehicles.
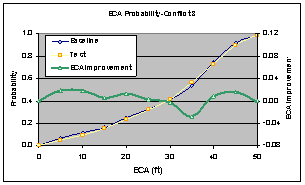
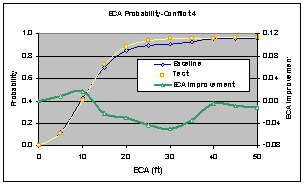
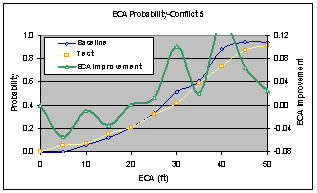
Figure 6.14.4-1. Combined Effects Comparison – Baseline vs. Test ECA Improvement
6.14.5. Summary of Combined Risk Reduction for Control and Test vs. Baseline
An overall summary of Baseline vs. Control and Baseline vs. Test for bundled effects for TTCb and ECA are compared in Figure 6.14.5-1. For Control, conflict 5 has the highest overall risk reduction; and conflict 2 has the lowest in the region where TTC is 0 to 5 seconds. Test trucks show that conflicts 1 and 5 have the highest risk reduction while 2 and 4 have the lowest in the same region.
Figure 6.14.5-1. Risk Reduction Summary of Baseline vs. Control and vs. Test Vehicles
6.14.6. Combined ECA Improvement – Control and Test vs. Baseline
ECA Improvement of Baseline vs. Control and vs. Test is summarized in Figure 6.14.6-1. For Control trucks in the danger zone, conflict 3 shows improvement while 4 and 5 have a slightly negative improvement. Test trucks in the danger zone show a small improvement for conflicts 1 thru 4 with conflict 5 showing a negative improvement. For cases showing negative improvement, the trucks are not braking as hard as Baseline trucks partially because they are braking earlier.
Figure 6.14.6-1. ECA Improvement Summary of Baseline vs. Control and vs. Test Vehicles
6.14.7. Special Driving Effects
Special driving effects of the safety systems covered in this section are as follows:
- Warning Frequency at Various Following Vehicle Speeds
- Warning Frequency With Variations of Following Interval
- Deceleration to Avoid Lead-Vehicle Conflict With ACC On
- Speed at Flying Pass (Lane Change) With and Without Cruise Control
- Range, Range-Rate, and TTC at Flying Pass
- Conditions at Lead-Vehicle Cut-in With and Without Cruise Control
6.14.7.1. Frequency of Warnings at Various Following Vehicle Speeds
The frequency of warning occurrence at various speeds was examined to see if more warnings occurred at low speed than high speed. It is possible that a higher rate of non-threatening warnings may occur at low speeds rather than high-speeds due to more traffic of roadside and other stationary objects encountered on roads with low speed limits.
Warnings were compared with speed for all three types of vehicles based on real threats vs. non-threats. It can be seen from Figure 6.14.7.1-1 that there is a higher incidence of non-threat warnings at lower speeds. A summary evaluation by vehicle type shows the degree of difference compared as well for the three differences in Figure 6.14.7.1-2.
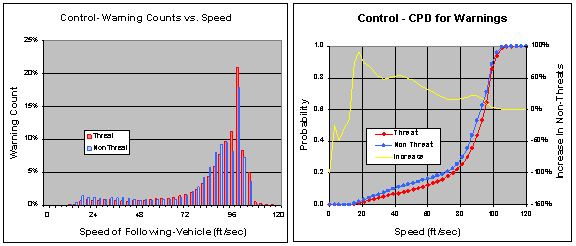
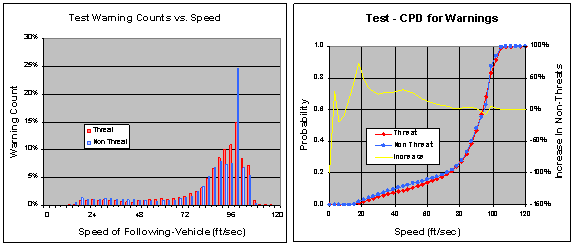
Figure 6.14.7.1-1. Warning Rates vs. Speed by Truck Configuration
Figure 6.14.7.1-2. Increase of Non-Threat over Threat Warnings vs. Speed
6.14.7.2. Warning Frequency at Various Following Intervals
The frequency of warning occurrence at various following intervals was examined to determine if there are any insights into the operation of the CWS as compared for the three types of vehicles. It is seen from Figure 6.14.7.2-1 that there is no difference in threat warnings across the three vehicle types.
Figure 6.14.7.2-1. Warning Rates vs. Following Interval for Each Vehicle Type
6.14.7.3. Deceleration to Avoid Lead-Vehicle Conflict With ACC On
Determination of ACC deceleration levels was made from the data and is shown in Figure 6.14.7.3-1. This does not show any significant ACC deceleration level for Test vehicles involved in a driving conflict. However, it may reflect the inherent design of the ACC system in that ACC is designed to maintain a consistent following interval – not to respond to a driving conflict.
Figure 6.14.7.3-1. Deceleration Level To Avoid Conflict With ACC On
6.14.7.4. Speed at Flying Pass (Lane Change) With and Without Cruise Control
Comparison was made of the vehicle speed at the time of lane change with and without cruise control engaged. It can be seen that there is a substantial difference in the statistics of lane change with the use of cruise control over manual driving. Manual driving is about the same for all three vehicle types as shown in the frequency plot of Figure 6.14.7.4-1 (left plot). When using cruise control there is some difference between Baseline, Control, and Test vehicle types as also shown in Figure 6.14.7.4-1 (right plot). However when a comparison is made for each vehicle type with and without cruise control, the differences are clear as shown in Figure 6.14.7.4-2. Lane changes with cruise control seem to take place at mostly higher speeds.
These results indicate that vehicles using cruise control tend to make lane changes at slightly higher speeds than vehicles not using cruise control. For example, in Figure 6.14.7.4-1 40% of the lane changes take place at 85 ft./sec without cruise control, and with cruise control 40% of the lane changes occur at approximately 95-100 ft./sec. Manual driving or cruise control both show little difference in the speed choice that drivers make for all three vehicle types. It can be seen from figures 6.14.7.4-1 and 6.14.7.4-2 that the flying pass maneuver occurs more frequently using manual driving and at somewhat lower speeds than when using cruise control.
Figure 6.14.7.4-1. Speeds at Flying Pass
Without and With Cruise Control for Each Vehicle Type
6.14.7.5. Range, Range-Rate, and TTC at Flying Pass
Lane change driving characteristics are of interest to see if there are differences in range, range rate, and time-to-collision between vehicle types. Figure 6.14.7.5-1 shows these three variables at the time of lane change; and it can be seen that there is little to no difference between the vehicle types for all three. These data establish the tendencies of drivers in the majority of cases as peaks for the three variables can be observed at a range of 64 ft for Control and Test and 74 ft for Baseline. For range rate, there is a peak of -1 ft/sec for all three vehicle types; and for time-to-collision all three vehicle types have a peak at 10 sec. This shows a great deal of uniformity in the way drivers drive when making a lane change.
Figure 6.14.7.4-2. Following-Vehicle Speed at Flying Pass
With and Without Cruise Control for Each Vehicle Type
Figure 6.14.7.5-1. Range, Range-Rate and Time-To-Collision
at Flying Pass for Each Vehicle Type
6.14.7.6. Conditions at Lead-Vehicle Cut-in With and Without Cruise Control
It is interesting to note the driving conditions of range, range rate, and following interval at times when a lead vehicle cuts in on the vehicle. This is a very frequent occurrence in the FOT driving data. It is also especially noteworthy to compare manual driving conditions with those where cruise control is being used. Figures 6.14.7.6-1, 6.14.7.6-2, and 6.14.7.6-3 show these three variables for manual driving and when cruise control is on.
It can be readily observed that all three vehicle types have similar cut-in conditions when in manual mode. However when cruise control is being used, the average cut-in conditions change.
Figure 6.14.7.6-1. Range at Lead-Vehicle Cut-In
Without and With Cruise Control for Each Vehicle Type
Figure 6.14.7.6-2. Range-Rate at Lead-Vehicle Cut-In
Without and With Cruise Control for Each Vehicle Type
Figure 6.14.7.6-3. Following Interval at Lead-Vehicle Cut-In
Without and With Cruise Control for Each Vehicle Type
For one thing, the Test vehicle ranges are generally lower than Baseline and Control vehicles. Similarly, range rate at cut-in is generally lower for Test vehicles indicating a safer situation for the vehicles at lower closing rates. Finally, while the FI values are also generally lower correlating with range, it would seem that Test vehicles are in a safer situation for most cut-ins with ACC on as opposed to Baseline and Control with CCC on.
6.15. Systems Analysis Findings
6.15.1. Collision Warning System (CWS)
- When driving conflicts occur, the CWS appears to reduce the risk of a crash if the vehicle ahead is braking above a level of 0.13g. The risk is reduced due to the fact that CWS equipped vehicles brake earlier enough at a sufficient level to avoid a crash.
- CWS causes drivers to drive with a greater following interval to the vehicle ahead than manual driving. Greater following interval gives a higher margin of time for reaction to any conflict.
- CWS warning credibility is high for more severe warnings (type 2).
- Lower severity CWS warnings are less credible, due to the detection of non-threat targets that are obvious to drivers with CWS.
- Risk of a crash in driving conflicts is shown to be directly proportional to the driver braking level in response to the conflict; i.e. low risk (high TTCb) requires low braking and higher risk (low TTCb) requires an earlier or higher level of braking. Following-vehicle deceleration is likewise found from the FOT data to be inversely proportional to TTCb.
- Conflict types 1, 2, and 3 occur most frequently; while conflict types 2, 4 and 5 represent the highest risk driving situations.
- Considering cases where warnings occur, for the CWS Warning 2 there is a ratio of threat to non-threat warnings of approximately 1:3 for Baseline and 1:2.5 for Control and Test vehicles.
6.15.2. Cruise Control System
- ACC was utilized at approximately 1/3 the rate of use of CCC for the FOT test.
- Cruise control does not provide significant risk reduction over manual driving when time-to-collision for the driving conflict is 5 seconds or less.
- Due to cruise control usage driver responses to conflicts do not show ECA improvement over manual responses. ACC appears to afford some ECA improvement over CCC when responding to a conflict.
- When using cruise control, drivers operate with greater (i.e. safer) following intervals than manual driving when used in combination with a CWS (Control and Test trucks).
6.15.3. Driver Reaction
- When viewed on an overall basis, driver braking reactions are 40 percent improved with the safety systems when reacting to a driving conflict that is most likely to be a crash.
- The safety systems reduce risk up to 50 percent in severe driving situations where the lead vehicle is braking heavily (above 015g). Over a wide range of lead vehicle braking levels, however, safety systems only reduce risk by 2 percent.
- Actual braking responses are not significantly different for the three types of trucks over a wide range of lead vehicle braking levels in a driving conflict. However, it was found that the result of braking over the same range is improved by 40 percent in highly critical driving conflicts where the response results in an ECA less than 10 feet.
- Following Interval increase for manual driving in the danger zone show a maximum for Control trucks of 4 percent and of 6 percent for Test trucks in the FI range of 0.5 sec. to 3 sec.
- Following Interval for cruise control usage in the danger zone range from 10% for Control trucks to 5% for Test trucks in the FI range of 0.5 sec. to 3 sec.
6.15.4. Individual Vehicle Effects
- Average deceleration values are similar for all three vehicle types but vary widely across different vehicles.
- Cruise control usage is greatest for Baseline vehicles followed by Control and Test vehicles in that order.
- Reaction time from warnings is similar (~1.8 sec) for all three vehicle types.
- TTCb values average the greatest for Test vehicles showing a risk reduction over the other two vehicle types. This affords more time to react to a driving conflict.
- FI variations are large across different vehicles but average out as approximately equal for the three vehicle types.
6.15.5. Combined (Bundled) System Effects
- Safety systems on Control vehicles show a small amount of risk reduction for stopped-lead-vehicle driving conflicts when considering the danger zone for Control vehicles. For other types of conflicts risk either increases or is about the same at time-to-collision values less than 5 seconds.
- Safety systems on Test vehicles show risk reduction for conflict types 1, 3, and 5 in the time-to-collision range of less than 5 seconds. Braking in these cases appears to be later than without the bundled safety systems. This may be due to the fact that more distance is available for braking in front of the truck than without the systems.
- Test vehicle risk reduction is due to the operation of ACC (as part of the CWS) and disc brakes.
- ECA Improvement within 10 feet is small for conflicts 1-3 and negative for conflicts 4 and 5 for Control trucks. Test trucks show similar results except for negative improvement in conflict 5.
- The stopped lead vehicle conflict is the most difficult for drivers to deal with even when equipped with safety systems. Lead-vehicle-decelerating (type 5) conflicts are the next most difficult for drivers.
- The probability of a non-threat warning from the CWS is greater at low speeds.
- Following interval does not affect the rate of non-threat warnings.
- Lane change using cruise control is made at higher speed than lane change with manual driving.
- By lowering range rate, ACC provides a measure of safety for situations of lead-vehicle cut-in over manual and CCC driving.
7.0. FOT VEHICLE OPERATIONAL PERFORMANCE
As noted in Section 5.7, the FOT presented the opportunity to collect millions of miles of naturalistic operational data from various vehicle systems running in commercial revenue generating service. The data gathered from the FOT vehicle recordings and stored in the MSRC IVI database was queried to obtain summary data, which provided a broad perspective of equipment operation. Selected samples of the summary data are shown in this section. See Appendices F and G for more details of the queries and the data generated. In addition, Advanced Safety System performance data was gathered from other sources such as the Volvo Warranty System, US Xpress Accident, and Incident reports, brake system performance tests, and brake system measurements at the time the DAS was removed from the FOT vehicles. System performance, durability, reliability, comparative repair cost, and accident information is also shown in this section.
7.1. General Driving Data
Table 7.1-1 shows selected summary operational data for the FOT vehicles. Only validated data from DAS configuration 2 has been included in the table. That is, if a data file was flagged due to a sensor problem or partially missing data, then the data in the flagged file was not included in the operational data database [ref. Figure 6.2-1]. The data that was included generally follows the ‘good data’ identified in Appendix F – Vehicle History File. The data is normalized by vehicle miles traveled (VMT) to present a direct comparison among the 3 vehicle groups. Additionally, some of the subjects were broken down further into city and highway usage.
Figure 7.1-1 shows the percent of run time that the FOT vehicles spent in the various speed ranges throughout the FOT. As can be seen from the histogram counts, there was little difference among the Baseline, Control, and Test vehicle groups in time run in the various speed ranges. It is also apparent that the Advanced Safety Systems had no effect on the amount of time the FOT vehicles spent at the various speed ranges. Since the FOT vehicles operate primarily in highway service, it is not surprising that approximately 84% of the FOT vehicle run time was spent at speeds above 50 mph.
Following Interval is an indicator of the degree of driver aggressiveness. Figure 7.1-2 shows the percentage of run time with the following interval between the lead vehicle and a following vehicle greater than 3 seconds. This is a relatively safe following distance. Refer to Table 2.2 to view the relationship between following interval, speed, and following distance. The difference between Baseline, Control, and Test vehicles appears to be insignificant. It is interesting to note that when the FOT vehicles are in primarily city operations, the percentage of time with a following interval greater than 3 seconds is higher. A possible explanation is that in stop-and-go city traffic, the FOT vehicles accelerate slower and lag behind lead vehicles.
Table 7.1-1. Summary Operational Data for the FOT Vehicles (DAS 2 Only)
Recorded Operational Data |
Baseline Vehicles |
Control Vehicles |
Test Vehicles |
All Vehicles |
Recording Time (hours) |
35,881 |
67,397 |
154,087 |
257,365 |
Miles Traveled |
1,431,483 |
2,540,024 |
6,157,788 |
10,129,295 |
Number of Fore & Aft Trigger Events > 0.25 g with brakes actuated per 1,000 miles |
5.130 |
6.168 |
5.215 |
5.442 |
Number of ABS Events with Time to Collision < 0.5 sec per 1,000 miles |
0.0119 |
0.0079 |
0.0021 |
0.0049 |
Number of Brake Applications per Mile |
0.835 |
0.985 |
1.033 |
0.985 |
Percent of Run Time with Brakes Applied |
9.06% |
10.34% |
10.08% |
10.04% |
Percent of run time with Cruise Control Operating |
39.9% |
34.8% |
33.6% |
34.8% |
Percent of miles with Cruise Control Operating |
46.0% |
39.9% |
39.2% |
40.3% |
Percent of Run Time with |
84.3% |
81.7% |
82.7% |
82.7% |
Percent of Miles with Following |
84.3% |
81.6% |
82.6% |
82.6% |
Percent of Run Time with Following Interval < 1sec |
2.13% |
2.38% |
2.00% |
2.11% |
Percent of Miles with Following Interval <1 sec |
2.11% |
2.35% |
1.96% |
2.08% |
Percent of run time with Engine Brake and Foundation Brakes Active |
0.27% |
0.28% |
0.26% |
0.27% |
Number of VORAD® alarm 9 events per 1,000 miles (Fast Closing) |
85.042 |
47.460 |
56.552 |
51.761 |
Number of VORAD® alarm 10 events per 1,000 miles (Following Interval < 0.5 sec.; speed > 10 mph) |
30.125 |
27.388 |
21.714 |
24.326 |
Number of Kinematic Motion Event (0) triggers per 1,000 miles |
18.888 |
16.494 |
20.723 |
19.403 |
Number of Kinematic Motion Event (1) triggers per 1,000 miles |
18.553 |
15.385 |
8.863 |
11.868 |
Figure 7.1-1. FOT Vehicle Run Time Road Speed Distribution
Figure 7.1-2. Percent of Run Time with Following Interval Greater than 3 Seconds
Figure 7.1-3 shows the percentage of run time with less than 1 second following interval, which is potentially more dangerous. The higher percentage of time spent at the less than 1 second following interval indicates that FOT vehicle operation in the city was more dangerous than on highway. Looking at the total database, the effect of the CWS (the difference between Control and Baseline vehicles) indicates that the CWS did not have a positive safety affect in reducing the percentage of time at the short following interval. Looking at the effect of ACC with the CWS and the Advanced Braking System (the difference between Test and Control vehicles), a positive safety affect can be seen in reducing the percentage of time spent at the short following interval. A reason for this may be the operation of the ACC system, which works to maintain a set following interval.
Figure 7.1-3. Percent of Run Time with Following Interval < 1 Second
Usage of cruise control by percentage of time and miles is shown in Figure 7.1-4 as obtained from histogram data. Note that 40% of the service miles driven were with the cruise control system operating. This is not surprising in that the FOT vehicles are on the highway most of the time. The reason or reasons that the usage of cruise control is somewhat higher for Baseline vehicles is unknown and may be influenced by driver characteristics.
Figure 7.1-4. Percent of Run Time and Run Miles with Cruise Control On
Potentially dangerous fast-closing events were recorded to determine if there were differences in the operation of the Baseline, Control, and Test vehicle groups. VORAD® alarm 9 (see Table 2.2-1) indicates a fast closing condition and is activated when a lead vehicle is detected in the same lane as the following (host) vehicle, the lead vehicle range is less than 220 feet with a following interval of less than 3 seconds, and the following vehicle speed is at least 35 mph and is 25% higher than the lead vehicle’s speed. Figure 7.1-5 shows that the CWS had a positive safety affect (Control vs. Baseline) with fewer fast closing VORAD® alarm 9 events per thousand miles. The affect of the ACC with the CWS and the Advanced Braking System shows a slight negative safety affect as more fast closing VORAD® alarm 9 events were counted for Test vehicles when compared to Control vehicles. The combined Advanced Safety Systems also show a positive safety affect (Test vs. Baseline) with fewer VORAD® alarm 9 events.
Figure 7.1-5. Number of Fast Closing Events per 1,000 Miles (VORAD® 9)
and Short Following Interval (VORAD® 10) Events per 1,000 Miles
The number of VORAD® alarm 10 events was recorded to assess the affects of the Advanced Safety Systems. A VORAD® alarm 10 (see Table 2.2-1) warning is activated when the
following (host) vehicle’s speed is greater than 10 mph, the following interval is less than 0.5 seconds, and the following vehicle is opening or closing on a lead vehicle.
Figure 7.1-5 indicates that the Test vehicles with the combined Advanced Safety Systems exhibited an apparent positive safety effect when compared to the Baseline and Control vehicles.
However, the positive safety effect is clouded since the VORAD® 10 alarm count includes the following vehicle opening or closing effect of the lead vehicle, but an increasing gap (opening) of the lead vehicle is not a safety concern.
Figure 7.1-6 shows the frequency of service brake applications per mile. The data is further reduced to separate brake application statistics into primarily highway braking
events (braking events at speeds of greater than or equal to 50 mph) and primarily city braking events (braking events at speeds of less than or equal to 30 mph). As expected, the frequency of brake
applications is much higher in city driving than highway driving. There appears to be no significant braking frequency difference among the Baseline, Control, and Test vehicle groups.
Brake application pressures for disc brake equipped Test vehicles were recorded. As can be seen from Figure 7.1-7, when the service brakes were applied, by far most of the brake application pressures were below 15 pounds per square inch (psi).
This indicates that most of the stops were gentle (low deceleration). The data shown is for Test vehicles only, as brake application pressures were not recorded for Baseline and Control vehicles.
Figure 7.1-6. Number of Brake Applications per Mile
Figure 7.1-7. Brake Application Pressure Percent of Counts
One of the Time History data recording triggers was longitudinal deceleration greater than 0.25g with brakes actuated. This is considered a hard braking event.
From Figure 7.1-8, it can be seen that Control vehicles recorded 20% more hard stops than Baseline vehicles, and 18% more hard stops than Test vehicles.
On the surface, this would indicate that the Control vehicles (equipped with CWS, CCC, and drum brakes with ABS) operate less safely than both the Baseline vehicles
(without CWS) and the Test Vehicles (with CWS, ACC, disc brakes, and ECBS).
Figure 7.1-8. Number of Hard Braking Events per 1,000 Miles
Figure 7.1-9 shows the number of ABS events with time to collision less than 0.5 seconds per million VMT. This was intended to show potentially dangerous events where hard braking caused the antilock braking system to activate. The data indicates that the Test vehicles with the combined Advanced Safety Systems operated much more safely than the Baseline vehicles and somewhat more safely than the Control vehicles as shown by the normalized lower number of ABS events.
Figure 7.1-9. Number of ABS Events per Million Miles
with Time to Collision < 0.5 Seconds
7.2. Collision Warning System Durability, Reliability, and Maintenance Costs
Figure 7.2-1 shows the rear-end CWS frequency of repair for the Control vehicles, Test vehicles and both Control and Test vehicles together. Since the systems are physically the same for both Control and Test vehicles, no major durability or reliability differences were anticipated. The most common problem encountered involved the forward-facing antenna. This is to be expected as it is mounted to the front bumper in a relatively vulnerable position.
Figure 7.2-1. Collision Warning System Repair Frequency
CWS repair costs are shown in Figure 7.2-2. Again, costs are similar for the Control and Test vehicles. It is interesting to compare these repair costs per million miles to those of ABS, another electronically controlled safety related system. The CWS repair costs are approximately double the ABS system repair costs. This is the result of the high cost of forward-facing antenna replacement parts.
Figure 7.2-2. Rear-end Collision Warning System Repair Costs
7.3. Disc and Drum Brake Durability, Reliability, and Maintenance Costs
As the data gathering portion of the FOT was coming to an end, the FOT vehicles were sequentially brought into the US Xpress facility at Tunnel Hill, Georgia to be decommissioned from gathering data. The DAS was removed, as well as was other instrumentation. On 26 of the Control vehicles, and 46 of the Test vehicles, the wheels were removed to measure brake shoe and brake drum wear (Control vehicles) or brake pad and brake rotor wear (Test vehicles). Based on the dimensional differences between new brake wear components and the brake wear components measured after over 300,000 miles of revenue generating service, service life projections were made. Figure 7.3-1 shows the average number of FOT miles accumulated by Control and Test vehicles when the brake-wear component measurements were made. It also shows a comparison of the projected useable life of the front brake systems.
Figure 7.3-1. Projected Front Brake Useable Life Comparison
Figure 7.3-2 shows the projected useable life of the rear brake systems. Note that a premium, long life drum brake system was utilized on the US Xpress vehicles. The normal useable life of standard drum brake wear components is approximately 500,000 miles. Projected life data from the FOT indicated that the rear axle disc brake wear components will exceed the useable life of standard drum brake systems, but not the premium long life drum brake systems.
Figure 7.3-2. Projected Rear Brake Useable Life Comparison
Figure 7.3-3 shows a comparison of the repair frequency between the S-cam drum brake systems installed on the Control vehicles, and the Volvo disc brake systems installed on the Test vehicles. The disc brake repair frequency of 0.76 repairs per million miles is significantly lower than the drum brake repair frequency of 1.31 repairs per million miles. Note that automatic slack adjusters were the most common item requiring repair for the drum brake systems. The frequency of repairs for the ABS or ECBS systems was very similar. The component accounting for the majority of ABS and ECBS system repairs was the wheel speed sensor.
Figure 7.3-3. Brake System Frequency of Repair Comparison
7.4. ECBS and ABS Durability, Reliability, and Maintenance Costs
In contrast, Figure 7.4-1 shows a comparison of brake system repair costs. Here, the drum brake system repair cost of $230 per million miles is well below the disc brake repair cost of $703 per million miles. The higher cost of the disc brake repairs can be attributed to the high cost of pre-production materials and repair technician unfamiliarity with disc brake repair procedures. Similarly, the average cost of ECBS repairs was significantly higher than that of the ABS repairs. Again, the higher cost of the ECBS repairs can be attributed to the high cost of pre-production electronic control components.
Figure 7.4-1. Brake System and ABS/ECBS System Repair Cost Comparison
An indirect measure of the number of repeated problems with ABS or ECBS systems was made by comparing the number of problems encountered and the number of vehicles encountering problems. Figure 7.4-2 shows that there were more repeat problems with the pre-production ECBS systems due to repair technician unfamiliarity with ECBS repair procedures.
Figure 7.4-2. Comparison of FOT Vehicles with More than 1 ABS or ECBS Problem
7.5. Braking System Stopping Performance Deterioration After Significant Time in Service
In order to assess the braking performance of the drum and disc brake systems after significant mileage had been accumulated, FMVSS 121 stopping distance tests were performed on 1 Control tractor and 1 Test tractor pulled from the US Xpress FOT fleet [ref. 5]. Stopping distance tests from 60 and 75 mph were conducted on the "as received" tractors. Both tractors had been operating in US Xpress revenue generating service for over 300,000 miles (319,000 for the drum brake tractor and 362,000 for the disc brake tractor). Figure 7.5-1 shows the "as received" stopping distance from 60 mph on dry concrete with a full brake application for the drum brake tractor and the disc brake tractor loaded to GVWR using an unbraked FMVSS 121 control trailer. The FMVSS 121 requirement is 355 feet for loaded tractors. Both the drum brake tractor and the disc brake tractor as received met the requirements for each of the 3 stops that were run on each vehicle. The average stopping distance for the 3 stops shows the disc brake tractor stops 21 feet (approximately 7.2%) shorter than the drum brake tractor.
Figure 7.5-1. Summary Results: 60 mph Stopping Distance "As Received"
and with New Brakes Installed
The braking system on the US Xpress disc brake tractor was rebuilt with new discs and pads, and new tires were installed. The brakes were burnished using the FMVSS 121 procedure and the control trailer. Similarly, the drum brake system of a US Xpress specification tractor was rebuilt with new drums and brake linings, and new tires were installed. The brakes were burnished in the same fashion as the disc brake tractor.
Also shown in Figure 7.5-1 is a comparison of stopping distances (with FMVSS 121 Control trailer) from 60 mph of the drum brake and disc brake tractors and tractors with rebuilt brake systems. Note that the drum brake tractor with new burnished brakes stopped an average of 31 feet (10.7%) shorter than the "as received" drum brake tractor. The disc brake tractor with new burnished brakes stopped an average of 36 feet (13.4%) shorter than the "as received" tractor.
Similarly, Figure 7.5-2 also shows the comparison of stopping distances from 75 mph for "as received" and new brakes. For new burnished drum brakes, an improvement of 100 feet (17.6%) average stopping distance is shown, while new burnished disc brakes show a 17 foot (4.5%) average shorter stop.
Figure 7.5-2. Summary Results: 75 mph Stops “As Received”
and with New Brakes Installed
The data in Figure 7.5-1 comparing the 60 mph average stopping distance of the new burnished disc brakes and new burnished drum brakes indicates a 26 foot (10%) shorter stop with disc brakes. Similarly, Figure 7.5-2, comparing the 75 mph average stopping distance of the new burnished disc brakes and new burnished drum brakes, indicates a 104-foot (22.3%) shorter stopping distance for disc brakes. In the "as-received" condition, the disc brake average stopping distance compared to the drum brake average stopping distance was 7.2% and 33% shorter for 60 mph and 75 mph test speeds, respectively.
7.6. US Xpress Accident and Incident Reports
As noted on Section 5.5, the US Xpress Safety Department compiled accident and incident reports on the 100 FOT vehicles for approximately 3 years (through December 31, 2003). From the start of the FOT through December 31, 2003, the subject vehicles accumulated approximately 39 million miles of revenue generating service mileage. A breakdown of the mileage by vehicle group is shown in Table 7.6-1. Note that the Baseline vehicles had all been converted to Control vehicles by December 31, 2003 and most of the Control vehicles had completed their lease and were removed from US Xpress service. The Test vehicles remained in US Xpress service after December 31, 2003. Test vehicle mileage for the end of calendar year 2003 is based on the highest mileage recorded either in Warranty reports or when the DAS was removed from the vehicle. Therefore, the Test vehicle mileage is somewhat conservative.
Table 7.6-1. US Xpress FOT Vehicle Mileage Data
Baseline Vehicle Total Mileage |
6,542,559 |
Control Vehicle Total Mileage |
15,602,965 |
Test Vehicle Total Mileage (Highest recorded mileage before 12/31/2003) |
17,187,058 |
All FOT Vehicle Mileage as of December 31, 2003 |
39,332,585 |
By definition, an "accident" involves a collision between the subject vehicle and another vehicle or object. An “incident” is a non-impact type event such as landscape damage or a trailer disconnect. The US Xpress reports are broken down further into “preventable” and “non-preventable” events. Preventable events are those in which a determination was made that the driver failed to do everything reasonable to prevent the event from happening, using U.S. Department of Transportation, American Trucking Association, and National Safety Council guidelines. Additionally, the reports include information regarding the type of accident, driver injuries, CWS interaction, and the number of U.S. DOT recordable accidents [ref. Appendix H].
There were a total of 309 accidents and incidents involving the FOT vehicles from the start of the test through December 31, 2003. Of the total number of accidents and incidents (309), 178 were preventable by FOT driver action. The remaining 121 were caused by circumstances beyond the control of the FOT vehicle driver. Examples of a non-preventable accident are the FOT vehicle being sideswiped by another vehicle, or the FOT vehicle being hit by another vehicle while parked.
The number of preventable accidents and incidents per million miles by vehicle group is shown in Figure 7.6-1. While there appears to be fewer accidents and incidents for the Baseline vehicles, no conclusions regarding the CWS can be drawn from this information as it includes events that may or may not have had interaction with the CWS.
Figure 7.6-2 shows the total number of preventable accidents with rear-end CWS interaction. The Baseline group shows fewer accidents primarily due to the fewer number of Baseline vehicles (20) compared to Control and Test groups, and the limited time the Baseline vehicles were in service.
Figure 7.6-1. Number of Preventable Accidents and Incidents per Million Miles
Figure 7.6-2. Number of Preventable Accidents with Rear-end CWS Interaction
By normalizing the number of preventable accidents with rear-end CWS interaction by in-service mileage, there appears to be little difference between Baseline, Control, and Test vehicle groups. This is shown in Figure 7.6-3. Since there were so few accidents involving rear-end CWS interaction, it was not possible to evaluate the CWS using the accident data. Other statistical measures such as TTCb and ECA were therefore utilized as measures for operational effects analysis.
Figure 7.6-3. Number of Preventable Accidents
with Rear-end CWS Interaction per Million Miles
8.0. OBSERVATIONS AND CONCLUSIONS
8.1. Field Operational Test Observations
Observations from the FOT are related to conditions concerned with rear-end collisions and are grouped by vehicle operations, collision warning, cruise control, and braking systems.
8.1.1. Observations Regarding Vehicle Operations
- Highway tractor-trailer combination vehicles travel at speeds above 50 mph 84% of the time and above 65 mph approximately 50% of the time, generally keeping up with the flow of surrounding traffic. (Sec. 7.1.)
- Highway tractor-trailer combination vehicles operate at a relatively safe following interval (>3 seconds) 82% of the time (on highway) and 90% of the time in city traffic. (Sec. 7.1.)
- Highway tractor-trailer combination vehicles operate at a potentially dangerous following interval (<1 second) approximately 2% of the time (on highway) and 2.7% of the time in city traffic. (Sec. 7.1.)
- The number of preventable accidents with rear-end CWS interaction was too low for meaningful statistical analysis. Instead, dynamic parameters of potentially dangerous events such as Estimated Closest Approach (ECA), vehicle braking level, and Time to Collision at Braking (TTCb) were analyzed to determine driving patterns. Differences in cumulative probability density curves were used to observe contrasting patterns of different systems. (Sec. 6.9 through 6.14.)
- Considerable data reduction was required to produce an analyzable data set that accurately portrayed operation of the safety systems. Ultimately data was chosen for driving situations where there was a notable evasive action by the truck driver coupled with the fact that the situation could have easily resulted in a crash (Sec. 6.2 through 6.10.).
- Across all individual vehicles in the dataset, median risk values (based on TTCb values) were less for Control and Test vehicles than for Baseline vehicles indicating that the CWS has a positive effect on risk overall. (Sec. 6.13.4.)
- Across all individual vehicles in the dataset under all driving conditions, median following intervals were approximately the same for all vehicles. (Sec. 6.13.5.)
- Analysis using the five pre-defined conflict scenarios showed that the most difficult scenarios for drivers are the stopped, and decelerating lead-vehicle conflicts. In addition, risk was reduced more in Test vehicles for these cases than in Control vehicles. (Sec. 6.10.1, 6.14.1, 6.14.2, and 6.14.5.)
- ECA (which is the predicted result of driver action) analysis of conflicts shows little difference by conflict type for both Control and Test vehicles. (Sec. 6.14.3, 6.14.4, and 6.14.6.)
8.1.2. Observations Regarding the Collision Warning System
- Analysis of CWS warning data must be made by comparison of similar, relevant data with regard to the lead vehicle in order to observe the various effects of the warnings. The initial conditions of the driving conflict scenarios must be similar in order to isolate the system effect of the CWS. (Sec. 6.1, 6.2, 6.8, and 6.11.2.)
- CWS reduced the risk of crashes with vehicles ahead in that braking occurred generally earlier in the conflict for trucks with a CWS than for trucks without it. This effect was more pronounced where the lead vehicle was braking above 0.13g. (6.11.2)
- The CWS effect on braking level by truck drivers generally was not consistently different than for trucks without CWS. (Sec. 6.11.2 and 6.11.3.)
- CWS affect on ECA Improvement was generally favorable reaching a maximum of 60% at lead-vehicle braking levels of 0.10-0.14g and a value of 40% generally. (Sec. 6.11.2 and 6.11.3.)
- Even though a rather low percentage (22%) of CWS warnings came from threatening targets (target in following-vehicle lane), the CWS effectiveness was nevertheless evident for reducing risk for the driver. (Sec. 6.11.4 and 6.11.5.)
- Across individual trucks used in the FOT, the median driver reaction time ranged from 1.83 to 1.88 seconds for various vehicle types. (Sec. 6.13.3.)
- Baseline vehicles without an active CWS driver display, and therefore no audible or visual warnings, recorded 50% to 79% more potentially dangerous, fast-closing VORAD® Alarm 9 events than Test and Control vehicles with an active driver display. (Sec. 7.1.)
- The CWS frequency of repairs was less than half the frequency of repairs of the ABS. (Sec. 7.2 and 7.3.)
- The frequency of all types of warnings did not change appreciably with vehicle speed or following interval. (Sec. 6.14.7.1 and 6.14.7.2.)
8.1.3. Observations Regarding Cruise Control Systems
- Highway tractor-trailer combination vehicles equipped with cruise control operate with the cruise control activated 34% of the run-time, accounting for 40% of the miles traveled. (Sec. 7.1.)
- Across all individual vehicles in the dataset, the median value of cruise control usage showed lower frequency in Control and Test vehicles than in Baseline vehicles. (Sec. 7.1.4.)
- In driving conflicts, cruise control does not reduce risk appreciably over manual driving in the critical TTCb range of 0-5 seconds. (Sec. 6.12.1.)
- As for ECA Improvement using cruise control vs. manual driving, cruise control does not afford noticeable improvement. ACC appears to offer some advantage over CCC in reducing the risk of a conflict (Sec. 6.12.2.)
- Control and Test trucks show an increase in following interval for manual driving of 5% over Baseline trucks.
- Control trucks using cruise control show a following interval improvement of 10% over Baseline; and Test trucks using cruise control show a following interval improvement of 5% over Baseline. (Sec. 6.12.3.)
- ECA Improvement does not appear to be affected by the use of ACC and CCC compared to manual. (Sec. 6.12.4)
- Cruise control performs as expected in that it is not designed to be a full alternative to the driver’s response in a driving conflict. CCC is designed primarily to reduce driver fatigue. The ACC system tested does not provide significant acceleration/deceleration with loaded tractor-trailers. (Sec. 6.12.4 and 6.14.7.3.)
- Lane change (flying pass) maneuvers without cruise control are made at lower speeds than the same maneuver with the use of cruise control in all vehicles. (Sec. 6.14.7.4.)
- Lane change (flying pass) maneuvers after a cut in are performed at higher following intervals during manual driving than when cruise control is being used. (Sec. 6.14.7.6.)
- Using cruise control, lead-vehicle cut-in maneuvers show small differences (<10%) between vehicle types in the range, range rate, and following interval parameters. Manual driving during lead-vehicle cut-ins shows virtually no difference in these parameters. (Sec. 6.14.7.6.)
8.1.4. Observations Regarding Disc Brake Systems
- The projected useable life of disc-brake wear components (rotors and pads) exceeds the expected useable life of standard drum brake components (drums and shoes) and is competitive with premium Extended Life (EX) drum brake components. (Sec. 7.3.)
- The frequency of repairs for drum brakes is 1.7 times the frequency of repairs for disc brakes. (Sec. 7.3.)
- Disc-brake stopping distances are 7.2% (as received) and 10% (new) shorter than drum-brake stopping distances for 60 mph loaded stops. Disc-brake stopping distance performance is slightly better than drum brakes for 60 mph loaded stops. (Sec. 7.5.)
- Disc-brake stopping distances are 33% (as received) and 22.3% (new) shorter than drum-brake stopping distances for 75 mph loaded stops. Disc-brake stopping distance performance is much better than drum brakes for 75 mph loaded stops. (Sec. 7.5.)
- The stopping distance performance of both drum and disc brakes deteriorate less than 15.5% after over 300,000 miles of normal service (60 mph loaded stops). (Sec. 7.5.)
8.2. Conclusions
The Advanced Safety Systems performed well in the FOT. During the 3 years of data collection there were no major system failures. The durability and reliability of the Advanced Safety Systems was as good as or better than comparable standard systems. Analysis of the CWS was done on the basis of specific, similar initial conditions of driving conflicts in order to isolate the actual effects on driver behavior. The CWS provided a significant risk reduction for rear-end collisions by allowing more time for the driver to react to high-risk, fast-closing situations. Drivers generally adopted longer following-distance driving behavior while using CWS. CCC and ACC do not appear to materially reduce risk of a collision. Disc-brake stopping distance performance is better than that of drum brakes, and their frequency of repair is much lower. Although the cost for disc brakes is currently somewhat higher than drum brakes, it is expected to decrease to a competitive level with full industrialization. The results of the FOT indicate that the Advanced Safety Systems provide improved safety with regard to rear-end collisions and are ready for commercial deployment.
8.3. Lessons Learned
Volvo offers the following suggestions for future FOTs based on lessons learned in the IVI FOT:
- In order to reduce down time and lost data, the data acquisition system functionality should be verified and validated under expected operating conditions in each vehicle prior to releasing the vehicle into the FOT.
- Prior to fielding test vehicles, the intended analysis approach should be documented in detail to assure that the needed data is collected and is in the required format.
- Data collected should be analyzed as early as possible (on a preliminary basis) to assure that all data required to support the analysis will be recorded. The early analysis will identify problem areas.
- In order to assure that the FOT is successful, top level management active support, dedicated personnel, and regularly scheduled status review meetings are required. This enables expedited problem solving.
- The independent evaluator should be deeply involved with the FOT planning, execution, problem identification, problem resolution, and data analysis from the start, not after the fact.
REFERENCES
1. Battelle Final Report, Phase II Driver Survey Report: for the Volvo Intelligent Vehicle Initiative Field Operational Test, Prepared for U.S. DOT, Contract No. DTFH61-96-C-00077, Task Order 7721, U.S. DOT ITS Electronic Library No. 14122.October 28, 2004, [http://ntl.bts.gov/lib/jpodocs/redirect/REPTS_TE/14122.htm].
2. U.S. DOT, NHTSA 1996 General Estimates System Coding and Editing Manual, 2001 Pre-collision Data pg. 187 and 199, [http://www-nass.nhtsa.dot.gov/nass/GES/96Ges.pdf].
3. Peter G. Martin, August L. Burgett, Rear-End Collision Events: Characterization of Impending Collisions; 1st Human Centered Transportation Simulation Conference, The University of Iowa, Iowa City, Iowa; November 4-7, 2001, Affiliation: National Highway Traffic Safety Administration, NRD-12, Room 6220; 400 7th Street SW; Washington, DC 20590, Primary Author: Peter G. Martin; Email: peter.martin@nhtsa.dot.gov: Phone (202) 366-5668, Rev. Date: October 10, 2001.
4. Radlinski & Associates (2000), FMVSS 121 Certification Test Report for Volvo Trucks North America, Test No. RAI-VOL-47, Test Report for Volvo Trucks North America.
5. Radlinski & Associates (2003), An Evaluation of Braking Performance and Compatibility of Tractors and Trailers with Disc and Drum Brakes, Test No. RAI-VOL-55, Test Report for Volvo Trucks North America.
6. August L. Burgett, Robert J. Miller, Jr., “Using Parameter Optimization To Characterize Driver’s Performance in Rear-End Driving Scenarios,” 18th ESV Paper, Paper Number 305
APPENDICES
The appendices are located in separate files on the DOT website.
[1] A probability distribution (e.g., histogram) illustrates the probability that a variable takes on a value x (or range of values defined by the x-bin size). A cumulative probability distribution is then the probability that the variable takes a value less than or equal to x, and is calculated as the integral from x-min to x divided by the integral from x-min to x-max (the divisor normalizes the function such that it varies from 0 to 1).


