
Appendix C. Parking Lot Transactions
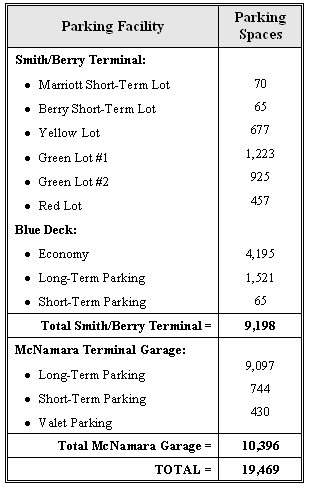
The Wayne County Airport Authority collects and archives parking revenues and transaction counts. The February 2002 through February 2004 data from the Smith/Berry Terminal and McNamara Terminal were provided in support of this evaluation. These parking data, collected by parking facility and location, are aggregated into monthly totals and daily averages. The Smith/Berry Terminal and McNamara Terminal parking facilities consisted of short-term, long-term, economy, and valet parking spaces. Table 13 shows the parking facilities and number of parking spaces available near the Smith/Berry and McNamara Terminals as of February 2004.
Table 13. Number of Parking Spaces Available
The Smith/Berry Terminal and McNamara Terminal parking lot payment transactions for the period from January 2002 through February 2004 are described and summarized in this section. The payment transaction data consisted of counts of monthly transactions from short-term, long-term, economy, and valet parking facilities. After the GLITS airport components are deployed, these baseline data will be used to examine the impact of traveler information on parking availability at the terminal parking facilities.
In 2002 and 2003, there were a total of 2,309,273 and 2,515,599 transactions, respectively. Table 14 shows the number of parking transactions in 2002-2003 by parking terminal. Despite a 15-percent decrease in transactions at Smith/Berry, a nearly 35 percent transaction growth at the McNamara Terminal resulted in an overall growth of just less than 9 percent between 2002 and 2003.
| Parking Terminal | 2002 | 2003 | Change |
|---|---|---|---|
| Smith/Berry | 1,196,468 | 1,014,659 | -15.1 percent |
| McNamara | 1,112,805 | 1,500,940 | +34.9 percent |
| Total | 2,309,273 | 2,515,599 | +8.9 percent |
Figure 19 shows the total number of parking transactions by month. The top line (green) represents the total number of transactions. The four lines below the top line shows the monthly parking transactions the types of parking transactions (short-term, long-term, economy, and valet) that contributed to the total. In general, short- and long-term transactions were the most common transactions and contributed the most to the total transaction count.
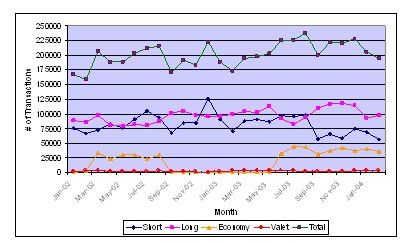
Figure 19. Parking Transactions per Month.
Figure 20 shows the total number of parking transactions by month at the Smith-Berry Terminal. Once again, the top line (green) represents the total number of transactions and the remaining lines below the top line shows the short-term, long-term, economy, and valet monthly parking transactions. In general, short-term and long-term transactions were the most common transactions until about June 2003 when the economy parking lot became operational and reduced the number of long-term transactions.

Figure 20. Parking Transactions at Smith-Berry Terminal.
Figure 21 shows the total number of parking transactions by month at the McNamara Terminal. Because the McNamara parking facility opened in late February 2002, the parking transactions in January and February do not represent an entire month of transactions. From March 2002 through August 2002, economy parking was available; however, beginning in September 2002, economy parking was discontinued. This resulted in an increase in long-term parking transactions and no significant change in the number of short-term transactions. In the fall of 2003, a change in the mix of available short- and long-term parking increased the number of long-term transactions and reduced the number of short-term transactions.
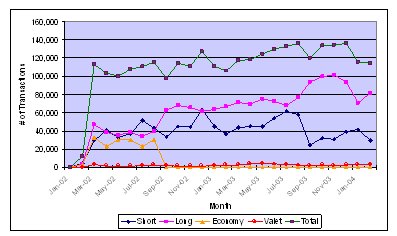
Figure 21. Parking Transactions at McNamara Terminal.
The erosion in the number of transactions also can be seen in the average number of daily transactions shown in Figure 22. Prior to the McNamara parking facility opening, the average number of daily transactions at Smith-Berry was about 5,200 transactions. After the McNamara parking facility opened, the number of Smith-Berry transactions fell to approximately 3,000 per day, and remained constant through 2003. Conversely, the McNamara transactions grew from about 3,000 transactions in early 2002 to about 4,000 transactions by mid-2003.
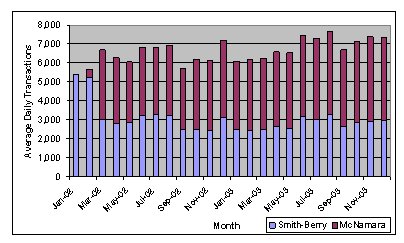
Figure 22. Average Daily Transactions.