
Appendix D. Vehicle Crashes: February 2002 through January 2004
The Wayne County Airport Authority, Division of Public Safety, provided crash data from State of Michigan Traffic Crash Reports. The crash data included all vehicle crashes occurring on the airport roadways and parking areas. The crash statistics cover a 2-year period from February 2002 through January 2004, and provided data that characterized crashes by: Crash Date; Time Period; Location; Road Condition; Type of Crash; and Accident Severity.
Specific crash information was coded to ensure privacy and facilitate analysis and presentation of summary statistics. Table 15 shows the crash statistics template used to consolidate the Traffic Crash Report data as reported by morning (AM), mid-day, early evening (PM), or Night (after 7:01 p.m.). Specifically, time was categorized into one of four time periods: AM Peak (6 to 9 a.m.), Mid-day, PM Peak (4 to 7 p.m.), or Night. Table 15 presents a template regarding the crash statistics pertaining to date month, day, year, crash type, and level of severity.
Table 15. Crash Statistics Template
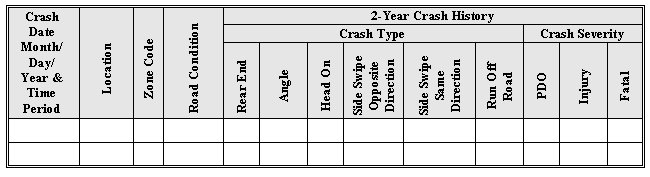
Location of crash was recoded into one of five airport zones: I-275 Access Road area; McNamara Terminal area; Smith Terminal area; I-94 Access Road area; or Green/Yellow Surface Parking Lots.
Road condition as reported in the original crash report was denoted as: Dry; Wet; Icy; Snowy; or Slushy.
One of six different crash types was indicated to identify how the crash occurred: rear-end; angle; head-on; side swipe-opposite direction; side swipe-same direction; or run off road.
Crash severity also was defined as either: property damage only (PDO), injury, or fatal.
The vehicle crashes on the airport roadways and parking areas during the 2-year period from February 2002 through January 2004 are presented in this section. These baseline analyses provide a snapshot characterizing the crashes in terms of the number per year (and month), location, time of day, road conditions, type of crash, and severity. The graphs presented in this section often provide both a count of the frequencies and the percentage of the total occurrence. This is done to not only show the magnitude of a particular category but also its contribution to the total number of occurrences. These baseline data will be used in the Phase III After analysis to determine if the number and severity of vehicle crashes on the airfield roadways are reduced following deployment of the GLITS integration components.
Yearly and Monthly Crashes
Although the number of crashes in 2002 and 2004 consists of data for partial years, Figure 23 shows the total number of crashes by year. For the 24-month base case period there were a total of 325 total crashes; in February through December 2002 there were 160 crashes (about 49 percent of the total); January through December 2003 had 148 crashes (about 45 percent); and January 2004 had 17 crashes (about 5 percent).
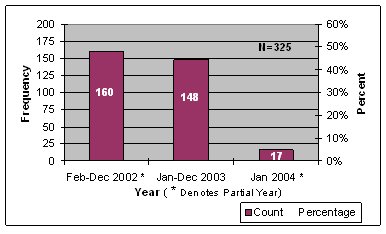
Figure 23. Crashes by Year.
Reviewing the total crashes per calendar year is not the most interesting view of airport roadway and parking lot crashes. A more insightful view of crashes is the number of crashes by month as shown in Figure 24. The individual bars show the number of crashes for each of the 24-month baseline period. The dashed line depicts the average number of crashes per month (about 13.5). In this view the variability (or range) for certain months between years are readily apparent. Several months are above and below the average crash rates.
To determine if there are statistically significant differences in the number of crashes per month, a Chi-square statistic was used to compare the actual and expected number of crashes. Using an expected number of crashes per month of 13.5 (the average number of crashes per month for the 2-year period), the Chi-square statistic indicated that the difference between actual and expected number of crashes was large enough to be statistically significant (χ2 = 42.3846, p=0.0082) for certain months. Although the Chi-square test does not indicate the particular month(s), closer examination of Figure 24 clearly shows that May 2002, July 2003, and December 2002 were considerably different from the average crash rate. These differences suggest that the variability may be due to some additional factor(s) inflating (or deflating) the number of crashes. At this point in the analysis, a deeper investigation into these crashes is needed to produce a reasonable explanation.
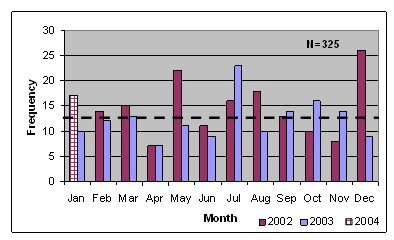
Figure 24. Crashes by Month and Year.
Figure 25 shows the average number of crashes by month of the year. This graph shows how many crashes (on average) occurred during particular months. By averaging the number of crashes per month (in effect combining the months for both years), the highs and lows for particular months becomes less extreme and provides another way to estimate of the number of crashes per any given month.
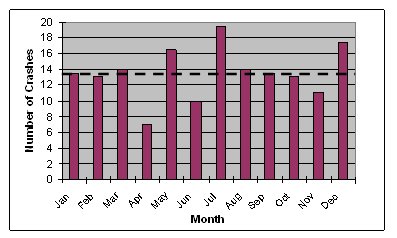
Figure 25. Average Monthly Crashes.
To determine if the actual number of crashes was statistically different from the expected (average) number of crashes, a Chi-square statistic was again calculated. The Chi-square statistic indicated that the actual number of crashes did not differ enough to be statistically significant at the 0.05 level of significance (χ2 = 18.1262, p=0.0787). Consequently, averaging over 2 years dampened the extreme months and resulted in an estimate of baseline crashes that were more in line with an expected number of crashes.
For the analysis in Phase III of the evaluation, the difference in number of Before and After crashes will be investigated in a similar fashion to determine the statistical reliability of the differences. In addition, factors such as use of ITS technologies, air passenger counts, month of the year, location, time of day, and road conditions will be examined to determine possible explanations for changes in the number of crashes.
Location of Crashes
The crash locations were recoded into one of five airport zones: I-275 Access Road area; McNamara Terminal area; Smith Terminal area; I-94 Access Road area; or Green/Yellow Surface Parking Lots. Figure 26 shows the location of crashes. For the 325 crashes recorded over the 2-year period, most crashes (55 percent) occurred in the I-94 access road location. Given the higher utilization of the I-94 access road (about 2:1 during non-peak traffic days and 3:1 on peak traffic days) the higher percentage of crashes is not surprising. The other locations had substantially fewer crashes: McNamara Terminal area (18 percent); Smith Terminal area (17 percent); I-275 access road (10 percent); and Green/Yellow Parking Lots (<1 percent).
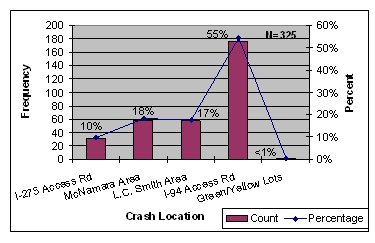
Figure 26. Location of Traffic Crash.
Time Crashes Occurred
The reported time of crashes occurred were categorized into four time periods: AM Peak (6-9 a.m.), Mid-day, PM Peak (4-7 p.m.), or Night. Figure 27 shows the number and percentage of crashes by time period. As shown in Figure 27, most crashes occurred during the Mid-day period (34 percent), followed by PM Peak (28 percent), AM Peak (20 percent), and Night (18 percent).
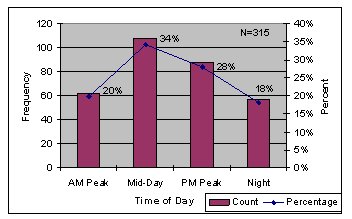
Figure 27. Time of Day Traffic Crash Occurred.
Road Conditions During Crashes
The road condition as reported in the original crash report was classified into five categories: Dry; Wet; Icy; Snowy; or Slushy. Figure 28 shows number and distribution crashes. About 75 percent of crashes (244 out of 325) occurred when the roadway was dry; about 19 percent (62 of 325) of the crashes occurred when the road was wet; and another 6 percent occurred when the road was icy, snowy, or slushy. However, comparing these figures to archived weather conditions suggests weather was not a primary factor in crashes.
During the 24-month baseline period (February 1, 2002 through January 31, 2004) there were a total of 242 days with rain (about 33 percent), 119 days with a trace or more of snow (about 16 percent), and a total of 354 days with either rain or snow precipitation (about 48 percent).30 However, although about 48 percent of the days had some precipitation, a disproportionate number of crashes occurred when the road condition was dry (about 75 percent). Therefore, poor road surface conditions due to snow or rain were not deemed to be a primary factor in crashes as evident in the reported road conditions in the original crash report data.
This conclusion seems to be supported in Figure 29 which shows the number of crashes per month plotted with the number of precipitation days per month. The dashed line indicates a perfectly proportional fit between number of precipitation days and the number of crashes. As seen in the figure the number of crashes is not perfectly proportional to the number of precipitation days. In fact, after calculating correlation coefficient to measure the relationship, the results indicate that there is a weak relationship (r=0.1057) between crashes and precipitation.
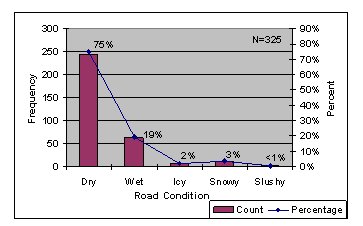
Figure 28. Road Condition During Traffic Crash.
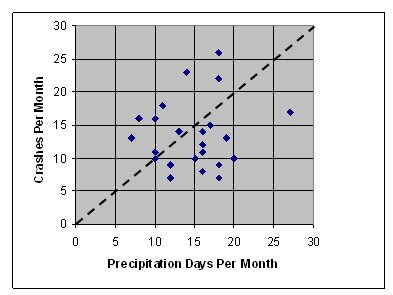
Figure 29. Monthly Crashes versus Precipitation Days.
Type of Crashes
Six different crash types identified how the crash occurred: rear-end; angle; head-on; side swipe, opposite direction; side swipe, same direction; or run off road. Figure 30 shows the frequency and distribution of crash types for 294 out of 325 crashes (31 crashes were excluded due to missing crash type designations).
With about 40 percent of all crashes, a rear-end type crash was the most common. The second most common type, at about 35 percent, was a side-swipe with both vehicles traveling in the same direction. Those that were found to occur about 10 percent or less included: angle (10 percent); run-off road (7 percent); head-on (5 percent); and side swipes in opposing directions (2 percent).
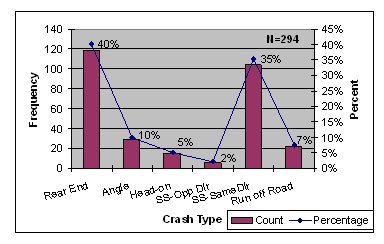
Figure 30. Type of Traffic Crash.
Severity of Crashes
The severity of crashes was classified into either PDO; injury; fatal; or PDO/injury. Figure 31 shows the frequency and percentage of 324 traffic crashes (one crash was excluded due to missing a crash severity). The majority of crashes (288 crashes) or 89 percent was PDO. Injury crashes accounted for about 10 percent of the total crashes. With 1 percent or less, fatal or PDO/injury crashes were the least common.
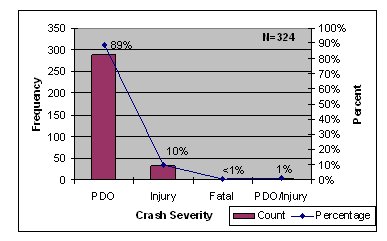
Figure 31. Severity of Traffic Crashes.
30 Based on archived weather conditions for Detroit Metropolitan Airport available at The Weather Underground Website: <www.wunderground.com>.