4.0 AMS Methodologies
Three findings emerge from the analysis of capabilities found in existing AMS tools:
- Each tool type has different advantages and limitations, and is better than other tool types at some analysis capabilities. There is no one tool type at this point in time that can successfully address the analysis capabilities required by the ICM program. An integrated approach can support corridor management planning, design, and operations by combining the capabilities of existing tools.
- Key modeling gaps in existing tool’s capabilities include: a) the analysis of traveler responses to traveler information; b) the analysis of strategies related to tolling/HOT lanes/congestion pricing; and c) the analysis of mode shift and transit.
- Interfacing between travel demand models, mesoscopic simulation models, and microscopic simulation models presents integration challenges that can be addressed by identifying interface requirements that focus on: a) maintaining the consistency across analytical approaches in the different tools, and b) maintaining the consistency of performance measures used in the different tool types.
The proposed generic AMS methodology encompasses tools with different traffic analysis resolutions. Three classes of simulation modeling approaches – macroscopic, mesoscopic, and microscopic – are considered essential components of a general AMS methodology. To conduct the analysis of a corridor where ICM approaches and strategies may be implemented, the AMS capabilities need to provide for the interaction of various aspects of macroscopic-, mesoscopic-, and microscopic-level analysis capabilities.
The individual modeling approach developed for a specific corridor might involve significant tailoring of the general methodological approach. Depending on the scope, complexity, and questions to be answered within a specific corridor, there may be more or less emphasis on each of the three general model types and their interaction.
Developers of traffic analysis tools have recently started moving towards integration of analysis tools of various scales (macroscopic, mesoscopic, and microscopic) within one analysis framework. For ICM AMS purposes, there are two major limitations in this tool-specific integrated analysis approach:
- This type of integrated “super model” is one size fits all. Pioneer Sites already have most models that are needed for ICM AMS – conducting the AMS in an integrated model framework would be more expensive than the proposed approach and would take more time to implement, because a new super-model would need to be created from scratch for each Pioneer Site.
- Many of the new commercially available integrated tools are too new as research concepts for practitioners to pursue now for ICM AMS. Many of these integrated tools have not been fully debugged and are frequently challenged when applied in complex settings.
Different ICM applications will call for different levels and forms of model integration. For example, assessing the operational efficiency at network junctions and interfaces requires the integration of mesoscopic and microscopic models; whereas, assessing modal shifts calls for the use of all three classes in a coherent manner (i.e., using macroscopic models for demand estimation, mesoscopic models for flow re-distribution, and microscopic models for traffic control optimization).
The proposed ICM AMS methodology will be adapted for and implemented on the Test Corridor. Emphasis has been placed on choosing a methodology that provides the greatest degree of flexibility and robustness in supporting subsequent tasks for the Test Corridor and AMS support of Pioneer Sites.
This chapter outlines a range of potential analytical approaches for the assessment of corridor operations in general, and how those methodologies can be adapted to address the specific requirements of individual corridors.
4.1 AMS Framework
The proposed AMS methodology includes macroscopic trip table manipulation for the determination of overall trip patterns, mesoscopic analysis of the impact of driver behavior in reaction to ICM strategies (both within and between modes), and microscopic analysis of the impact of traffic control strategies at roadway junctions (such as arterial intersections or freeway interchanges). The proposed methodology also includes the development of a simple pivot-point mode shift model and a transit travel time estimation module, the development of interfaces between different tools, and the development of a performance measurement/benefit-cost module. Figure 4.1 presents a summary depiction of the proposed analysis framework.
In the AMS framework, macroscopic, mesoscopic, and microscopic traffic analysis tools will interface with each other, passing trip tables and travel times back and forth until convergence is achieved between consecutive iterations that produce travel times and number of trips that differ less from one iteration to the next. Once convergence is achieved, performance measures will be calculated and benefits (such as travel time savings) will be evaluated and compared to deployment costs to produce benefit-cost ratios associated with each scenario/alternative. With the help of benefit-cost information, alternatives can be ranked and a roadmap can be produced outlining the implementation timeline for ICM strategies. Following is a description of the components of the AMS framework.

4.2 Macroscopic Travel Demand Forecasting Models
These models typically used in metropolitan planning applications have a role in AMS corridor analysis. The structure of these models supports the analysis of mode choice using mode-specific trip tables identifying trips from a traffic analysis zone to another. To adapt this trip table capability for ICM AMS purposes, a simple pivot-point mode choice model will be developed to estimate shifts due to ICM strategies. The mode choice and trip table manipulation capabilities will be able to understand most prevailing trip table formats and output trip tables in a format readable by mesoscopic-level analysis tools. The expected result from mode choice analysis and trip table manipulation will be a corridor-based trip table or tables that takes into account basic trip impacts associated with corridor conditions, current operations, or operational changes that need to be reflected at the trip table level.
4.3 Mesoscopic Simulation Models
Models at the mesoscopic level are needed to support analysis of the dynamic impact of ICM strategies that try and induce shifts of trips from one network to another, such as pricing, corridor-specific traveler information (pre and during trip), and peak spreading. The mesoscopic models will accept and use manipulated macroscopic-level trip table information. The mesoscopic models will also to support input concerning the effects of various control strategies from the microscopic level and transit operational information that can be used to account for the impact of transit alternatives. A dynamic pricing analysis capability that works at the mesoscopic level will also support the analysis of various ICM pricing strategies, including pricing of toll facilities, parking, and transit. Most mesoscopic analysis tools are able to re-estimate the trip table provided by the macroscopic level, and provide the re-estimated trip table information in a format conducive for use at a microscopic analysis level. The re-estimation of trip tables can use archived data from detectors to check for validation purposes.
4.4 Microscopic Simulation Models
These models support the evaluation of the operational control aspects of ICM strategies, such as the retiming of signals to accommodate trip shifts from other networks; strategies that coordinate the timing of ramp meters and adjacent signals; the coordination of arterial signal timing, transit priority, and connection protection (in various combinations); and the alternative uses of managed lanes, including such strategies as conversions to bus only operations. The interactions will account for coordination with transit operations, especially rail, which will be represented through transit travel times, schedules, or both in the analysis in order to understand the corridor impacts of implementing roadway/transit cross-network ICM strategies.
Microscopic simulation analysis will output detailed travel times that can be used to augment the mesoscopic simulation analysis. This augmentation entails the conversion of operational impacts identified at the microscopic level into adjustment factors at the mesoscopic level. These factors can support the modification of the mesoscopic analysis, such that the impacts of the operational control aspects of ICM strategies can be analyzed in conjunction with the trip management/shifting aspects of those strategies.
4.5 Representation of Mode Shift and Transit Services
A known gap in the analysis of ICM is the performance and impacts of transit services when integrated in a corridor with adjacent facilities. The requirements described above for all the modeling levels require input of transit travel times in order to account for the impacts of transit in each level of the analysis. Transit travel times need to be calculated and provided by network segment and at key decision points in the corridor. This will support comparison of network and modal alternatives and facilitate the analysis of traveler shifts among different transportation modes. This analysis gap is prevalent at the mesoscopic and microscopic simulation levels. Very few of these models can actually represent a transit network, estimate transit travel times, or dynamically adjust transit travel times at road segments and different decision points. On the other hand, travel demand forecasting models do represent transit, but are not effective at estimating accurate transit travel times (both static and dynamic travel times).
The key requirements addressed by the AMS methodology and proposed solutions are outlined below.
- Demand – The capability to estimate mode shift in an environment where macroscopic, microscopic, and mesoscopic models are being used. The proposed solution is the development of a simple pivot-point mode shift model that can work with trip tables from any travel demand model, and with accurate travel times estimated by microscopic and mesoscopic simulation models. This approach has the advantages of: 1) being model and vendor neutral; and 2) being universal enough, so it can be applied to all ICM and non-ICM corridors. Specific requirements for the analysis of short-term mode shift are addressed later in this chapter.
- Supply – The capability to represent transit networks at the mesoscopic and microscopic simulation levels. Some existing microscopic simulation models (VISSIM, and to a lesser extent Paramics) have the capability to represent transit networks and estimate accurate travel times. In most cases, these capabilities are recently developed and not error-free. In Pioneer Sites that have these particular models in place, it would probably be cost-effective to use these models in the estimation of accurate transit travel times. In other ICM Pioneer Sites, a more universal approach can be employed where custom geographic information system (GIS) interfaces (based on travel demand model networks) can be used to represent transit networks and transit travel times are calculated off-line in a spreadsheet format. A depiction of this approach is shown in Figures 4.2 and 4.3.
Figure 4.2 Pivot Point Mode Shift Model – Level of Service and Mode Share Calculation
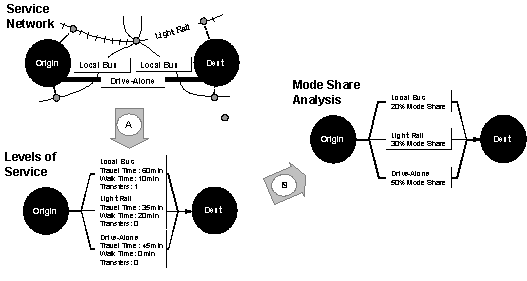
Figure 4.3 Pivot Point Approach
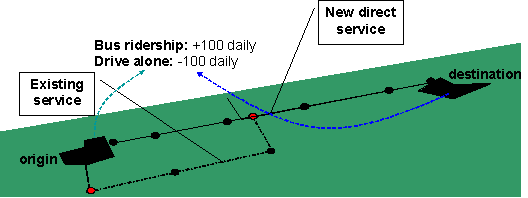
This type of dual approach can: 1) calculate transit travel times for each requested level of analysis given the corridor conditions or operations input; 2) can take input from each level of analysis to adjust transit travel times per segment and decision point; and 3) can generate output, such that it can be incorporated into the other tools as analysis adjustment factors. This approach supports the corridor analysis of transit in an ICM environment and provides the information necessary to account for the interrelation of impacts with the other operations in the corridor. This analysis feature also can be separated among all analysis levels, or consolidated with capabilities to support all analysis levels.
The “off-line” transit analysis method described above is capable of analyzing improvements to heavy and light rail, as well as improvements to bus transit. Furthermore, two microscopic simulation tools (VISSIM and Paramics) offer analysis capabilities for the transit supply side only (transit lines, transit stations, and other supply side characteristic) and can be used to estimate accurate transit travel times. Finally, transit analysis capabilities currently are being added to Dynasmart‑P (a mesoscopic simulation model) in research efforts by two universities, including the University of Arizona and Southern Methodist University.
Short-Term vs. Long-Term Mode Shift
In the ICM analysis, environment mode choice variables need to address both short- and long-term mode shifts. These traveler behaviors have similarities, but are also different enough to warrant special and separate consideration.
- Short-term mode shift – Travelers will be presented with information on delays at certain parts of the transportation network, and will then consider changing their route of travel, their mode of travel, and their time of travel in response to these delays and away from their habitual or baseline choices.
- Long-term mode shift – Travelers consider shifting modes based on historical (not real time) information on travel times and other modal characteristics. Elasticities to switch modes tend to be lower (in absolute value) in the short term.
Characteristics of short-term mode shift as compared to long-term mode shift include the following:
- Travelers have limited awareness of modal alternatives for a specific trip or tour;
- Travelers may have limited information on the availability of modal alternatives (locations of stops, schedules, etc.);
- Travelers may have constraints or circumstances that strongly influence the mode required to complete activities in the current trip or tour;
- Travelers may have constraints on rescheduling of activities that might be required, depending on the transit schedule; and
- Travelers have behavioral inertia.
Evidence of short-term dynamic mode choice indicates limited shift to transit. Based on a review of a small number of available stated-preference studies on the subject, approximately one-half of a percent to two percent of commuters would switch to public transit in a major incident using pre-trip or en-route traveler information.
Variables influencing mode choice are listed below. Variables in italics are more important for short-term mode shift, while variables in standard typeface are common to short- and long-term mode shift.
- Travel time difference between auto and transit;
- Travel time uncertainty/variability;
- Travel costs (including parking, fare, etc.);
- Walk access time, auto access time;
- In-vehicle time;
- Wait time/headways;
- Transfer time;
- Number of transfers;
- Availability of parking at transit stations; and
- Traveler knowledge of modal options.
A typical mode choice equation describing the share of trips absorbed by transit is as follows:
Transit share = f (Travel time difference between auto and transit, Travel costs, Access time, Number of transfers, Transfer time, Wait time, Headways, …)
The structure of the proposed mode shift pivot-point model will be similar across long- and short-term mode shift. However, in the case of short-term mode shift, there will be additional variables influencing mode choice, such as availability of parking at transit stations and traveler knowledge of modal options.
4.6 Modeling Traveler Information
Travelers have multiple possible responses to congestion and mitigating ICM strategies: route diversion, temporal diversion, mode change, changing travel destination, or canceling their trip are some of these traveler responses. These responses depend on when travelers receive information about congestion (pre-trip or en-route); and on what information they receive, including congestion warning, delay estimate, recommended diversion route, etc.
Evaluation studies (see U.S. Department of Transportation (DOT) ITS Joint Program Office – ITS benefits Database) have revealed that traveler responses to information vary widely. Examples are presented below.
In response to pre-trip traveler information:
- 15 percent of 511 callers changed route based on information (Boston); and
- 7 percent of travelers changed route and 5 percent changed both departure time and route due to telephone traveler information system (San Francisco).
- In response to en-route traveler information:
- 20 percent of callers switched route due to telephone traveler information (San Francisco);
- 40 percent of callers reported diverting based on variable message signs (VMS) information (Orlando);
- 5 to 10 percent travelers diverted due to VMS information (Long Island); and
- 1 percent of travelers divert due to VMS message (Hampton Roads).
Traveler information is disseminated by television, radio, the Internet, highway advisory radio (HAR), telephone-based traveler information (such as 511), and changeable message signs (CMS). The key traveler information characteristics influencing traveler responses include accessibility to traveler information (including media providing traveler information, market penetration, and the travelers’ response to information); the quality of traveler information; and the location of CMS.
Traffic simulation models currently model pre-trip information as follows: based on habitual/baseline choices and on their knowledge about alternative choices, trip-makers adjust their travel route, departure time, or transportation mode based on received pre-trip information. Doing so requires modeling an explicit trip assignment based on a targeted on-time arrival. This on-time arrival-based assignment is applicable primarily to commuting trips, and other trips with different purpose (shopping trips, social/recreational trips) may be subject to departure-based assignment. Therefore, a feedback loop to adjust the trip-maker’s departure time and/or mode is needed for ICM.
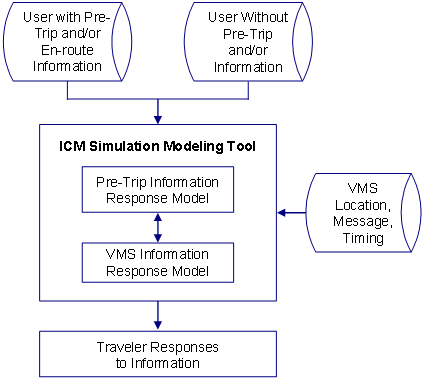
For en-route information, most simulation models currently have the capability to model CMS and general “radio” type of information for trip-makers to access. Simulation models (mesoscopic and microscopic) analyze the impacts of traveler information by separating travelers into “informed” and “uninformed” portions of the trip tables characterizing travel patterns in the study area. Market penetration can be taken into account by separating the trip tables into these portions based on existing and projected levels of traveler accessibility to traveler information. In response to an incident, “uninformed” travelers are “locked” onto their historical paths, while “informed” travelers are free to choose different routes, models, or times of travel. For modeling the impacts of CMS, simulation models use a version of “select link” analysis, in which travelers that traverse a link where a CMS is present are tracked forward to their destination, and are given the option to consider other alternatives (such as changing route, mode, or their destination). Figure 4.4 depicts these two approaches.
Figure 4.4 Modeling Traveler Information Strategies
This approach is functional enough to be used in ICM AMS for estimating responses to and impacts of traveler information. However, this approach will be supplemented and enhanced, because relatively little is known about 1) the effect of the quality of information on traveler responses; 2) how to take into account the availability of ubiquitous traveler information on the radio; and 3) the factors influencing mode shift based on traveler information. The enhancements will include the following:
- Utilizing more than two sets of traveler accessibility to information. For example, trip tables can be separated into four categories, including “fully informed all the time,” “fully informed x minutes after the occurrence of an incident,” “partially informed,” “informed only by in-vehicle radio,” and other categories.
- Conducting sensitivity analysis on the results by varying the percentage of travelers who fall in the categories listed above, or by varying other parameters that affect traveler information, such as quality of information and traveler responses.
The following two types of challenges will need to be addressed in this analysis approach:
- Establishing baseline traveler choices in each Pioneer Site – In each Pioneer Site, available information on a) past traveler choices during major incidents will be used to establish these baselines; and b) utilization of available traveler information services.
- Ensuring analytical consistency between Pioneer Sites – Assumptions used across Pioneer Sites must be consistent with local reality and with general assumptions made for all Pioneer Sites.
An alternative option of modeling traveler information using HOWLATE is described in Appendix A. If archived data exist for the corridor sufficient to conduct a traditional HOWLATE analysis (Option 1 in Appendix A), then such an effort may be quite valuable and could be conducted in the timeframe allowed for the ICM AMS effort. The results could be used to demonstrate capability in ATIS analysis, which would be helpful to the ICM effort as a whole.
4.7 Modeling Tolling, High-Occupancy Toll Lanes, and Congestion Pricing
Several congestion pricing strategies can be part of ICM. These include the following:
- Conventional road tolls, using a fixed fee for driving on a particular road;
- Time-variable congestion pricing (i.e., a fee that is higher under congested conditions than uncongested conditions);
- Cordon fees (i.e., fees charged for driving into a particular area); and
- High-occupancy toll (HOT) lanes (i.e., high-occupancy vehicle (HOV) lanes that accommodate a limited number of single-occupancy vehicles (SOV) for a fee).
To model these different congestion pricing strategies, the ICM AMS framework will need the following analysis capabilities:
- Dynamic traffic assignment, so that travelers can divert to and from another mode, route, or time of travel in response to congestion or to congestion pricing strategies;
- The ability to evaluate changes in the Value of Time (VOT) – this parameter can be uniform across all travelers, or it can be different across different zones, or vehicle classes;
- The ability to evaluate changes in toll rates – the rates can vary by vehicle class or by time of day; and
- The ability to model operations at toll plazas and other tolling locations for both manual and electronic toll collection.
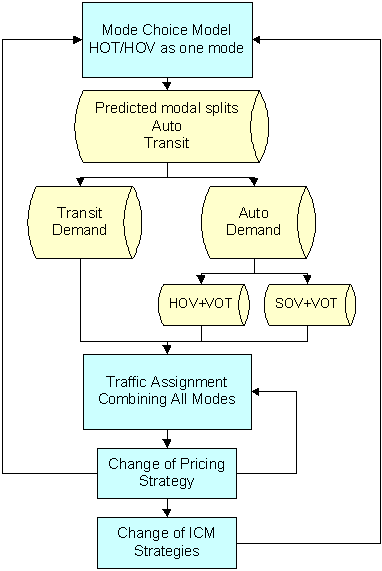
Existing simulation models have the ability to model both regular time-invariant, as well as time-dependent tolls, HOV lanes, and HOT lane utilization. However, these models do not provide the congestion pricing capability that is responsive to congestion or to the level of service in the HOT and/or general-purpose lanes. An effort may soon be underway to enhance Dynasmart-P and add the congestion pricing capability. Alternatively, a Federal Highway Administration (FHWA) spreadsheet analysis capability can be used to vary the tolls based on congestion levels; the FHWA spreadsheet can be found at “Value Pricing – Evaluation of Toll Options Using Quick Response Analysis Tools.”
Figure 4.5 Mesoscopic Simulation Modeling for ICM Congestion Pricing Strategies
4.8 Interface Requirements
This chapter defines the linkage mechanisms required to establish consistency between the modeling resolutions of the AMS candidate tools. The interfaces described in this chapter are methods commonly used by practitioners in establishing connections between different analysis tools.
In general, three types of interfaces are required to allow communications between macroscopic travel demand models, mesoscopic simulation models, and microscopic simulation models:
- An interface focusing on network features;
- An interface focusing on the temporal distribution of trips; and
- An interface focusing on the refinement/aggregation of model traffic analysis zones that generate and attract travel demand.
For example, the interface between a travel demand model and a microscopic simulation model requires that uniform peak-period travel demand from the travel demand model is transformed into a dynamic travel demand that changes every 5 to 15 minutes. This interface further requires that there is compatibility between the zonal structures and networks in the two model types. Interface components are further explained in the following sections.
Network Interface
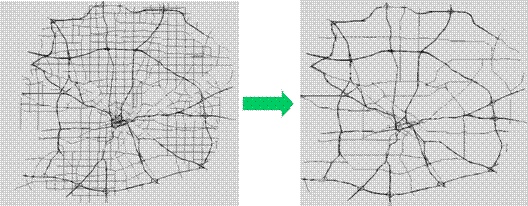
Most simulation-based traffic network modeling tools do not adopt the logic of centroid connectors for demand loading. In some tools, zonal demand is distributed over roadway links in a zone in proportion to the length of each link in this zone. If a vehicle is assigned to a trip generation link, this vehicle is directly loaded (considering capacity constraints) into this link at the appropriate time interval. The AMS network interface would be required to eliminate all centroids and centroid connectors from the starting travel demand model. In addition, the interface will need to allow the analyst to represent the network at any desired level of detail. Figure 4.6 illustrates a case in which all links that are marked as non-major arterials are eliminated from the roadway network.
Figure 4.6 A Roadway Network at Two Spatial Resolution Levels
Temporal Distribution Interface
Travel demand models provide trip demand data for the study area in terms of total number of trips between all origin-destination pairs (O-D matrix) for different time periods, such as morning peak period, evening peak period, and off-peak period. These models provide no information on how demand between O‑D pairs varies within any of these time periods. In these models, a constant, flat demand generation rate over the analysis period is assumed. However, in reality, demand generation rates vary significantly over the different departure time intervals within a given analysis period. This temporal distribution interface will provide the capability to represent travel demand dynamics over the analysis period. As shown in Figure 4.7, the interface would convert the constant demand generation rate into a time-varying rate. The pattern of this time varying rate would be an input to the interface. If no information on the pattern were available, the interface would use a default symmetric triangular pattern.
Figure 4.7 Static Versus Dynamic Travel Demand Loading Patterns for a Given O‑D Pair

Zonal and Demand Interface
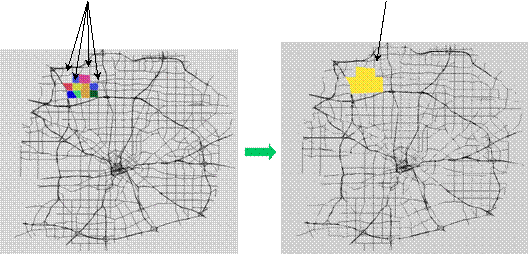
Simulation-based dynamic traffic assignment tools require intensive shortest path computations and storage from all nodes in the network to all zone centers. As the number of destination zones in the network increases, the running time of these simulation models significantly increases. Furthermore, the size of traffic analysis zones in travel demand models is typically much larger than zone sizes in simulation models. These different levels of zonal resolution mandate the development of an interface that would link the zonal representations of different tools. Finally, when extracting a piece of a travel demand model network to create a microsimulation model network, external zones may need to be aggregated and zones at the border of or within the microsimulation area may need to refined.
This interface will provide the capability to represent the zoning system of the study area at any user-specified level of aggregation. As illustrated in Figure 4.8, based on their spatial locations, the interface would aggregate several zones into one big zone or disaggregate one big zone into smaller zones. The O‑D demand matrix associated with the new zoning system would also be generated.
Examples of model interfaces are presented in Appendix B.
Figure 4.8 Example of Zonal and Demand Aggregation
