5.0 Applicable ICM Techniques
Integrated Corridor Management is a complex topic. With seven possible transportation modes (arterial roadway, limited access roadway, roadway with managed lanes, toll roads, transit utilizing roadway right-of-way, transit using separate/exclusive right of way, and waterways), the number of possible combinations and permutations is 27 or 128 possible combinations. It is no wonder that no commercial-off-the-shelf (COTS) products for ICMS exist today. Adding to this the variations in configuration, capacity, and demand for each transportation mode in any given corridor, the complexity of corridor management might almost seem insurmountable.
5.1 ICM Strategies
There are some common threads through all of the ICM strategies. The events and scenarios used to justify ICMS deployments have common factors:
- Recurring congestion (capacity overload)
- Incidents (temporary decreases in capacity)
- Planned events (need to temporarily re-allocate capacity from one use to another; divert demand to alternate modes, routes or schedules; and restrict capacity to prevent capacity overload or enhance safety of roadside workers)
- Emergency events (implement pre-planned disaster plans to re-allocate capacity from one use to another, divert demand to alternate modes or routes, or restrict capacity to prevent capacity overload)
The response strategies also have common threads:
- Information sharing/distribution
- Coordinates responses to reduce the impact of events on system capacity.
- Allows traveling public and trip planners to select alternative routes, schedules, and modes of travel based on current or anticipated travel conditions.
- Improvement of operational efficiency of network junctions & interfaces
- Signal priority for transit – Gives higher priority to high occupancy vehicles (HOV) to increase capacity (volume of people moved) of existing assets.
- Signal pre-emption/"best route" for emergency vehicles – Optimizes existing capacity for enhanced public safety.
- Multi-modal electronic payment – Decreases capacity bottlenecks by increasing the number of vehicles/passengers that can be processed per hour and facilitate shifts between travel modes and networks.
- Transit hub connection protection – Decreases travel time (for some) and increases passenger satisfaction to encourage shifts of travel demand to under-utilized transit capacity.
- Multi-agency/multi-network incident response – Reduces the impact of events on existing system capacity.
- Coordinated operation between freeways and arterials – Coordination of ramp metering with arterial signals keeps freeway capacity restrictions from causing disproportionate arterial capacity restrictions or overloads. Coordination of off-ramp queues with arterial signal systems keeps arterial capacity restrictions from causing disproportionate freeway capacity restrictions or overloads.
- Coordinated operation between arterial traffic and rail transit traffic – Allows better utilization capacity at intersections un-affected by rail operations to mitigate the capacity reduction caused by closed crossings congruent with rail operations.
- Accommodation/Promotion of cross-network route and modal shifts
- Modify arterial signal timing to accommodate traffic shifting from freeway – Presumably this would allow additional traffic volume to shift from freeways to arterials without allowing the traffic volumes to reach critical limits on the arterial system. The major concern with this strategy, as expressed by stakeholders, is that freeway capacity is usually several times the potential capacity of adjacent arterial roadways, and un-restricted "dumping" of freeway demand on adjacent arterial roadways can result in arterial gridlock (capacity overload).
- Modify ramp metering rates to accommodate traffic, including buses, shifting from arterials – This could involve giving priority to transit vehicles or HOV traffic to promote higher efficiency transportation modes, but could also involve throttling ramp metering rates to keep arterial traffic from overloading freeway/HOV lane capacities which results in congestion.
- Modify transit priority parameters to accommodate timelier bus/light rail service on arterials – This should increase the volume of people moving through the corridor while reducing the travel time for transit travelers. This may be implemented as a function of the passenger count and amount of time a transit vehicle must be behind schedule before signal pre-emption is allowed.
- Promotion of Network Shifts
- Promote route shifts between roadways via en-route traveler information – Similar to the second bullet under "information sharing/distribution" but expressed as a method to reduce demand on a roadway by shifting the traffic volume to alternate freeway, toll-way, or arterial traffic routes.
- Promote modal shifts from roadways to transit via en-route traveler information devices – Similar to the above strategy, but specifically directed at reducing demand on a roadway by shifting the traffic volume to un-utilized capacity on transit systems.
- Promote shifts between transit facilities via en-route traveler announcements – Similar to the "information sharing/distribution strategy," but directed at reducing demand on a transit link by shifting the travel volume to alternate transit routes.
- Re-route buses around major incidents – Similar to promoting route shifts between roadways but directed at transit vehicles.
- Management of capacity
- Lane use control (reversible lanes/contra-flow) – The strategy reduces one form/direction of capacity in favor of increased capacity in a direction or form that is more efficient or in higher demand.
- Convert regular lanes to "transit-only" or "emergency-only" – This strategy reduces one form/direction of capacity in favor of higher efficiency transportation modes (transit vehicles) or to promote public safety (emergency vehicles) during emergencies.
- Add transit capacity by adjusting headways and number of vehicles – This strategy adds capacity (passenger miles per hour) but assumes that the transit agency has the additional vehicles and personnel to provide the capacity.
- Add transit capacity by adding temporary new service – This strategy can bridge gaps caused by loss of service on other transit routes or where there is a temporary demand surge associated with a planned event. This strategy also assumes that the transit agency has the additional vehicles and personnel to provide the capacity.
- Coordinate scheduled maintenance and construction activities among corridor networks – This strategy is directed at coordinating activities that will reduce transportation capacity in the corridor so that remaining capacity is sufficient for normal demands, or alternate capacity is provided to accommodate the demand shift from capacity restricted locations.
5.2 ICMS Tools and Techniques
While most of the research being done on arterial traffic management focuses on obtaining data for speed or travel times, it is becoming increasingly apparent that ICMS deployments will be more focused and dependent on volume and capacity data. The underlying truth is that you cannot reliably manage what you cannot measure. The review of the ICM strategies in the preceding section identifies five major strategies that the ICMS must support and how volume/capacity monitoring is critical to the strategy.
- Information sharing/distribution – Information sharing to coordinate responses and reduce the impact of events on system capacity will depend on the capability to monitor and model the impact of events on system capacity. This dependency means that it will be critical for ICMS implementations to collect real-time volume data, archive the real-time volumes, and use AMS analysis of the historical data to calculate the remaining unused capacity within the system. At least three cities are publishing arterial transportation data on web sites, using maps to display traffic volume or traffic congestion measures.
- Improvement of operational efficiency of network junctions & interfaces – Coordinated operation between freeways, tollways, HOV lanes, and arterial roadways will only be possible if real-time arterial volume and history-based capacity measures are available. Volume and capacity data can be used to assess the impact of arterial detours for freeway events, manage the impact of ramp metering queues on arterial traffic, and optimize signal timing based on system-wide conditions.
- Accommodation/Promotion of cross-network route and modal shifts – This capability focuses on changing demand (volume) on one part of the network by shifting the volume to other routes or travel modes. This capability will be dependent on the availability of current speed and volume data at the ICMS to use for modeling and to compare with historical data.
- Promotion of network shifts – This capability will also be dependent on the availability of current speed and volume data at the ICMS to use for modeling and to compare with historical data.
- Management of capacity – There is no consensus in the industry at this time about how to calculate or measure capacity. Since you cannot manage what you cannot measure, it is essential to ICMS deployments to find a way to measure capacity on a real-time basis. The most promising research published on this problem seems to indicate that managing capacity on arterial networks will require collection of real-time speed and volume data at managed intersections and the capability to model the speeds and volumes on the remainder of the network where live data is not available.
5.3 Pioneer Site Techniques
Seven of the eight pioneer sites identified collection of volume data on arterial roadways as a critical element of their planning and all of the sites identified collection of arterial speed data as a critical element. Only one pioneer site has identified a data acquisition rate at this time. Minnesota is planning to modify signal controller software to report speed and volume data at least once every two minutes. Three sites identified additional performance data that will be collected specifically to evaluate signal timing.
Most of the sites plan to collect arterial volume data by modifying existing signal system controller software to collect and report speed and volume data. In some cases, loop configurations are being modified to facilitate the data collection.
Arterial speed data will be collected from signal systems, cell phone probes, Automatic Vehicle Location (AVL) data from transit vehicles, and Automatic Vehicle Identification (AVI) data from toll tags or car license plates. Speed data will be collected and archived as either miles/hour, travel time for specific segments, or both.
With regard to the ICM strategies identified in Section 5.1, the pioneer sites provided the following information:
Information Sharing, Accommodation/Promotion of cross-network route and modal shifts, and Promotion of network shifts – Several sites indicated that mode shifting is not feasible at present because the volume/congestion information about adjacent arterials is not available to drivers who might otherwise decide to exit a freeway in favor of an arterial route during freeway congestion. Most of the sites plan to share congestion, volume, or travel time data with the public as a way to encourage mode, route, or departure time shifts. One site is considering using the ICMS to evaluate management strategies involving use of HOV lanes.
Improvement of operational efficiency of network junctions & interfaces – All of the sites had at least one strategy dependent on improving coordination between ramp metering and arterial signal systems or improving arterial signal timing to reflect a response to congestion on the freeway system or in other areas of the arterial system. Two sites indicated that the data would also be used to coordinate transit priority between vehicles and signal systems.
Management of capacity – All of the pioneer sites had at least one strategy relating to capacity management. None of the sites have prior experience with capacity management (unless one includes ramp metering as a capacity management strategy). As a result, there was no clear consensus about how capacity management would be measured, monitored, or controlled.
It should be noted that capacity management on arterials may be especially complex. Since the capacity of an intersection is a function of the signal phase and timing, capacity may need to be calculated based on real-time data such as the green times, which are not always accessible in real-time at the operations center.
All of the sites had strategies for shifting travel demand away from modes or locations with capacity problems, but none of the sites have clearly expressed how they plan to compare capacity on transit vehicles with vehicle capacity on roadways. No clear decisions were expressed about how to compare HOV capacity with traffic on other roadway segments. Only one site recognized that it would be useful to try and collect data about how many occupants were in the vehicles traveling on HOV lanes as well as passenger counts on transit vehicles so that person-miles of travel performance measures could be calculated accurately.
Where signal priority for transit vehicles was included as a management strategy, priority was based on schedule adherence criteria, and no mention was given as to weighting signal priority based on the number of passengers carried by the transit vehicle or the number of vehicles that would experience travel delays as a result of the signal pre-emption. At least one pioneer site is looking at whether it makes sense to include the passenger count and service status of the transit vehicle as a part of the evaluation process for signal pre-emption.
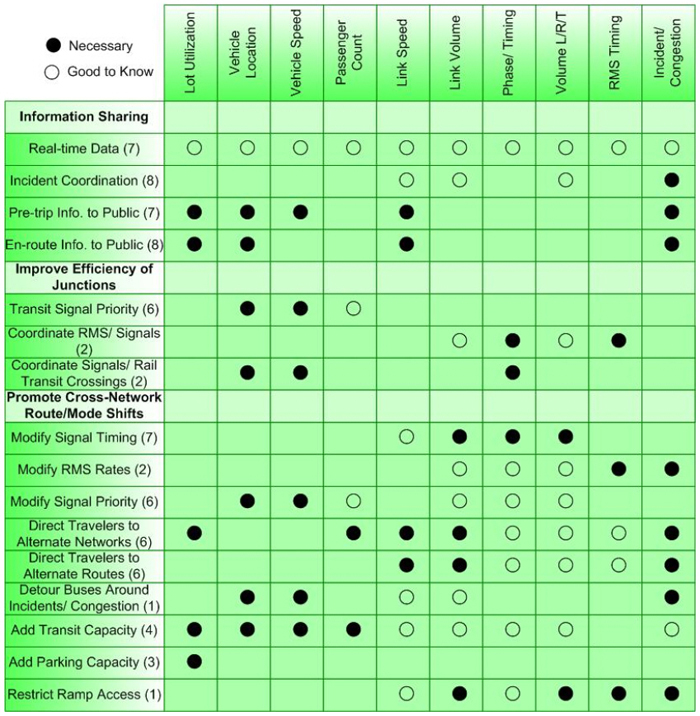
Figure 4 shows the techniques that are proposed by the pioneer sites and the data needs that relate to each technique. The number of sites implementing each technique is shown in parentheses.
Figure 4 - Corridor Management Techniques and Data Requirements