
6.0 Arterial Data Gathering Approaches
6.1 Standard Arterial Data Gathering Approaches
The most common data gathering approach for arterial data is the collection of traffic volume data using pneumatic tube counters. This data is used for traffic studies and is usually single-use, single-purpose data.
Although daily demand profiles can be constructed from data obtained by signal systems, the aggregation of data in the controllers usually destroys the fine detail required for optimization and performance monitoring of the signal systems.
Traffic signal systems traditionally relied on time of day-based timing plans. In their simplest forms, these signal systems could operate without any traffic data input. As the sophistication increased, traffic responsive systems were developed that required presence detection for the through and turn lanes and queue length detectors to establish approximate traffic volumes on each approach. When multi-intersection coordinated signal systems were deployed, additional data such as speeds, headway, and road segment occupancy were added to the data collected by the signal systems. The traffic data acquired by sensors associated with signal systems was used for signal control, but was not typically archived or even sent back to a traffic management center for display.
The advent of regional signal coordination initiatives made it more common for the data from signal systems to be collected and archived at a traffic management center. Most of the data that is archived is intended for statistical analysis, performance reporting, or planning. The data are usually "rolled up" into hourly, daily, and monthly summaries. The data collected is pre-purposed for signal control or reporting, which has resulted in some short-cuts in the design of the data collection devices and local processing [Middleton, Dan, Ryan Longmire, and Shawn Turner. State of the Art Evaluation of Traffic Detection and Monitoring Systems, Volume 1 – Phases A & B: Design. Phoenix: Arizona Department of Transportation, 2007.].
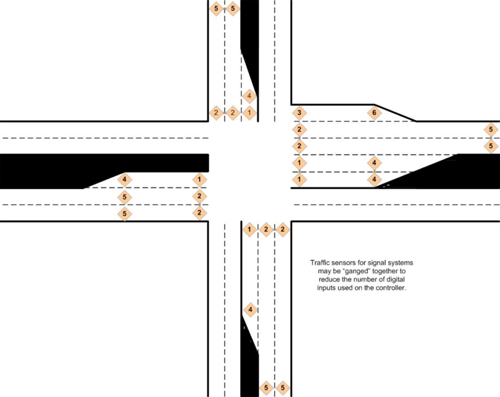
Since the signal systems only need presence detection for turn lanes and through lanes, detection is not always sensed by individual lanes. All of the left turn lanes, for example, may be ganged and input to the system as a single digital input. Queue detectors may be configured to detect that the queue has backed up to a certain point, but may not be configured to collect an accurate count of the vehicles in the queue from the monitored approach. The volume counts collected for signal control tend to focus on signal specific issues (i.e. turn counts, queue clearance, etc.). The data may or may not be specific to lanes, and in many cases only the 5 to 60 minute summaries of the data are sent back to the center. Figure 5 shows the typical sensor placement for arterial signal systems. Many arterial systems are operated without the placement of the queue sensors that are labeled 4, 5, and 6 in the figure.
Figure 5 - Typical Arterial Data Sensor Placements
The resulting data gap for operations is a result of two factors in this typical data gathering approach:
- The data is "coarse" – Real-time operations and optimization will need data specific to each lane of travel. An ICMS will need speed, volume, and occupancy data for each lane of travel. The scan/reporting times for data collection will need to change. The ICMS will need fresh data every 5 to 30 seconds. The data can be rolled up to longer time spans as needed by the ICMS or AMS software, but the reverse is not true. Data summaries of 5 to 60 minutes from the field cannot be "un-rolled" to provide real-time data.
- Location, location, location – The ICMS will need data from places where traditional signal systems do not collect data. While a few systems today collect speed data, the debate in the AMS community seems to indicate the speed data currently collected by arterial systems is not adequate, and will need to be supplemented by adding speed detection capabilities at additional locations. A similar debate about volume data indicates that additional volume count locations will be needed to support ICMS operational goals.
The most common factors cited for the absence of real-time traffic data for arterial systems are [Nee, Jennifer and Mark E. Hallenbeck. Surveillance Options for Monitoring Arterial Traffic Conditions. Olympia, WA. Washington State Department of Transportation, 2001.]:
- The lack of existing automated surveillance equipment on many arterials
- The lack of data collection capability within the intersection controllers currently operating many traffic signal networks
- The lack of communications capability and/or sufficient communications bandwidth within existing traffic signal control systems
- Insufficient technical knowledge about how to convert available data into meaningful information
- Insufficient financial and staffing resources to remedy the above conditions
The arterial data which is generally collected includes data from a vehicle detection unit and status data from a signal controller. A variety of different methods are currently used to detect a vehicle on arterials and gather data:
- Inductive loop detectors and micro-loops
- Video imaging
- Radar
While inductive loop detectors are still the most common detector, there is a strong move nationally toward replacing inductive loops with non-intrusive detection systems.
6.2 Emerging Approaches for Arterial Data Gathering
Several of the pioneer sites will be experimenting with novel technologies to collect data that would otherwise not be available to existing arterial systems. Most of these efforts are aimed at obtaining speed or travel time data.
Travel times on tollways can be calculated by using toll-tag monitoring or vehicle license plate recognition technologies. At least one site will be investigating putting toll-tag sensors on freeways and arterials to obtain travel time data.
Several sites will evaluate using AVL data from transit vehicles to calculate travel times. The Minnesota pioneer site will also be evaluating the use of cell phone probe data to calculate speeds and travel times on arterial roadways.
Cellular phone tracking is another mechanism that can be used to identify vehicles by using information about cell sector changes to estimate the location of the vehicle. This information must be matched with road segment data in order to provide more meaningful speed and travel time data [Guo, Jianhua, Brian L. Smith, and Guimin Zhang. "Information Technology Used to Evaluate Nontraditional Traffic Monitoring Systems." Transportation Research Record: Journal of the Transportation Research Board 2024 (2007): 1-7.].
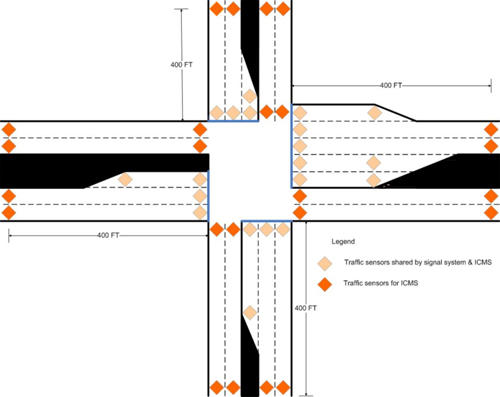
About half the pioneer sites will take additional steps to modify existing arterial traffic sensors and signal system software to allow these existing assets to collect additional data. Modifying existing signal system sensors to collect additional data is a viable option because the cost is relatively low and the data that can be collected couples well with the needs of existing and planned arterial modeling software. Most traffic sensors for signal systems are only used to measure vehicle presence. With minor modifications, the same sensors can collect speed, volume, and occupancy data (as most systems currently do on freeway systems) and from this data headway, density, turning time, queue clearance failure, and arrivals during red can be calculated. With the addition of supplemental sensor locations within or near the intersections (see Figure 6), additional metrics can be estimated including segment travel times, segment functional capacity, and average speed, volume, and occupancy for arterial segments.
Figure 6 - ICMS Arterial Intersection Sensor Configuration
There is by no means a consensus about the usefulness or viability of adding additional sensors at intersections or at mid-block. The best place to measure speed, or even the best way to measure speed, has not been resolved. Some prefer to measure travel times rather than simple speed.
Some researchers advocate mid-block speed measurement and volume counts but others note that these measurements can produce travel times that do not include the effects of the signals at the intersections. Since adding sensors at mid-block can be expensive, some researchers have proposed adding detectors at 400 feet from the intersection, far enough away to minimize intersection effects but close enough to allow existing controllers to be connected to the detectors.
Some work has been done using the detectors at the stop line to calculate speed, but the problems of how to deal with vehicles that are stopped or just starting to accelerate into the intersection in these calculations has led to disappointing results. Better results have been obtained by adding detectors at the exits to the intersection, where vehicles are presumably closer to their free-flow speed. Combining vehicle counts at these sensors with the counts at the stop line, volume can be reported by through, left turn, and right turn classifications that are more accurate in intersections with permissive turn configurations. This detector configuration also supports more accurate counts of the number of vehicles served per cycle.
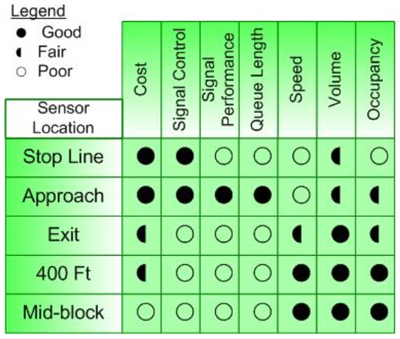
Figure 7 shows a comparison of the characteristics associated with various sensor locations that are being considered for arterial data collection.
Figure 7 – Characteristics of Various Sensor Locations
6.3 Potential/Future Approaches
6.3.1 Controller Modifications
Several research projects are focusing on modification of the traffic controller logic and reporting capabilities. One example is the Federal Highway Administration (FHWA) work on the ACS-Lite adaptive control system which focuses on collecting time-tagged sensor and signal phase data in one second slices for analysis and optimization of the signal timing. This project includes forward thinking use of National Transportation Communication for ITS Protocol (NTCIP) communication standards and methods to make the data retrieval compatible with low-speed communication networks that are most frequently found in today's signal systems.
Four controller manufacturers have implemented this data collection and reporting capability in NTCIP controllers. Field trials have shown that it is possible to use the finer granularity and temporal fidelity of the data to measurably improve traffic performance.
6.3.2 Vehicle Infrastructure Integration (VII) Probe Data
Vehicle probe data is data is collected within each vehicle and broadcast to roadside equipment for assimilation and analysis. Data gathered includes information about the vehicle operation such as speed, braking, windshield wiper state, ambient temperature, etc.
The advantages of this method are:
- Information is available on a per vehicle basis
- Data beyond speed, volume, and occupancy can be collected
The disadvantages of this method are:
- Need high percentage of vehicles with instruments installed
- Need devices installed along roadway to receive data
- Privacy concerns of public
VII represents an enormous potential for ICMS data [Shladover, Steven E. and Thomas M. Kuhn."Traffic Probe Data Processing for Full-Scale VII Deployment." TRB Paper 08-1365, presented at the Transportation Research Board 87th Annual Meeting, Washington, DC, 2008.] [Smith, Brian L, B. Brian Park, Hema Tanikella, and Guimin Zhang. Preparing to Use Vehicle Infrastructure Integration in Transportation Operations: Phase I. Richmond: Virginia Department of Transportation, 2007.]. The Michigan Department of Transportation's Data Use Analysis and Processing (DUAP) project is exploring how VII data could be used for ITS applications in a Department of Transportation (DOT) environment. One of the early findings from this effort is that even simple statistical analysis of the VII data over large areas can identify significant changes in traffic conditions without requiring detailed modeling of the roadways.
6.3.3 Passenger Vehicle Global Positioning Systems
Passenger vehicle global positioning systems (GPS) are another way to collect arterial data [Pan, Changxuan, Jiangang Lu, Dawei Wang, and Bin Ran. "Data Collection Based on Global Positioning System for Travel Time and Delay for Arterial Roadway Network." Transportation Research Record: Journal of the Transportation Research Board 2024 (2007): 35-43.]. Each vehicle would be equipped with a GPS unit. The unit is able to communicate with satellites to record time of day and latitude/longitude. A time interval in the one-second range will provide a clear representation of the path that the vehicle moves. The collected data can be analyzed to determine travel time and travel speed. GPS has an advantage over the electronic Distance-Measuring Instruments (DMI) because it can easily be associated with the geographic information systems (GIS) for analysis where DMI cannot be directly associated with GIS.
The advantages of vehicle GPS are:
- Data can be associated with GIS
- Allows for extraction of traffic signal delay
- More popular
The disadvantages of vehicle GPS are:
- Need high percentage of vehicles with GPS
- Privacy concerns of public
6.3.4 Electronic Distance-Measuring Instruments
Electronic DMI can be used to measure speed and land distance based on the sensing of pulses produced in vehicles [38]. An electronic DMI sensor is connected to the vehicle's transmission. As the vehicle is moving, pulses are received by the sensor. This method is used more for studies and planning than in a real-time application. The data is typically recorded to a portable computer and then uploaded.
The advantages of this method are:
- Ability to identify areas of delay
- Source of data for fuel consumption and emissions analysis
The disadvantages of this method are:
- Data is dependent on the driving characteristics of the driver
- Privacy concerns of public
6.4 Summary of Data Gathering Approaches
Table 1 contains a summary of the types of data that can be collected or estimated using the data gathering approaches discussed in this section.
Table 1 – Data Available from Data Collection Approaches
Device |
Data Directly Measured |
Data Calculated from Measured Values |
|---|---|---|
Inductive Loop Detectors |
Vehicle Presence |
Speed |
Video Imaging |
Vehicle Presence |
Occupancy |
RADAR/LIDAR |
Vehicle Presence |
Headway |
Automatic License Plate Recognition |
Travel Time |
Average speed |
Cellular Phone tracking |
Average speed/segment |
Estimated Volume/segment |
Transit Vehicle AVL |
Speed |
Schedule adherence |
Automatic Vehicle Identification |
Vehicle presence |
Trip origin/destination |
Passenger Vehicle Global Positioning System |
Speed |
Trip origin/destination |
Electronic Distance-Measuring Instruments |
Average speed/segment |
|
VII Probe Data |
Presence |
Average speed/segment |