
Appendix C. Data Analysis Results
Average Earliness by Route and Day of Week
| Schedule Period (End Date) | Route 1 | Route 9 | Route 10 | Route 41 | Route 42 |
|---|---|---|---|---|---|
| 4/28/2005 | -1.65 | -1.8 | -1.64 | -2.67 | -2.55 |
| 5/27/2005 | -1.69 | -1.82 | -1.39 | -2.65 | -2.59 |
| 7/7/2005 | -1.91 | -1.82 | -1.5 | -2.6 | -2.6 |
| 8/18/2005 | -1.75 | -1.87 | -1.53 | -2.8 | -2.6 |
| 10/28/2005 | -1.75 | -1.7 | -1.44 | -2.66 | -2.57 |
| 11/23/2005 | -1.88 | -1.68 | -1.45 | -2.77 | -2.66 |
| 1/27/2006 | -2.1 | -2.02 | -1.74 | -3.08 | -2.97 |
| 5/26/2006 | -1.91 | -1.94 | -1.59 | -1.89 | -2.05 |
| 9/29/2006 | -1.96 | -1.98 | -1.66 | -1.92 | -1.91 |
| 11/22/2006 | -1.88 | -1.88 | -1.78 | -1.91 | -1.81 |
| 12/1/2006 | -1.7 | -2.02 | -1.84 | -2.17 | -2.18 |
| 12/24/2006 | -1.8 | -2.05 | -1.92 | -2.06 | -2.07 |
| 1/26/2007 | -1.8 | -2.11 | -1.74 | -2.1 | -2.21 |
| 5/25/2007 | -2.51 | -1.7 | -1.5 | -1.87 | -2 |
| 6/29/2007 | -2.4 | -2.21 | -1.95 | -1.71 | -1.72 |
| 8/31/2007 | -2.42 | -1.81 | -1.6 | -2.67 | -2.64 |
| 10/4/2007 | -2.38 | -1.58 | -1.5 | -2.66 | -2.54 |
| 11/22/2007 | -2.51 | -1.66 | -1.52 | -2.69 | -2.65 |
| 1/25/2008 | -2.54 | -1.86 | -1.58 | -2.88 | -2.99 |
| 5/23/2008 | -2.4 | -1.64 | -1.39 | -2.88 | -2.82 |
| 7/4/2008 | -2.37 | -1.8 | -1.61 | -2.61 | -2.78 |
| 8/29/2008 | -2.3 | -1.59 | -1.49 | -2.68 | -2.66 |
| 5/22/2009 | -2.36 | -1.54 | -1.46 | -1.15 | -1.73 |
| 7/3/2009 | -2.27 | -1.58 | -1.57 | -2.21 | -2.1 |
| Schedule Period (End Date) | Route 1 | Route 9 | Route 10 | Route 41 | Route 42 |
|---|---|---|---|---|---|
| 4/28/2005 | -1.31 | -2.14 | -1.31 | -2.46 | -2.2 |
| 5/27/2005 | -1.39 | -2.32 | -1.08 | -2.21 | -2.17 |
| 7/7/2005 | -1.37 | -2.4 | -1.21 | -2.11 | -2.14 |
| 8/18/2005 | -1.3 | -2.21 | -1.12 | -2.21 | -2.15 |
| 10/28/2005 | -1.32 | -2.25 | -1.18 | -2.02 | -2.19 |
| 11/23/2005 | -1.47 | -2.28 | -1.07 | -2.04 | -2.25 |
| 1/27/2006 | -1.49 | -2.49 | -1.23 | -2.19 | -2.38 |
| 5/26/2006 | -1.41 | -2.33 | -1.24 | -2.04 | -2.25 |
| 9/29/2006 | -1.36 | -2.25 | -1.3 | -1.9 | -2.17 |
| 11/22/2006 | -1.46 | -2.19 | -1.1 | -1.86 | -2.23 |
| 12/1/2006 | -1.43 | -2.42 | -1.19 | -1.94 | -2.25 |
| 12/24/2006 | -1.45 | -2.34 | -1.1 | -2.19 | -2.41 |
| 1/26/2007 | -1.37 | -2.62 | -1.11 | -2.21 | -2.38 |
| 5/25/2007 | -1.34 | -2.37 | -1.28 | -2.08 | -2.27 |
| 6/29/2007 | -1.13 | -2.81 | -1.46 | -2.13 | -2.45 |
| 8/31/2007 | -1.01 | -2.56 | -1.36 | -1.92 | -2.28 |
| 10/4/2007 | -0.93 | -2.3 | -1.23 | -1.94 | -2.24 |
| 11/22/2007 | -1.13 | -2.21 | -1.23 | -1.98 | -2.17 |
| 1/25/2008 | -1.19 | -2.43 | -1.21 | -2.13 | -2.36 |
| 5/23/2008 | -1.05 | -2.34 | -1.15 | -2.06 | -2.19 |
| 7/4/2008 | -1.08 | -2.48 | -1.24 | -1.93 | -1.96 |
| 8/29/2008 | -0.99 | -2.41 | -1.23 | -1.94 | -1.87 |
| 5/22/2009 | -1.11 | -2.68 | -1.85 | -2.37 | -2.77 |
| 7/3/2009 | -1.28 | -2.39 | -1.23 | -2.36 | -2.78 |
| Schedule Period (End Date) | Route 1 | Route 9 | Route 10 | Route 41 | Route 42 |
|---|---|---|---|---|---|
| 4/28/2005 | -1.68 | -2.17 | -2.11 | -2.09 | |
| 5/27/2005 | -1.28 | -2.28 | -2.02 | -1.72 | |
| 7/7/2005 | -1.58 | -2.05 | -1.91 | -1.98 | |
| 8/18/2005 | -1.51 | -2.54 | -1.98 | -1.47 | |
| 10/28/2005 | -1.55 | -1.93 | -1.86 | -1.96 | |
| 11/23/2005 | -1.54 | -2.25 | -1.59 | -2.2 | -3.48 |
| 1/27/2006 | -1.85 | -2.25 | -1.76 | -2.69 | -4.36 |
| 5/26/2006 | -1.68 | -1.99 | -1.67 | -2.04 | -4.35 |
| 9/29/2006 | -1.66 | -1.9 | -1.64 | -1.78 | -3.19 |
| 11/22/2006 | -2.14 | -2.01 | -1.68 | -1.63 | -3.16 |
| 12/1/2006 | -2.15 | -2.13 | -1.95 | -2.25 | -4.43 |
| 12/24/2006 | -1.86 | -2.13 | -1.71 | -2.09 | -3.64 |
| 1/26/2007 | -1.67 | -1.94 | -1.95 | -1.99 | -4.49 |
| 5/25/2007 | -2.6 | -3.73 | -3.22 | -1.73 | -3.49 |
| 6/29/2007 | -2.54 | -3.74 | -3.7 | -1.3 | -1.89 |
| 8/31/2007 | -2.3 | -3.64 | -3.27 | -1.88 | -2.74 |
| 10/4/2007 | -2.56 | -3.92 | -3.42 | -1.77 | -2.64 |
| 11/22/2007 | -2.67 | -4.71 | -3.69 | -2.18 | -3.27 |
| 1/25/2008 | -2.46 | -4.32 | -3.43 | -2.38 | -3.9 |
| 5/23/2008 | -2.46 | -3.89 | -3.23 | -2.59 | -3.58 |
| 7/4/2008 | -2.48 | -3.87 | -3.47 | -2.14 | -2.86 |
| 8/29/2008 | -2.64 | -3.41 | -2.97 | -1.9 | -3.33 |
| 5/22/2009 | -2.58 | -4.48 | -3.35 | -1.64 | -3.52 |
| 7/3/2009 | -2.73 | -4.66 | -3.08 | -1.61 | -3.08 |
| Schedule Period (End Date) | Route 1 | Route 9 | Route 10 | Route 41 | Route 42 |
|---|---|---|---|---|---|
| 4/28/2005 | -1.27 | -2.1 | -2.08 | -1.81 | |
| 5/27/2005 | -1.28 | -2.76 | -1.26 | -1.41 | |
| 7/7/2005 | -1.27 | -2.94 | -1.46 | -1.66 | |
| 8/18/2005 | -1.15 | -3.33 | -1.56 | -1.64 | |
| 10/28/2005 | -1.16 | -2.62 | -1.58 | -1.63 | |
| 11/23/2005 | -1.16 | -2.28 | -1.39 | -1.56 | -3.59 |
| 1/27/2006 | -1.05 | -2.58 | -1.74 | -1.96 | -4.1 |
| 5/26/2006 | -1.26 | -2.7 | -1.53 | -1.81 | -3.6 |
| 9/29/2006 | -1.39 | -2.57 | -1.25 | -1.66 | -3.26 |
| 11/22/2006 | -1.37 | -2.49 | -1.43 | -1.68 | -3.07 |
| 12/1/2006 | -1.05 | -2.35 | -1.54 | -1.73 | -3.13 |
| 12/24/2006 | -1.38 | -2.33 | -1.55 | -1.87 | -3.95 |
| 1/26/2007 | -1.25 | -2.86 | -1.38 | -1.91 | -3.67 |
| 5/25/2007 | -1.51 | -3.37 | -1.75 | -1.84 | -3.42 |
| 6/29/2007 | -0.88 | -3.76 | -1.86 | -1.76 | -3.59 |
| 8/31/2007 | -1.07 | -3.68 | -1.6 | -1.57 | -2.75 |
| 10/4/2007 | -0.89 | -4.08 | -1.79 | -1.57 | -3 |
| 11/22/2007 | -1.17 | -3.46 | -1.71 | -1.48 | -2.71 |
| 1/25/2008 | -1.23 | -3.51 | -1.78 | -1.82 | -3.4 |
| 5/23/2008 | -1.12 | -3.63 | -1.73 | -1.77 | -3.57 |
| 7/4/2008 | -1.04 | -4.11 | -1.79 | -1.37 | -1.89 |
| 8/29/2008 | -1.04 | -3.78 | -1.69 | -1.37 | -1.95 |
| 5/22/2009 | -1.17 | -3.82 | -1.99 | -2.2 | -2.54 |
| 7/3/2009 | -1.07 | -3.39 | -1.71 | -1.64 | -3.03 |
Average Earliness by Route and Time-of-Day
| Schedule Period (End Date) | Route 1 | Route 9 | Route 10 | Route 41 | Route 42 |
|---|---|---|---|---|---|
| 4/28/2005 | -1.72 | -1.99 | -1.7 | -3.06 | -2.9 |
| 5/27/2005 | -1.75 | -2.04 | -1.38 | -2.8 | -2.9 |
| 7/7/2005 | -1.79 | -2.07 | -1.51 | -2.85 | -2.89 |
| 8/18/2005 | -1.77 | -1.96 | -1.62 | -2.84 | -2.86 |
| 10/28/2005 | -1.71 | -1.99 | -1.48 | -2.67 | -2.88 |
| 11/23/2005 | -1.73 | -1.95 | -1.41 | -2.83 | -2.99 |
| 1/27/2006 | -1.88 | -2.33 | -1.66 | -3.18 | -3.47 |
| 5/26/2006 | -1.87 | -2.22 | -1.62 | -2.27 | -2.65 |
| 9/29/2006 | -1.9 | -2.2 | -1.72 | -2.15 | -2.36 |
| 11/22/2006 | -1.88 | -1.95 | -1.73 | -2.12 | -2.26 |
| 12/1/2006 | -1.79 | -2.28 | -1.98 | -2.52 | -2.88 |
| 12/24/2006 | -1.92 | -2.2 | -1.87 | -2.39 | -2.82 |
| 1/26/2007 | -1.87 | -2.31 | -1.7 | -2.47 | -2.78 |
| 5/25/2007 | -2.13 | -2.45 | -1.86 | -2.26 | -2.63 |
| 6/29/2007 | -2.05 | -2.66 | -2.25 | -2.06 | -2.32 |
| 8/31/2007 | -1.98 | -2.33 | -1.97 | -2.66 | -2.95 |
| 10/4/2007 | -1.89 | -2.15 | -1.84 | -2.63 | -2.87 |
| 11/22/2007 | -2.08 | -2.31 | -1.89 | -2.58 | -3 |
| 1/25/2008 | -2.11 | -2.51 | -1.94 | -2.86 | -3.35 |
| 5/23/2008 | -2.02 | -2.24 | -1.83 | -2.83 | -3.09 |
| 7/4/2008 | -2 | -2.46 | -2.13 | -2.68 | -2.91 |
| 8/29/2008 | -1.94 | -2.29 | -1.94 | -2.71 | -2.76 |
| 5/22/2009 | -1.92 | -2.57 | -2.08 | -1.95 | -2.5 |
| 7/3/2009 | -1.98 | -2.54 | -1.88 | -2.49 | -2.71 |
| Schedule Period (End Date) | Route 1 | Route 9 | Route 10 | Route 41 | Route 42 |
|---|---|---|---|---|---|
| 4/28/2005 | -1.66 | -2.13 | -1.78 | -2.99 | -2.79 |
| 5/27/2005 | -1.69 | -2.3 | -1.39 | -2.75 | -2.78 |
| 7/7/2005 | -1.62 | -2.45 | -1.5 | -2.75 | -2.78 |
| 8/18/2005 | -1.69 | -2.12 | -1.51 | -2.69 | -2.57 |
| 10/28/2005 | -1.64 | -2.21 | -1.49 | -2.55 | -2.75 |
| 11/23/2005 | -1.69 | -2.26 | -1.49 | -2.68 | -2.85 |
| 1/27/2006 | -1.71 | -2.44 | -1.56 | -2.96 | -3.23 |
| 5/26/2006 | -1.78 | -2.39 | -1.61 | -2.27 | -2.67 |
| 9/29/2006 | -1.75 | -2.33 | -1.69 | -2.14 | -2.42 |
| 11/22/2006 | -1.81 | -2.17 | -1.63 | -2.1 | -2.37 |
| 12/1/2006 | -1.79 | -2.52 | -1.77 | -2.38 | -2.74 |
| 12/24/2006 | -1.85 | -2.42 | -1.69 | -2.41 | -2.96 |
| 1/26/2007 | -1.79 | -2.62 | -1.65 | -2.5 | -2.84 |
| 5/25/2007 | -1.81 | -2.76 | -1.89 | -2.27 | -2.7 |
| 6/29/2007 | -1.69 | -3.06 | -2.22 | -2.17 | -2.38 |
| 8/31/2007 | -1.55 | -2.85 | -2.03 | -2.52 | -2.81 |
| 10/4/2007 | -1.49 | -2.72 | -1.81 | -2.51 | -2.76 |
| 11/22/2007 | -1.71 | -2.67 | -1.86 | -2.5 | -2.86 |
| 1/25/2008 | -1.75 | -2.79 | -1.84 | -2.7 | -3.1 |
| 5/23/2008 | -1.65 | -2.66 | -1.82 | -2.69 | -2.92 |
| 7/4/2008 | -1.63 | -2.81 | -1.98 | -2.55 | -2.74 |
| 8/29/2008 | -1.54 | -2.77 | -1.82 | -2.55 | -2.67 |
| 5/22/2009 | -1.55 | -3.03 | -2.11 | -2.23 | -2.86 |
| 7/3/2009 | -1.67 | -3.05 | -1.81 | -2.59 | -2.83 |
Average Lateness by Route and Day of Week
| Schedule Period (End Date) | Route 1 | Route 9 | Route 10 | Route 41 | Route 42 |
|---|---|---|---|---|---|
| 4/28/2005 | 2.11 | 2.33 | 2.12 | 2.44 | 2.66 |
| 5/27/2005 | 2.07 | 2.42 | 2.14 | 2.37 | 2.67 |
| 7/7/2005 | 2.27 | 2.4 | 2.09 | 2.34 | 2.59 |
| 8/18/2005 | 2.08 | 2.58 | 2.23 | 2.36 | 2.67 |
| 10/28/2005 | 1.87 | 2.5 | 2.02 | 2.39 | 2.63 |
| 11/23/2005 | 2.22 | 2.5 | 2.19 | 2.07 | 2.55 |
| 1/27/2006 | 1.81 | 2.37 | 1.8 | 1.85 | 2.03 |
| 5/26/2006 | 1.96 | 2.3 | 1.94 | 3.86 | 3.79 |
| 9/29/2006 | 2.16 | 2.56 | 2.13 | 3.92 | 3.91 |
| 11/22/2006 | 1.87 | 2.71 | 2.09 | 3.81 | 3.83 |
| 12/1/2006 | 2.04 | 2.55 | 1.98 | 3.85 | 3.67 |
| 12/24/2006 | 1.88 | 2.62 | 2.07 | 3.61 | 3.61 |
| 1/26/2007 | 1.96 | 2.48 | 2.02 | 3.39 | 3.49 |
| 5/25/2007 | 2.24 | 2.46 | 1.92 | 3.56 | 3.64 |
| 6/29/2007 | 2.37 | 2.05 | 1.82 | 3.19 | 3.72 |
| 8/31/2007 | 2.46 | 2.38 | 1.95 | 2.17 | 2.29 |
| 10/4/2007 | 2.02 | 2.7 | 2.2 | 2.32 | 2.47 |
| 11/22/2007 | 1.89 | 2.45 | 2.16 | 2.25 | 2.27 |
| 1/25/2008 | 1.81 | 2.3 | 1.91 | 1.93 | 2.11 |
| 5/23/2008 | 2.18 | 2.33 | 1.94 | 2.06 | 2.34 |
| 7/4/2008 | 2.2 | 2.44 | 2.07 | 2.4 | 2.57 |
| 8/29/2008 | 2.43 | 2.64 | 2.35 | 2.41 | 2.69 |
| 5/22/2009 | 2.53 | 2.36 | 1.92 | 3.68 | 4.36 |
| 7/3/2009 | 2.32 | 2.26 | 1.66 | 2.57 | 2.21 |
| Schedule Period (End Date) | Route 1 | Route 9 | Route 10 | Route 41 | Route 42 |
|---|---|---|---|---|---|
| 4/28/2005 | 1.77 | 2.56 | 2.54 | 2.62 | 2.53 |
| 5/27/2005 | 1.78 | 2.35 | 2.78 | 2.61 | 2.6 |
| 7/7/2005 | 1.94 | 2.36 | 2.78 | 2.63 | 2.46 |
| 8/18/2005 | 1.99 | 2.14 | 2.99 | 2.56 | 2.37 |
| 10/28/2005 | 1.82 | 2.23 | 2.84 | 2.64 | 2.32 |
| 11/23/2005 | 1.94 | 2.27 | 2.84 | 2.39 | 2.32 |
| 1/27/2006 | 1.73 | 1.96 | 2.42 | 2.02 | 1.89 |
| 5/26/2006 | 1.88 | 2.29 | 2.74 | 2.71 | 2.26 |
| 9/29/2006 | 1.97 | 2.42 | 2.93 | 3.17 | 2.65 |
| 11/22/2006 | 2.01 | 2.25 | 2.8 | 3.17 | 2.6 |
| 12/1/2006 | 2.16 | 1.98 | 2.56 | 2.87 | 2.54 |
| 12/24/2006 | 1.95 | 2.07 | 2.7 | 2.62 | 2.42 |
| 1/26/2007 | 2.01 | 2.11 | 2.71 | 2.48 | 2.29 |
| 5/25/2007 | 2.14 | 2.26 | 2.71 | 2.59 | 2.29 |
| 6/29/2007 | 2.51 | 2.39 | 2.62 | 2.84 | 2.56 |
| 8/31/2007 | 2.74 | 2.58 | 2.87 | 2.72 | 2.03 |
| 10/4/2007 | 2.24 | 2.75 | 3.02 | 2.83 | 2.35 |
| 11/22/2007 | 2.1 | 2.55 | 2.53 | 2.65 | 2.23 |
| 1/25/2008 | 1.97 | 2.2 | 2.57 | 2.23 | 2.02 |
| 5/23/2008 | 2.25 | 2.42 | 2.72 | 2.44 | 1.99 |
| 7/4/2008 | 2.23 | 2.46 | 2.82 | 2.83 | 2.23 |
| 8/29/2008 | 2.58 | 2.75 | 3.04 | 2.68 | 2.44 |
| 5/22/2009 | 2.27 | 3 | 2.66 | 2.8 | 2.54 |
| 7/3/2009 | 2.16 | 3.14 | 2.23 | 2.73 | 2.43 |
| Schedule Period (End Date) | Route 1 | Route 9 | Route 10 | Route 41 | Route 42 |
|---|---|---|---|---|---|
| 4/28/2005 | 1.05 | 1.52 | 2.13 | 2.75 | |
| 5/27/2005 | 0.79 | 1.81 | 2.06 | 3.58 | |
| 7/7/2005 | 1.39 | 1.98 | 2.08 | 3.38 | |
| 8/18/2005 | 1.52 | 2.32 | 1.58 | 3.77 | |
| 10/28/2005 | 1.67 | 2.31 | 1.83 | 3.32 | |
| 11/23/2005 | 1.94 | 2.14 | 2.1 | 2.53 | 3.26 |
| 1/27/2006 | 1.42 | 1.81 | 2.02 | 1.56 | 3.09 |
| 5/26/2006 | 1.75 | 1.86 | 2.02 | 2.5 | 3.69 |
| 9/29/2006 | 2.38 | 2.21 | 2.36 | 3.76 | 3.83 |
| 11/22/2006 | 2.08 | 2.08 | 2.2 | 3.45 | 3.89 |
| 12/1/2006 | 0.86 | 1.73 | 1.66 | 2.66 | 3.53 |
| 12/24/2006 | 1.95 | 2.01 | 2.62 | 2.44 | 3.29 |
| 1/26/2007 | 1.93 | 2.18 | 1.81 | 2.45 | 3.26 |
| 5/25/2007 | 1.98 | 2.31 | 1.89 | 2.59 | 4.13 |
| 6/29/2007 | 1.83 | 2.18 | 1.48 | 2.9 | 4.26 |
| 8/31/2007 | 1.7 | 2.18 | 1.9 | 2.79 | 4.49 |
| 10/4/2007 | 1.94 | 2.31 | 1.8 | 3.3 | 4.19 |
| 11/22/2007 | 1.88 | 1.93 | 1.53 | 2.67 | 4.05 |
| 1/25/2008 | 1.49 | 2.16 | 1.6 | 1.88 | 3.47 |
| 5/23/2008 | 1.57 | 2.52 | 1.76 | 2.44 | 3.94 |
| 7/4/2008 | 1.5 | 1.81 | 1.63 | 2.25 | 3.83 |
| 8/29/2008 | 1.68 | 2.42 | 2.11 | 2.92 | 4.08 |
| 5/22/2009 | 1.64 | 2.02 | 1.6 | 2.77 | 3.55 |
| 7/3/2009 | 1.98 | 2.49 | 2.02 | 2.36 | 2.78 |
| Schedule Period (End Date) | Route 1 | Route 9 | Route 10 | Route 41 | Route 42 |
|---|---|---|---|---|---|
| 4/28/2005 | 1.34 | 1.93 | 1.68 | 2.69 | |
| 5/27/2005 | 1.03 | 2.05 | 1.93 | 3.23 | |
| 7/7/2005 | 1.02 | 2 | 2.29 | 3.16 | |
| 8/18/2005 | 1.29 | 1.45 | 1.75 | 3.51 | |
| 10/28/2005 | 1.41 | 2.02 | 2.17 | 2.8 | |
| 11/23/2005 | 1.64 | 1.98 | 1.93 | 2.2 | 2.29 |
| 1/27/2006 | 1.36 | 1.84 | 2.1 | 1.72 | 1.83 |
| 5/26/2006 | 1.7 | 1.64 | 2.14 | 2.33 | 2.42 |
| 9/29/2006 | 1.89 | 1.84 | 2.27 | 3.16 | 3.4 |
| 11/22/2006 | 1.63 | 1.96 | 1.87 | 3.18 | 3.28 |
| 12/1/2006 | 1 | 1.56 | 1.53 | 1.79 | 2.58 |
| 12/24/2006 | 1.86 | 1.83 | 1.81 | 2.33 | 2.05 |
| 1/26/2007 | 1.59 | 1.9 | 2.05 | 2.31 | 2.11 |
| 5/25/2007 | 1.98 | 1.9 | 1.7 | 2.38 | 2.82 |
| 6/29/2007 | 2.21 | 1.7 | 1.55 | 2.65 | 3.48 |
| 8/31/2007 | 1.93 | 1.77 | 1.86 | 2.71 | 3.55 |
| 10/4/2007 | 2.15 | 2.09 | 1.58 | 3.09 | 3.29 |
| 11/22/2007 | 2.17 | 1.69 | 1.58 | 2.47 | 2.76 |
| 1/25/2008 | 1.71 | 1.95 | 1.76 | 1.95 | 1.91 |
| 5/23/2008 | 1.97 | 1.96 | 1.78 | 2.29 | 2.8 |
| 7/4/2008 | 1.82 | 1.98 | 1.54 | 2.56 | 3.81 |
| 8/29/2008 | 2.21 | 2.5 | 2.12 | 2.87 | 3.7 |
| 5/22/2009 | 1.65 | 1.77 | 1.73 | 2.57 | 2.85 |
| 7/3/2009 | 1.97 | 2.25 | 2.16 | 2.7 | 3.32 |
Average Lateness by Route and Time-of-Day
| Schedule Period (End Date) | Route 1 | Route 9 | Route 10 | Route 41 | Route 42 |
|---|---|---|---|---|---|
| 4/28/2005 | 1.62 | 2.54 | 2.57 | 2.45 | 2.54 |
| 5/27/2005 | 1.58 | 2.51 | 2.69 | 2.56 | 2.79 |
| 7/7/2005 | 1.61 | 2.46 | 2.51 | 2.47 | 2.53 |
| 8/18/2005 | 2.06 | 2.86 | 2.99 | 2.43 | 2.4 |
| 10/28/2005 | 1.64 | 2.72 | 2.65 | 2.64 | 2.5 |
| 11/23/2005 | 1.84 | 2.7 | 3.03 | 2.03 | 2.36 |
| 1/27/2006 | 1.59 | 2.36 | 2.43 | 1.84 | 1.78 |
| 5/26/2006 | 1.77 | 2.49 | 2.53 | 3.19 | 3.02 |
| 9/29/2006 | 1.94 | 2.69 | 2.76 | 3.67 | 3.49 |
| 11/22/2006 | 1.77 | 2.8 | 2.64 | 3.37 | 3.33 |
| 12/1/2006 | 1.88 | 2.51 | 2.42 | 3.25 | 2.87 |
| 12/24/2006 | 1.97 | 2.49 | 2.52 | 3.11 | 3.02 |
| 1/26/2007 | 1.91 | 2.52 | 2.49 | 2.93 | 2.82 |
| 5/25/2007 | 2.27 | 2.59 | 2.47 | 3 | 3.04 |
| 6/29/2007 | 2.38 | 2.41 | 2.34 | 3.08 | 3.28 |
| 8/31/2007 | 2.69 | 2.73 | 2.73 | 2.56 | 2.22 |
| 10/4/2007 | 2.24 | 2.91 | 2.75 | 2.89 | 2.64 |
| 11/22/2007 | 1.96 | 2.53 | 2.51 | 2.63 | 2.31 |
| 1/25/2008 | 1.77 | 2.44 | 2.33 | 2.15 | 1.91 |
| 5/23/2008 | 2.17 | 2.63 | 2.53 | 2.24 | 2.19 |
| 7/4/2008 | 2.22 | 2.55 | 2.58 | 2.51 | 2.37 |
| 8/29/2008 | 2.6 | 2.87 | 3.05 | 2.58 | 2.52 |
| 5/22/2009 | 2.63 | 2.74 | 2.49 | 3.14 | 3.64 |
| 7/3/2009 | 2.47 | 2.65 | 2.06 | 2.5 | 2.16 |
| Schedule Period (End Date) | Route 1 | Route 9 | Route 10 | Route 41 | Route 42 |
|---|---|---|---|---|---|
| 4/28/2005 | 1.66 | 2.61 | 2.3 | 2.34 | 2.54 |
| 5/27/2005 | 1.62 | 2.5 | 2.49 | 2.47 | 2.8 |
| 7/7/2005 | 1.61 | 2.38 | 2.31 | 2.36 | 2.64 |
| 8/18/2005 | 2.02 | 2.8 | 2.69 | 2.3 | 2.53 |
| 10/28/2005 | 1.69 | 2.61 | 2.52 | 2.54 | 2.62 |
| 11/23/2005 | 1.78 | 2.69 | 2.78 | 1.94 | 2.56 |
| 1/27/2006 | 1.61 | 2.29 | 2.32 | 1.76 | 2.02 |
| 5/26/2006 | 1.86 | 2.41 | 2.44 | 2.69 | 2.55 |
| 9/29/2006 | 2.01 | 2.59 | 2.6 | 3.16 | 3.03 |
| 11/22/2006 | 1.84 | 2.64 | 2.52 | 2.98 | 2.97 |
| 12/1/2006 | 1.9 | 2.44 | 2.34 | 2.65 | 2.7 |
| 12/24/2006 | 1.99 | 2.46 | 2.45 | 2.55 | 2.66 |
| 1/26/2007 | 1.99 | 2.48 | 2.38 | 2.41 | 2.49 |
| 5/25/2007 | 2.21 | 2.5 | 2.4 | 2.64 | 2.69 |
| 6/29/2007 | 2.48 | 2.38 | 2.33 | 2.85 | 2.97 |
| 8/31/2007 | 2.84 | 2.7 | 2.6 | 2.57 | 2.39 |
| 10/4/2007 | 2.37 | 2.87 | 2.58 | 2.86 | 2.8 |
| 11/22/2007 | 2.07 | 2.5 | 2.38 | 2.61 | 2.58 |
| 1/25/2008 | 1.86 | 2.39 | 2.29 | 2.19 | 2.18 |
| 5/23/2008 | 2.23 | 2.6 | 2.48 | 2.23 | 2.34 |
| 7/4/2008 | 2.25 | 2.54 | 2.46 | 2.48 | 2.51 |
| 8/29/2008 | 2.67 | 2.92 | 2.86 | 2.51 | 2.66 |
| 5/22/2009 | 2.67 | 2.86 | 2.41 | 2.89 | 3.02 |
| 7/3/2009 | 2.5 | 2.75 | 1.99 | 2.53 | 2.43 |
Average Earliness at Timepoint Level for Individual Routes
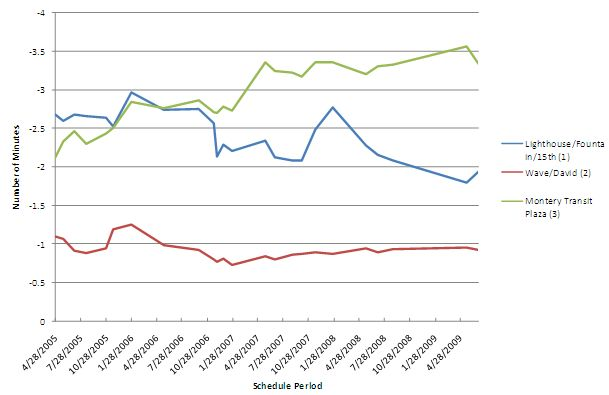
Figure 79: Average Earliness at Route 1 Timepoints in the Inbound Direction
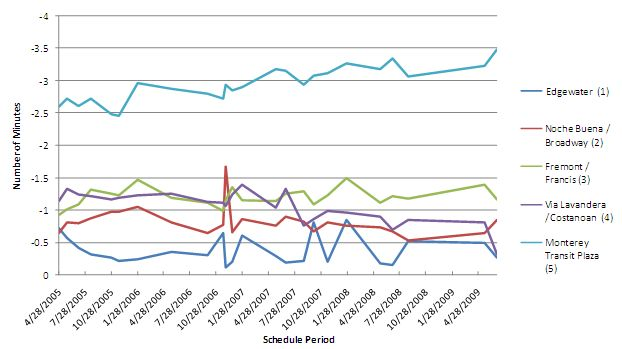
Figure 80: Average Earliness at Route 9 Timepoints in the Inbound Direction
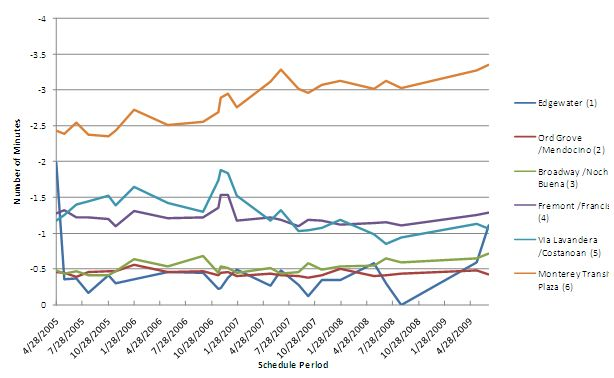
Figure 81: Average Earliness at Route 10 Timepoints in the Inbound Direction
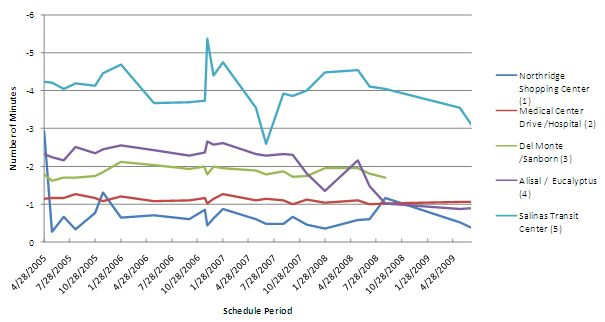
Figure 82: Average Earliness at Route 41 Timepoints in the Inbound Direction
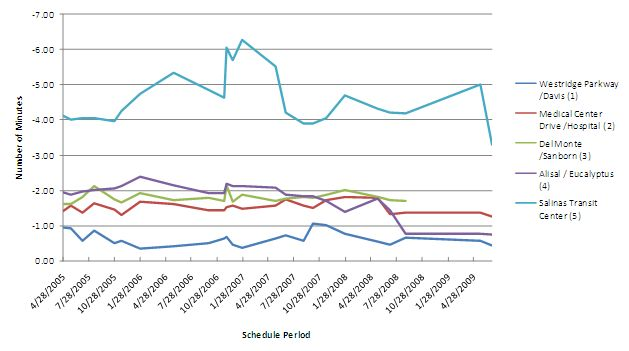
Figure 83: Average Earliness at Route 42 Timepoints in the Outbound Direction
Average Lateness at Timepoint Level for Individual Routes
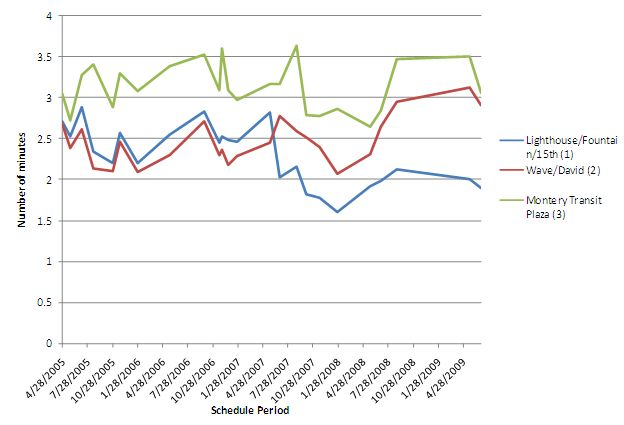
Figure 84: Average Lateness at Route 1 Timepoints in the Inbound Direction
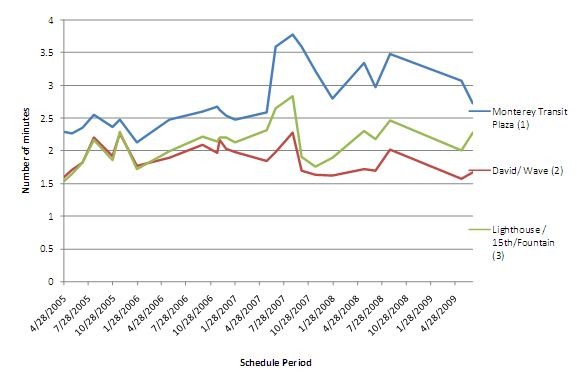
Figure 85: Average Lateness at Route 1 Timepoints in the Outbound Direction
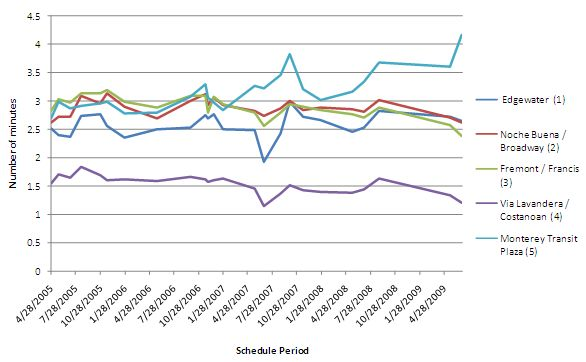
Figure 86: Average Lateness at Route 9 Timepoints in the Inbound Direction
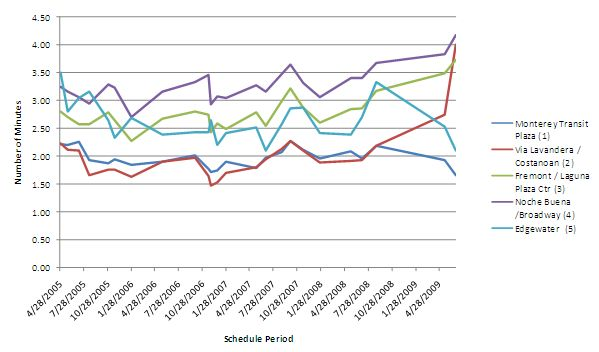
Figure 87: Average Lateness at Route 9 Timepoints in the Outbound Direction
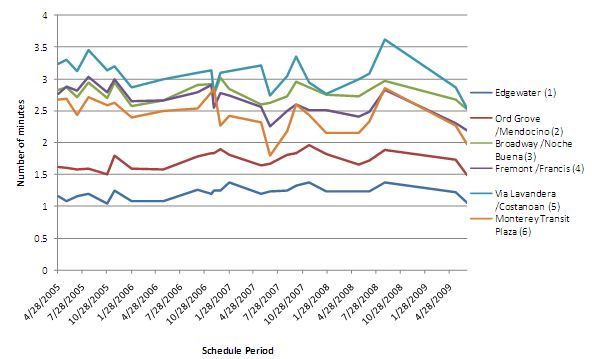
Figure 88: Average Lateness at Route 10 Timepoints in the Inbound Direction
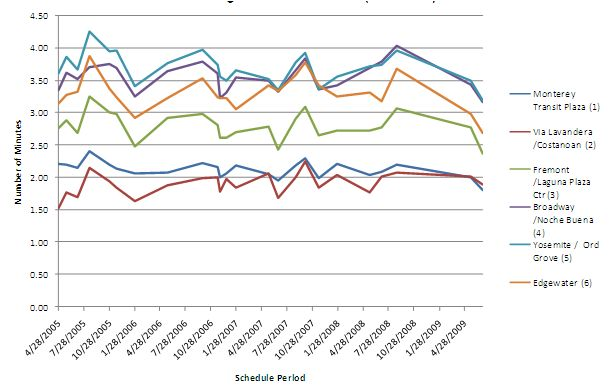
Figure 89: Average Lateness at route 10 Timepoints in the Outbound Direction
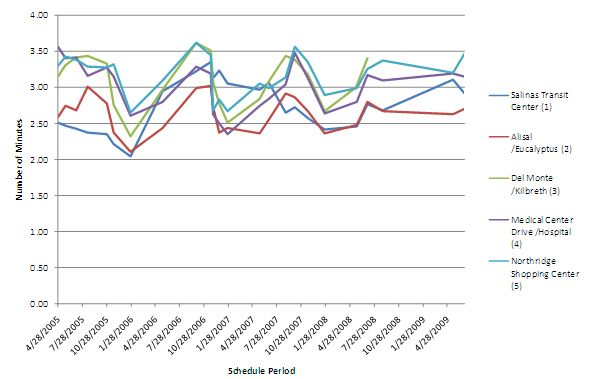
Figure 90: Average Lateness at Route 41 Timepoints in the Outbound Direction
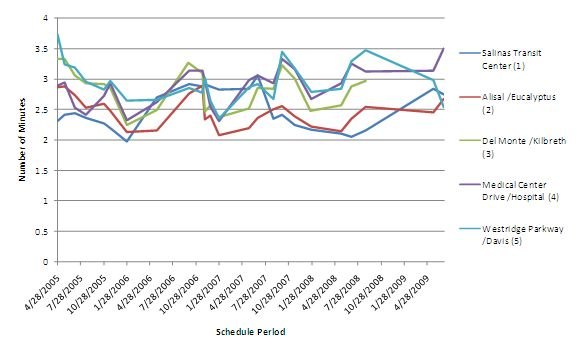
Figure 91: Average Lateness at Route 42 Timepoints in the Outbound Direction