
Appendix B. Missing Data by Schedule Period
The legend for Table 7 and Table 8 is as follows:
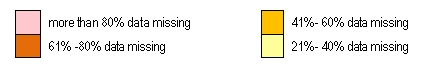
A lot of cells are empty in Table 7 since several routes were not operational in the Phase III evaluation timeframe. Also, cells that contain values and are not highlighted in any color represent schedule periods in which less than 20% of the data was missing.
Table 7. Missing Data by Schedule Period from 2005 to 2006, for All MST Bus Routes
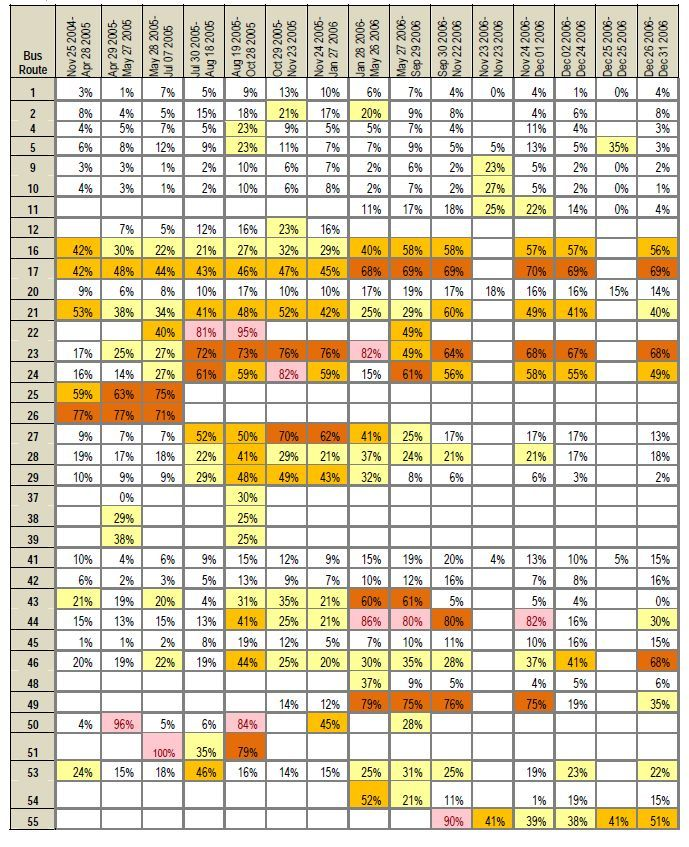
Image details
Table 8. Missing Data by Schedule Period from 2007 to 2009, for All MST Bus Routes
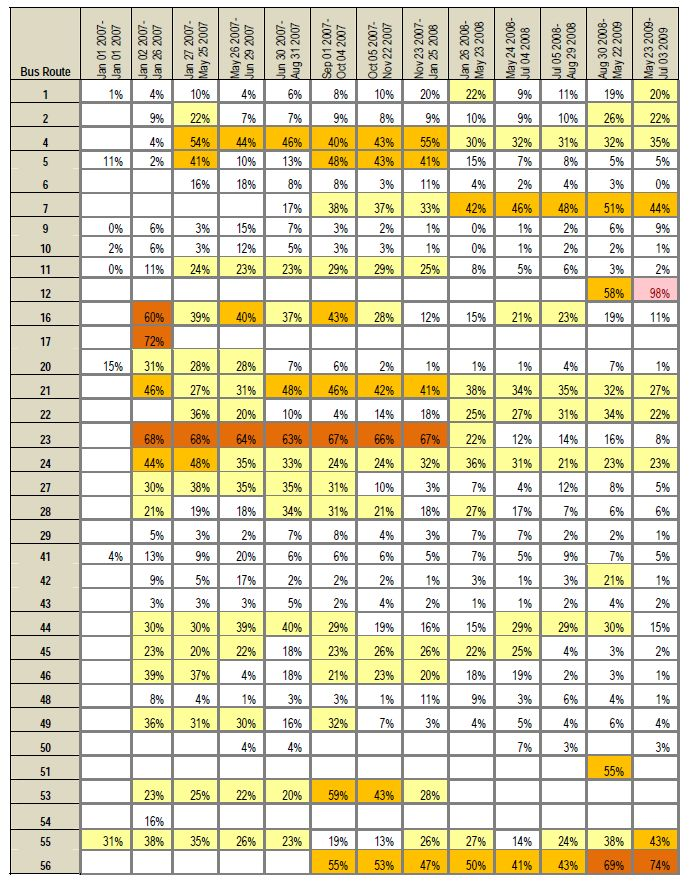
Image details