3 Real-Time Data Coverage
3.1 Traffic Data Coverage
3.1.1 Types of Data
This discussion of traffic data coverage includes several different types of real-time data that are available, as described in Table 3.1.
The coverage extent of each different type of data is reported differently. The public sector continues to invest in detection infrastructure. The private sector continues to expand its capabilities to provide data on corridors beyond what is currently instrumented by public-sector-operated detection systems. This is done using a combination of fleet-probe GPS data; cell phone probes; privately owned detection infrastructure; aggregated public sector detection data; incident data (from public and private entities); and in some cases, historical corridor travel patterns. Arterial coverage remains a challenge, whether through traditional sensor-based deployment or through probe-based applications. However, many arterial management agencies recognize the value in CCTV/video coverage. Coverage areas for incident data tend to be larger than for flow data because no infrastructure is needed on public right-of-way. Also, incident coverage may be claimed for a metropolitan area even if only the major incidents on primary freeways are reported. However, incident data coverage is increasing due to the prevalence of cell phones and the ability to use police scanners or links to police CAD systems to obtain real-time incident information. Weather data is obtained from the National Weather Service (NWS) primarily and includes general forecasts and temperatures. Road condition is a data type that is not always communicated; however, it is available in some regions.
3.1.2 Coverage by Public Sector Systems
3.1.2.1 Freeways (Urban Areas)
Freeways continue to be the primary focus for real-time data collection throughout the country. The public sector, private sector, and industry are in agreement that there is generally good coverage of urban area freeways through public-sector-operated sensor deployment systems. The system reliability of those sensors can challenge the effectiveness of the data that is disseminated to the public. Some agencies actively assess the downtime of sensors (public-agency-owned or private-sector-owned) to ensure that the data they are receiving is reliable. Agencies also use the downtime information to determine private-sector contractor fees. With 38 percent of urban area freeways covered by detection systems, there has been progress made in the detection coverage of the freeway system, although there is recognition that more can be done. Most states are doing well with limited access freeways and incident data. Planned event data/construction data still has room for improvement.
The data collected from a public agency through mainline detection technologies can be lane specific; however, the information provided to the traveler is typically segment speed and flow data, rather than lane-by-lane data. Incident information in some areas collected by the local public safety CAD is shared with the local TMCs. In some cases, this is an automatic feed from the CAD system to the DOT’s operating systems; in other cases, there is an incident feed provided, but it still requires manual intervention to enter data at the transportation agency. This information supplements their traffic speeds and flow maps with the real-time conditions on the roadway and effects of the incident on traffic.
States indicated that there are gaps in coverage from what their systems currently provide. There are limitations as to how much detection infrastructure can feasibly be deployed and maintained with current resource constraints. Arterials were identified as another key gap/limitation of current DOT coverage capabilities.
The largest cities tend to have a higher percentage of incident freeway mile coverage, although even the largest cities fall significantly short of full freeway coverage. Figure 3.1 shows the coverage by public sector systems. The size of the circles corresponds to the relative number of freeway miles within each urban area, and the shading indicates how many of those have real-time flow coverage by agency-owned systems. In several areas, the coverage miles do not equal the urban area freeway miles.
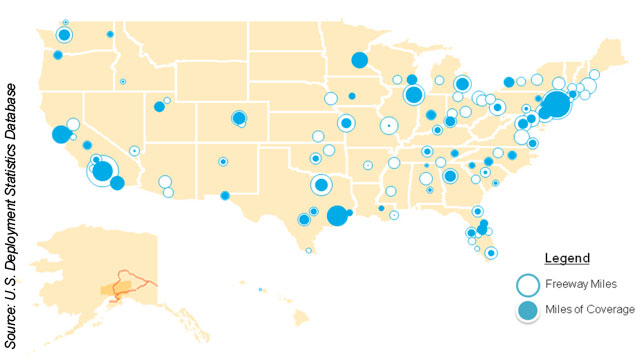
Figure 3.1: Map of Public Sector Deployments
It should be noted that these data are self-reported and may not accurately represent all metropolitan areas. There are several cities that did not have any coverage reported, although they are known to have ITS deployments. It should also be noted that these coverage data only include sensor coverage and not incidents, construction, weather, or other types of data. That being said, public agencies will typically only report incidents in areas where they have the ability to visually confirm reports through camera imagery, which tends to cover roughly the same roads as their traffic sensors.
Incident coverage by public sector systems can be broad due to the public’s access to CAD systems and, when available, CCTV systems. Arterial real-time information is typically limited to incidents, as it has proven difficult to accurately capture other types of data for arterials. Also, with regard to the availability of incident data, a 2006 survey of states that use a statewide incident reporting system found that 33 states (of the 34 that responded) reported having either a municipal, regional, or statewide incident reporting system (Statewide Incident Reporting Systems – Business and Technology Plan, page 11). Statewide real-time incident coverage (to include rural area Interstates, state routes, and US routes) does not presently occur.
Many states have implemented systems to capture construction and planned events information, although this is not real time. The accuracy of these systems is directly linked to regional/district as well as statewide resources keeping the information up to date. Construction data comes in the form of real-time data collection for actual lane closures, delays, and other impacts to traffic from the construction activities, which can be shared with the traffic management agencies to disseminate more accurate information to the traveler.
The most exhaustive source of data on public-sector ITS deployments in the United States is the US DOT ITS Deployment Statistics Database. The most recent statistics (survey year 2007) reveal the following facts (trends are shown in Table 3.2):
- 39 percent of urban freeway centerline miles within 64 metropolitan areas are equipped with real-time data collection technologies. This is an increase from 33 percent in 2004. (94 metropolitan areas returned surveys.)
- 12 metropolitan areas (13 percent of respondents) responded that they had specifically deployed probe data collection technologies. These are typically toll tag readers, and the largest deployments are in Chicago, Houston, New York City, and West Palm Beach. (This does not include private-sector probe data sources, which is addressed in the next section.)
- 34 metropolitan areas (36 percent of respondents) report freeway travel times to the public, either via DMS or Web sites.
- 30 metropolitan areas (32 percent of respondents) report freeway speeds to the public.
- 82 metropolitan areas (87 percent of respondents) report incident information to the public.
Source: ITS Deployment Statistics Database 2007
511 systems provide a tool to allow users to access available information via an interactive voice response or touch-tone request. Data needed to support minimum content requirements includes incident information, planned construction/planned event information that impacts travel, weather information, and general traffic conditions. Some 511 services also offer travel times on pre-defined routes. According to the 511 Coalition/Statistics reporting, 511 will be accessible to 70 percent of the population in 2009, compared to 32 percent of the population in late 2005. State DOTs and regional transportation agencies continue to plan for and invest in both phone-based and Web-based traveler information services.
511 statistics as of May 2009 (THE most recent information available through the 511 Deployment Coalition) include:
- Over 146 million calls placed nationwide since inception
- 511 service available to over 166 million Americans (54 percent)
- Forty-six 511 services available to the traveling public operating in 35 states, 2 Canadian provinces, and 1 Canadian territory.
Figure 3.2 shows the national coverage of 511 systems that disseminate traffic information.
Figure 3.2: 511 System Traffic Coverage
3.1.2.2 Statewide/Rural Corridors
Statewide real-time coverage (to include rural area Interstates, state routes, US routes, or others) does not occur. However, many states have implemented incident and event reporting systems to capture construction, planned events, and incident information, although this is not always provided in real time. The accuracy of these systems is directly linked to regional/district as well as statewide resources keeping the information up to date. Some agencies indicated challenges internal to their organization that made it difficult to capture all of the events, as well as keep information current once it has been entered. There is recognition that there is available data (through law enforcement/police CAD systems and other agency systems), but there has been a challenge in harnessing that data into a workable database.
Because rural corridors have, to date, been a lower priority for real-time data, it has been difficult for some states to justify the investment. Some states indicated that the RTSMIP/1201 requirements would require concerted focus on getting information on these corridors, although some identified concerns about what the cost and resource implications would be to do so.
RWIS are a common ITS application, especially in cold weather states with snow and ice. While RWIS are commonly deployed for winter weather maintenance decision support, they can also be a valuable traveler information tool. However, most areas do not have sufficient RWIS density to provide route-specific road-weather information.
Figure 3.3 shows that, even for a state like Colorado with a significant RWIS deployment, there still may be significant gaps between ESS on Interstates and arterials alike. The NWS collects weather data across the country, but its sensors are typically located at airports and other locations more optimal for wide-area forecasts. RWIS sensors are typically located in known trouble spots that may be leading indicators for deteriorating road conditions. Nonetheless, even in states with mature RWIS programs, there are wide swaths of areas in adverse weather regions with no RWIS sensors.
Figure 3.3: RWIS Coverage in Colorado
In addition, there is a significant disparity in RWIS coverage between states—even those with similar characteristics. Given limited resources, some DOTs have focused their deployments on applications other than weather, particularly where local agencies perform much of the winter weather maintenance. Weather data may also be an area where DOTs can obtain information from other sources, such as the NWS, universities, US Army Corps of Engineers, or others. Figure 3.4 shows several Midwestern states, some of which have dense RWIS coverage and some of which have sparse coverage.
Figure 3.4: RWIS Coverage in Several Midwestern States
3.1.2.3 Arterial Coverage
Arterial real-time information is typically limited to incidents, as it has proven difficult to accurately capture flow conditions on interrupted flow facilities (those with traffic signals). For arterials, fixed sensors do not adequately capture true delays, which are driven by intersection queues. If an adequate market penetration of probe vehicles can be obtained, it might be feasible to obtain arterial flow information. Recent studies have shown the required market penetration to be high (Tarnoff and Bullock, TRB 2009).
Real-time data available from arterials is scarce, which requires the public agencies to rely on inadequate data or private sources to provide that information to the public. The cost of providing infrastructure on arterials cannot outweigh the benefits that are realized by the arterial users—this has typically resulted in only major arterials being instrumented with data collection devices, rather than the entire arterial network. The information currently available for arterials is primarily intersection detection data, but it is used exclusively for signal control; information does not leave the controller. With additional investment in communications, there could be a great deal more data transmitted to TMCs.
Because most statewide reporting/data systems that support traveler information have been designed for state corridors and facilities, there are few that have the capability to support arterial information. Some state DOTs have expanded their reporting systems to include arterials on a limited basis, to at least be able to capture incident or planned event information for those routes. The impetus for doing so has been to include this information on 511 phone and Web-based services. Barriers to addressing this include funding and resources.
3.1.3 Traffic Data Coverage of Private-Sector Systems
The private sector has been providing traffic information for many years. Historically, it has been in the form of radio traffic reports, which feature a radio personality reporting on traffic from various sources including tipsters, fixed-wing aircraft, helicopter, police scanners, and public agency surveillance cameras. The two largest companies in this business are Clear Channel’s Total Traffic Network and Westwood One’s Metro Networks, which each cover approximately 100 urban markets in the United States. However, coverage in this sense is not reported according to mileage. Ostensibly, any road in a metropolitan area is considered covered in that, if a significant enough incident were to occur, it may be included in a traffic report. However, the effective coverage is limited in the number of traffic reports that can be mentioned in a single 30-second radio spot.
More recently, public-private partnerships became popular as the private sector could employ profit-generating business models and the public sector owned right-of-way on which sensing infrastructure could be installed. One example of this is ITIP, which was enabled by SAFETEA-LU to advance the deployment of ITS traffic-monitoring technologies. This public-private partnership was originally designed to provide traffic data to public agencies for operations and planning, while enabling the private entity to earn a sustaining profit through traveler information services, that would then be shared with the local public agency. The program called for the construction of data collection infrastructure in more than 40 metropolitan areas with 300,000 or greater population. Of those 40 metropolitan areas, 25 have deployed or are deploying sensors under this program. Table 3.3 identifies the metropolitan areas participating in the program.
Source: Transportation Technology Innovation and Demonstration Program
Most recently, with the growth in mobile computing power and mobile communications, the private sector is now obtaining traffic information from in-vehicle sources, whether GPS devices or cellular phones. As a result, the private sector has become less reliant on the public sector for its business models. Further, private firms have the ability to collect flow/speed data on corridors beyond what is currently collected by public-agency sensor-based deployments. However, the focus continues to be on Interstate routes in and near major metropolitan areas. The private sector has indicated that although they can provide flow and speed information estimates on other corridors, the demand from private-sector customers for rural routes is not as high as the urban areas. Some within the private sector indicated expected growth in this market. Some within the private sector also indicated that past business models for traveler information were centered on FM broadcast areas, which do not typically extend into the rural areas. As a result, there was no basis for advertisement revenue associated with more densely populated urban areas. In addition, as the market continues to evolve with Satellite radio and in-vehicle systems, former broadcast mindsets may change, and the demand would likely increase for rural area corridors.
In the past several years, the private sector has greatly expanded its geographic coverage of both urban and rural areas through sources that do not rely on fixed infrastructure. While the accuracy of the traffic data from these probe-based sources is only beginning to be evaluated, these types of technologies can scale. As one of the pioneering firms in this area, INRIX reports the capability to provide real-time traffic in the form of travel time and speed information in 122 markets covering over 51,000 miles of interstates, freeways, and major arterials in the United States (INRIX, Real-Time Flow Market Coverage). In fact, multiple private data providers offer traffic data on all urban freeways within the top 100+ markets. These data are not of the same resolution as sensor data, however. They measure only speeds—not volumes, occupancies, or lane-by-lane data. Often available to the public for free on Web sites such as Google, Yahoo!, NAVTEQ Traffic, and Airsage, private-sector traffic data extend public-sector sensor coverage for traveler information. However, it should be noted that the private-sector data made available on the Internet is not free and accessible to the public sector to add to their own system coverage.
Figures 3.5 through 3.7 show the coverage areas of various private traffic data providers.
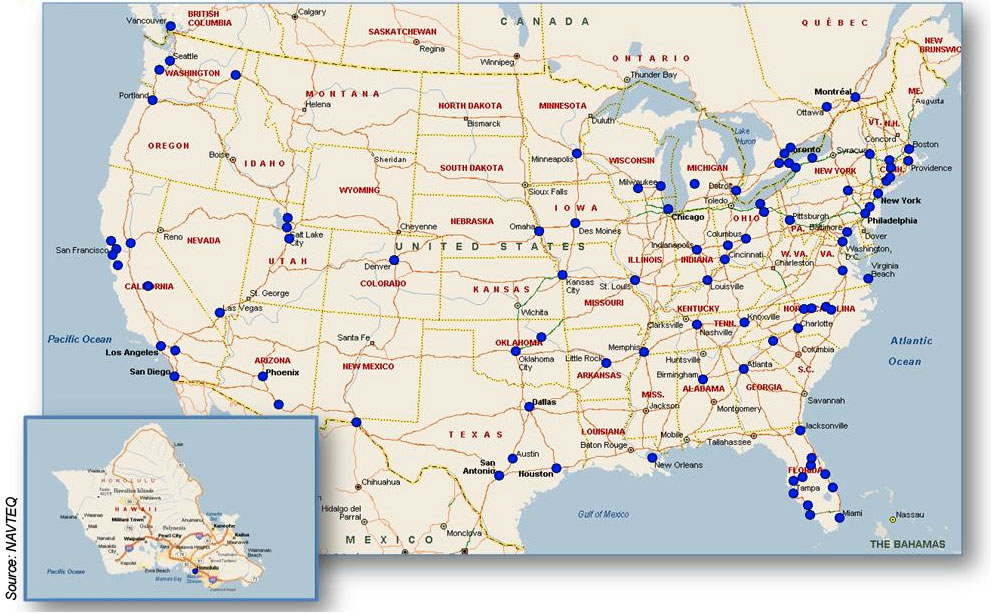
Figure 3.5: NAVTEQ Traffic CBSA Markets Map
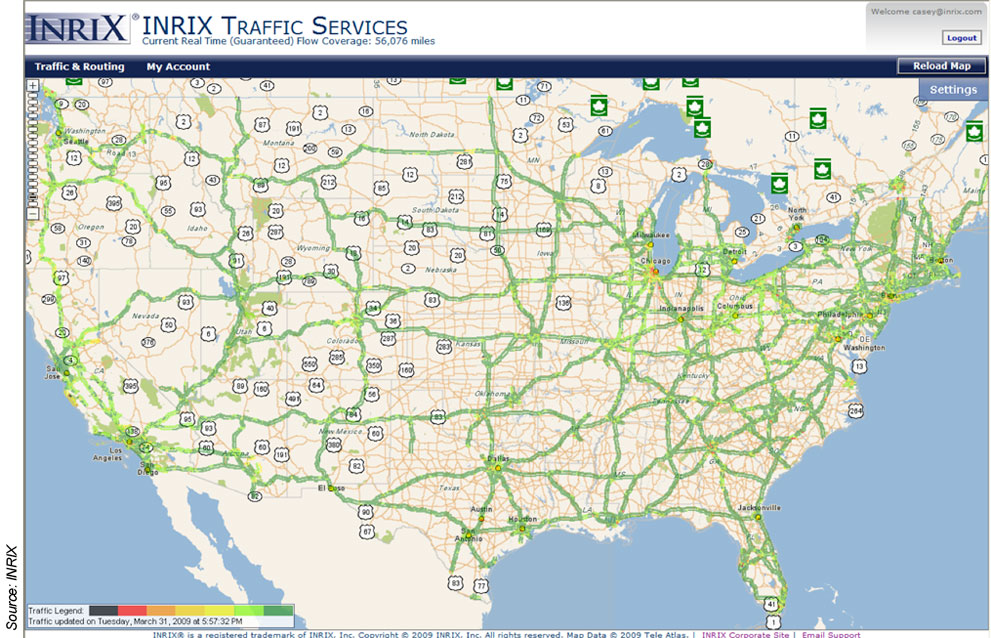
Figure 3.6: INRIX Nationwide Coverage Map
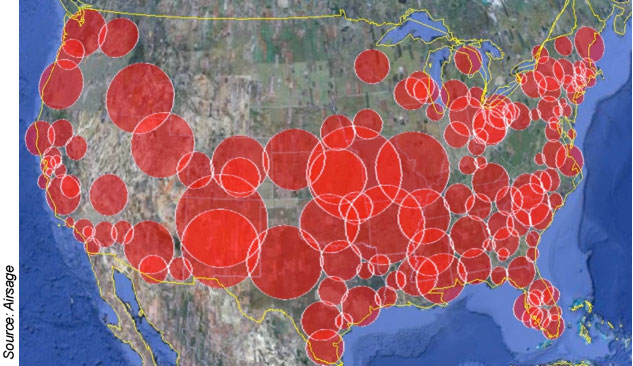
Figure 3.7: Airsage Coverage Map
Despite a few claims of nationwide coverage, most real-time traffic information providers—public and private sectors alike—focus on metropolitan areas, since this is where most of the users are and where most of the congestion occurs. For the public sector, covering primary urban freeways is enough of a challenge. For the private sector, the markets for real-time traffic information have centered on radio stations or other entities focused on metropolitan areas. That is changing with the growth of in-vehicle navigation systems, whose customers expect nationwide coverage. At the present time, however, real-time traffic data outside metropolitan areas is either limited or its quality is untested.
In the I-95 Corridor Coalition Probe Data Procurement, INRIX is providing real-time traffic data on approximately 1,500 miles of the “Core Network” as defined in the Request for Proposals (RFP), which includes Interstate and other limited access freeways in the Coalition States from New Jersey to North Carolina. In its proposal, INRIX claimed prior coverage of 1,244 miles of the 1,531 miles requested. Also requested were data on 1,000 miles of arterial roads, which INRIX offered to provide for free, but for which it would not provide assurance of its accuracy.
Other statistics of coverage reports by private-sector providers include:
- XM Satellite Radio provides traffic data from NAVTEQ in 80 metropolitan markets.
- Total Traffic Network, the traffic information arm of Clear Channel, provides navigation data to in-vehicle devices in 95 markets.
- INRIX provides incident data through a partnership with Clear Channel in 113 markets.
- TrafficCast provides flow data in 28 markets, incident data in 138 markets, and construction data in 146 markets.
- SpeedInfo, a private infrastructure-based provider, is a partner in 14 metropolitan areas. SpeedInfo provides data to both the public sector and other private-sector clients. In some cases, SpeedInfo supplements or extends current data collection strategies already in place by the public sector.
As with the public sector, private-sector providers recognize that arterial data is a key gap, and there are efforts underway to be able to bring that data to the real-time marketplace through GPS and other probe mechanisms. Although progress appears to be slow, these efforts are definitely underway. This is also one of the key components of the SafeTrip-21 Mobile Millennium program, and Caltrans is working with the private partners to be able to collect that arterial data through the private partner systems. The Mobile Millennium program uses an arterial traffic estimation algorithm that blends vehicle location data collected from mobile phones with NAVTEQ historical data collected from fleet vehicles. The real-time system can use any current vehicle location measurement and the correlation between road segments to produce an estimate of the current travel time along all segments. Arterial data will largely rely on the increase of users providing vehicle location information that travel the arterial corridors.
Firms like Waze seek to capitalize on the power of the community. With their products, each user provides information on its location and speed, which altogether comprise the traffic data that is aggregated and returned to users. More users equates to better information. Dash sells a navigation device with two-way communications, while Waze gives away free software that runs on various Smartphone platforms. To generate sufficient information for early adopters, Dash has partnered with a traffic data provider to provide a base level of information. It is not clear whether these ventures will ultimately be successful or yield sustainable business models.
3.2 Transit Data Coverage
Transit agencies of all sizes, even smaller agencies, are utilizing real-time traveler information to increase overall customer satisfaction. Each year, the US DOT/RITA surveys transit agencies across the United States to ascertain their use of transit systems management and operations tools and their deployment of ITS.
In 2007, 94 transit agencies across 6 types of transit vehicles (fixed-route buses, heavy or rapid rail, light rail, demand-responsive vehicles, commuter rail, and ferry boats) responded to the survey. For each vehicle type, agencies indicated the number of vehicles they possessed, whether these vehicles were equipped with AVL technology, and whether they electronically display automated or dynamic traveler information to the public. Table 3.4 presents the results of the survey. The table also describes information from a similar survey in 2004, to which 80 transit agencies responded regarding the number of transit vehicles that have APCs, which track the number of passengers aboard a vehicle at any given moment, even if the information is not shared with the public.
Source: RITA, ITS Joint Program Office
While it is not possible within the scope of this report to develop a complete list of every agency that provides real-time transit information, Figure 3.8 exemplifies the diverse range of transit agencies across the United States that provide some form of real-time traveler information to their customers. However, the map also shows the large disparity between agencies that have deployed AVL systems to their transit vehicles but are not fully utilizing their data by providing real-time transit information to the public. The map also shows that only two metropolitan areas have the capability to provide real-time information across multiple agencies and transit modes. Even these two agencies have yet to fully deploy these pioneering systems.
Figure 3.8: Transit Coverage Map
RITA’s annual ITS Deployment survey on transit management also documents the number of transit agencies that use several common dissemination methods to provide traveler information to the public. In 2006, surveys from 95 transit agencies were returned. In 2007, 94 surveys were returned. Table 3.5 documents the finding from these surveys.
Table 3.5: Common Transit Dissemination Methods
| Method | Number of Agencies | Percentage of Agencies |
|---|---|---|
| Using automated telephone system to disseminate real-time transit schedule adherence or arrival and departure times to the public | 27 | 29% |
| Using internet Web sites to disseminate real-time transit schedule adherence or arrival and departure times to the public | 68 | 72% |
| Using pagers or personal data assistants to disseminate real-time transit schedule adherence or arrival and departure times to the public | 13 | 14% |
| Using kiosks to disseminate real-time transit schedule adherence or arrival and departure times to the public | 22 | 23% |
| Using e-mail or other direct PC communication to disseminate real-time transit schedule adherence or arrival and departure times to the public | 23 | 24% |
| Using 511 telephone system to disseminate real-time transit schedule adherence or arrival and departure times to the public | 10 | 11% |
| Method | Number of Agencies | Percentage of Agencies |
|---|---|---|
| Using dedicated cable TV to disseminate real-time transit schedule adherence or arrival and departure times to the public | 2 | 2% |
| Using interactive TV to disseminate real-time transit schedule adherence or arrival and departure times to the public | 1 | 1% |
| Using in-vehicle navigation systems to disseminate real-time transit schedule adherence or arrival and departure times to the public | 5 | 5% |
| Using variable message signs (in vehicle) to disseminate real-time transit schedule adherence or arrival and departure times to the public | 19 | 20% |
| Using monitors/VMS (not in vehicles) to disseminate real-time transit schedule adherence or arrival and departure times to the public | 29 | 31% |
| Using audible enunciators to disseminate real-time transit schedule adherence or arrival and departure times to the public | 22 | 23% |
| Using facsimile to disseminate real-time transit schedule adherence or arrival and departure times to the public | 10 | 11% |
Source: RITA
While the above coverage statistics show that a substantial number of transit agencies are disseminating real-time transit information to the public, many agencies have yet to provide sufficient real-time information for their entire transit network. Many agencies expressed the desire to increase system coverage across the entire network and/or increase the types of information available to the network. Many transit systems lack real-time information across the entire system or were unable to effectively provide static and/or real-time information to a substantial enough proportion of the traveling public due to insufficient data collection and information dissemination device deployments. In addition to overall data coverage, transit agencies are focused on increasing the level of multimodal information coverage being utilized, with many agencies unable to provide real-time information between opposing transit vehicles and even less between transit agencies. Figure 3.9 shows the national coverage of 511 systems that disseminate transit information.
Figure 3.9: 511 System Transit Coverage
Source: 511 Coalition Content Study, 2009
AVL vendors are working with transit agencies to deploy additional real-time systems. One vendor, Affiliated Computer Services, Inc. (ACS), has deployed 60 AVL systems in the United States, but estimates that only about 10 (17 percent) have opted to leverage AVL to provide real-time information. Another vendor, NextBus Inc. (a subsidiary of Grey Island Systems International Inc.), focuses more heavily on deploying real-time information as part of its AVL systems, and has deployed real-time information for all of its 53 systems, although many are pilot implementations that have not expanded to the entire bus network. Since buses operate on arterial roads with general traffic, while rail operates on dedicated track, bus arrival times are inherently more variable. Due to this variability, AVL vendors and transit agencies generally focus on providing real-time information to buses. Vendors expect that real-time information will become more common over the next 5 years, as agencies choose to add real-time systems as part of their periodic technology refreshes every 5 to 8 years, because the incremental cost of adding real-time information to an existing AVL system is low compared to building the AVL system from scratch.
Figure 3.10 demonstrates Nextbus’ US and Canadian deployments of real-time systems. In comparison to Figure 3.8, the following map also includes several systems that have been implemented on a smaller level including several universities, which are operated by the universities themselves instead of transit agencies.
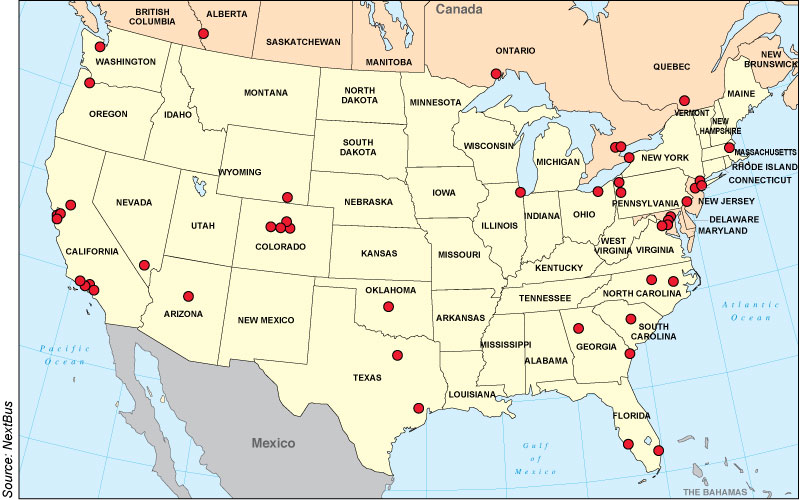
Figure 3.10: NextBus Coverage Map
When undertaking a real-time traveler information deployment, a phased approach is often used, leaving some transit routes underserved by traveler information for substantial periods of time. In general, only fixed-route real-time information is available for transit including buses, rail, and ferries. Due to the nature of its unscheduled trips, paratransit has little ability to effectively provide real-time information, although some agencies do provide static information and reverse calling when vehicle arrival is imminent. In addition to increasing the overall coverage area, agencies focus on increasing polling rates for reporting transit vehicle location updates. Los Angeles Metro currently polls every 5 minutes, but hopes to increase frequency to every 3 minutes with the integration of additional data channels. The agency has run into some difficulties due to the fact that radio channels spanning Los Angeles County are extremely difficult and costly to obtain, so the opportunity to further reduce from 3 minutes to 1 minute or 30 seconds would be difficult to achieve. The more likely option would be to move toward a public network (e.g., Sprint or Verizon), which carries hefty ongoing operational costs. A goal of sub-one-minute location polling rates is typical for many transit agencies.
Beyond the data collected by the RITA Deployment Statistics Survey, Table 3.6 contains additional data coverage metrics for several prominent transit agencies. This information demonstrates that while transit agencies have deployed real-time traveler information systems to their networks, their systems are far from complete.
Although some agencies collect APC information, they only use it for internal systems management purposes, and no instances of sharing this information with the public are known. However, some agencies, including Portland TriMet, are interested in exploring the possibility of combining AVL and APC information to provide to customers. This would allow riders to determine whether the next bus is at capacity. Combining this information with information about the arrival time of the following bus would allow passengers to determine whether they should attempt to squeeze onto the bus or wait for the next one.
3.3 Data Coverage for Parking
There are a limited number of real-time parking information deployments in the United States. Of the existing systems, most are concentrated at transit station park-and-rides, airports, and central business districts where parking is often scarce. Most parking facilities are run by individual operators, resulting in a fragmented industry with limited inter-operator coordination. Real-time parking information lacks a standardized platform to consolidate information and create region-wide information. Concerning more robust systems as part of a navigation device, many parking facilities are unwilling to implement and participate in smart parking systems until there is a more substantial customer base, and many customers and car companies are unwilling to procure parking information-enabled navigation devices until information is available from facilities, indicating cyclical inaction.
There are 12,321 parking establishments, or single physical parking locations, in the United States. Approximately half are owned by public agencies; the other half are owned by the private sector. Of the over 100 million parking spaces across the country, approximately two-thirds are off-street spaces, while the remaining third is on-street parking. Of all the facilities across the nation, only a handful have implemented real-time parking information systems that provide customers with information related to current parking facility availability. However, coverage is expanding for both access-controlled facilities and on-street parking.
Table 3.7 through Table 3.9 list the known locations and agencies across the United States that have deployed smart parking in central business districts, airports, and transit stations. The tables also indicate the level of granularity that each of the deployments displays to customers. Space-by-space systems lead customers directly to an available parking space via signage. Entry/exit systems only indicate whether there are available spaces in the lot and possibly the estimated number of spaces available, but do not indicate exactly where in the facility the available spaces are. Mixed systems have space-by-space systems in some areas of the facility and entry/exit systems in other areas. For example, some airports may have space-by-space systems in the hourly or daily lots, but entry/exit systems in the long-term lots.
Only six cities have deployed real-time parking information as shown in Table 3.7. Table 3.8 shows that of the 50 busiest airports in the United States, only 7 (14 percent) were identified to have real-time parking information. The four transit stations identified in Table 3.9 have deployed real-time parking information systems as part of pilot programs.
Figure 3.11 shows the limited number of real-time parking information systems deployed across the United States. The figure also shows two metropolitan areas in California that are developing regional real-time parking information systems, including on-street systems, that will allow customers to locate a facility closest to them within the broad regional network. While real-time information is available for a limited number of deployments, advanced static facility information is more readily available across many facilities in major cities across the country. Such information is also useful to customers, including entry and exit locations, hours of operation, height restrictions, security features, and lighting conditions. Since this advanced static information has established some data collection, aggregation, and dissemination channels, these locations may serve as good candidates for future implementations. Parking information aggregators like MobileParking and ParkingCarma are collecting, consolidating, and disseminating both real-time and static information.
Figure 3.11: Parking Coverage Map
3.4 Data Coverage for Freight
Regarding the real-time trucker traveler information technologies utilized and applications deployed, public- and private-sector traveler information applications vary in scope and delivery. Privately run systems use onboard communications systems to track and provide information to a vehicle along its entire route. These systems provide information, to at least some detail, for the majority of roads in the United States. Conversely, public systems are deployed by individual agencies and are more limited in scope. Some public-sector systems seek to add freight-specific information onto existing passenger traveler systems. Others’ systems focus on specific regions or locations where freight traffic is particularly high, such as border crossings and intermodal facilities.
Much of the focus for publicly sponsored real-time freight information systems has centered on major freight hubs and border crossings, which are choke points for the freight industry. Focusing on improving commercial vehicle throughput in these areas helps to increase overall goods movement. Currently, many of these areas lack a centralized switchboard for truckers to receive information, and trucks often lack adequate communication links with ports because there is such a vast quantity of data points. Information, particularly intermodal information, often does not flow well at such hubs due to the size of the systems and the fact that companies are hesitant to share their proprietary freight information. These facilities are frequently under the jurisdiction of public-sector entities including port and airport authorities.
Although some private-sector entities are working to provide commercial vehicles with real-time information, implementation at many of these facilities requires at least some government involvement. In some instances, the federal government has taken the lead on implementation by providing the funding, expertise, and leadership necessary to develop real-time systems such as C-TIP in Kansas City, Missouri, where trucks must frequently transport cargo from rail yards in one part of the city to another. Although the C-TIP deployment will not be completed until 2011, it will be the first fully functional cross-town real-time freight information system. The US DOT is already examining other locations for similar deployments if C-TIP is successful, including ports, airports, and rail transfer locations such as the Dallas metropolitan area or the area surrounding John F. Kennedy International Airport.
Many northern and southern border crossings are working to provide additional border crossing information, including wait times, which will be of particular interest to commercial vehicles. For example, the I-5/BC 99 crossings at the Peace Arch and Pacific Highway crossings in Blaine, Washington, display border wait times in anticipation of arrival at either of the crossings. Having wait-time information on a Website or on a sign allows vehicles to judge which crossing to enter. However, currently, only one of the crossings allows commercial vehicles, limiting the usefulness of the information for commercial operators because little choice can be made. North-to-south drivers may use the information to decide to delay their trip, but south-to-north drivers are often coming from farther away and will have little choice.
In addition to using real-time information systems to alleviate freight bottlenecks, some public-sector freight information systems have focused on providing freight-specific information via pre-existing 511 systems. Figure 3.12 shows the border crossings and intermodal facilities that have deployed real-time freight information systems. It also shows the states that are making freight-specific information available via 511 or online.
Figure 3.12: Freight Coverage Map
3.5 Trends
3.5.1 Traffic
The public sector continues to invest in detection infrastructure, and over the last several years, there has been an increase in the number of urban area freeways with real-time detection coverage. From 2004 to 2006, coverage has increased from 33 percent to 39 percent; however, there was minimal increase between 2005 and 2007 (38 percent to 39 percent, respectively). Table 3.10 shows these trends in tabular format.
| 2004 | 2005 | 2006 | 2007 | |
|---|---|---|---|---|
| Number of urban area freeways with real-time detection coverage | 33% | 38% | 39% | 39% |
The FHWA RTSMIP (notice of proposed rule issued in January 2009) in response to the SAFETEA-LU 1201 requirement could mean that this coverage will drastically increase over the next several years. The parameters of this rule include traffic and travel condition information for all Interstate highways, which includes incidents as well as construction and weather advisories. Urban areas (metropolitan statistical areas with over 1 million in population) will have stricter requirements (for latency), as well as a requirement for provision of travel times on interstate and non-interstate highways, which will require real-time speed data in order for agencies to meet these requirements. For those urban area freeways not already instrumented with public-agency-operated detection systems, agencies will need to seek alternatives to obtain this data.
The private sector continues to expand its capabilities to provide data on corridors beyond what is currently instrumented by public center-operated detection systems. Through a combination of fleet-probe GPS data; cell phone probes; privately owned detection infrastructure; aggregated public-sector detection data; incident data (from public and private entities); and in some cases, historical corridor travel patterns, there is an increased trend toward aggregating multiple data sources to be able to provide a baseline level of information on corridors that are part of the National Highway System. I-95 marks the largest corridor to date for which private-sector data has been made available. Future demand by other agencies will result in broader private-sector data coverage.
Arterial coverage remains a challenge, whether through traditional sensor-based deployment or through probe-based applications. Many arterial management agencies recognize the value in surveillance through CCTV camera or video coverage, and the quantity of deployments for arterial-based systems is increasing. Unfortunately, this deployment information is not tracked at the national level.
3.5.2 Transit
Real-time transit information is focused on improving overall data coverage by increasing information integration and information sharing. Agencies are moving toward closer integration between modes and regions, especially in larger metropolitan areas. One goal is to have a single access point for information so that users are provided with a single resource for information regarding all modes with a standardized user interface. Next-generation multi-modal trip planners have been developed in San Francisco and Chicago with real-time information included in the architecture. These programs involve multiple partnering agencies and are expensive to implement and operate, but demonstrate a need for real-time trip-planning capabilities independent of mode. The ability to integrate real-time data from multiple agencies is often more effective when using open-source solutions. Travelers’ increased use of multi-modal solutions for longer trips will drive an increased focus on collaboration and information sharing across regions. Some regions are beginning to focus on expanding into statewide systems, such as New York State’s Trips123.
Because of transit’s dynamic operational environment, providing perfect information is not possible, and providing the public with an ability to make informed decisions supersedes any operational anomalies. Some agencies, like the Washington Metropolitan Area Transit Authority (Metro), have established a goal to develop portals that make schedule data available to third parties. Google Transit has proven to be a successful partner with many transit agencies and likely will continue to be a low-cost approach to aggregate and compile data. Social networking applications can also utilize transit data to provide information to customers, providing an additional dissemination medium for transit agencies. Making real-time data publicly available is a strategy that helps agencies to reach a broader audience through a multitude of personal devices and applications. Open-source information will allow these independently developed applications to improve over time.
3.5.3 Parking
Both public- and private-sector players are interested in expanding the coverage of real-time parking information. Municipalities and private operators benefit from improving the availability and accessibility of data. The stakeholders have an interest in expanding real-time parking information on all types of parking facilities including individual facilities, on-street systems, and city-wide and regional networks.
As part of its proposal for the US DOT’s Urban Partnership Agreement (UPA), the City of San Francisco has undertaken SFPark, a smart parking initiative to create real-time dynamic pricing at the city’s parking meters and in municipal garages. The goal is to relieve congestion on the roadway network by providing dynamic pricing for parking that adjusts based on availability. The pricing structure will be designed to maintain 15-percent vacancy at any given time out of the available parking spaces. The city plans to install multi-space meters in approximately 25 percent of the city’s 24,000 spaces. In-street wireless sensors will communicate with meters to measure occupancy rates and set prices. Remote monitoring and pricing availability will allow users to confirm availability and current rates. Drivers will have the ability to receive specific parking information via cell phone or other handheld device. Information will include a warning if the meter is running out and notification of space availability. The SFPark implementation should result in a better understanding of sustainable business models and how smart parking can be used on a regional basis to relieve congestion, and could serve as a useful model for similar deployments in other regions.
After a successful pilot at the Rockridge Bay Area Rapid Transit (BART) transit station, Caltrans is currently working with the US DOT on the SafeTrip-21 initiative to deploy additional advanced parking information facilities on the Route 101 corridor in California. One such deployment under discussion by Caltrans is San Diego’s Coaster line. To bring the project to the next level, Coaster plans to implement a corridor-wide system. The Rockridge study showed that many users were driving from farther away to use the new smart parking reservation system, actually increasing their vehicle miles traveled (VMT). Implementing smart parking along an entire corridor would allow users to utilize the system at their closest transit facility, helping them decrease VMT.
Due to their additional complexity and limitations within the market, commercial vehicle real-time traveler information systems have fallen behind their passenger vehicle counterparts. FMCSA is working towards a pilot demonstration in the near future, with additional implementations to follow. Within 5 years, the agency hopes to have multiple smart parking deployments along a 50- to 70-mile stretch of a major freight corridor. One possible corridor is along I-95 between Baltimore, Maryland, and Washington, DC.
3.5.4 Freight
The trucking industry has been a cooperative partner with the government and is expected to continue this relationship. However, many experts hope that future deployments will involve an increased interaction between government and industry. Additional focus also should be dedicated to information sharing among trucking companies. Breaking down such institutional barriers will help increase overall freight movement and security. Unfortunately, trucking is such a low margin industry, often at only 3 percent to 4 percent, so most companies do not have the necessary capital to make large investments, even with a promised high return on investment. Therefore, government support will be necessary to incentivize new deployments.
Public-sector deployments likely will focus on border crossings and other choke points where there is substantial delay and real-time information is a priority. At border crossings, bi-national research and partnerships often are necessary. While its initial implementation in Kansas City will take until 2011, FHWA hopes to expand a successful C-TIP model to additional intermodal cities, such as Dallas or St. Louis. The model also may be expanded to ports and freight airports. Another federal implementation, CVII, could be used as an add-on to obtain real-world data by ensuring that new applications are compatible with the industry’s existing IT infrastructure.
Currently, the San Diego Association of Governments (SANDAG) is considering tolling area border crossings by 2013, but realizes it will need improved information to support the viability of this plan. Such a plan would require an improved IT strategy and infrastructure, innovative border-crossing strategies such as pre-clearance lanes, and more flexible Customs and Border Patrol (CBP) staff. To be effective, pre-clearance lanes would need to process vehicles at a 3-minute average per truck. The plan also will require bi-national coordination concerning how to effectively levy and collect tolls electronically across a national border. Such a system also would require industry buy-in. A toll border crossing was implemented for trucks on the Columbia Bridge near Laredo, Texas, but was unsuccessful because it rerouted trucks 14 miles and charged a fee.
Next-generation in-vehicle telematics have demonstrated several benefits over older models, but penetration among freight operators continues to lag. The newer systems use more advanced algorithms to provide drivers with improved accuracy for routing around traffic, weather, and unsafe routes, which allows for improved decision making. Also, while many of the earlier systems relied solely on satellite communications, newer systems are beginning to use a hybrid of communications that include cheaper WiFi and cellular technology. Allowing additional communications mediums also decreases the “urban canyon” effect, whereby satellites are unable to reach devices due to blockages by surrounding objects such as tall buildings. Many freight carriers do not have units in their vehicles or use outdated systems. This is particularly common with smaller carriers who do not have the capital necessary to invest in the technology and are not fully aware of the potential benefits of the more advanced systems.
3.6 Gaps in Real-Time Data Coverage
3.6.1 Traffic Coverage Gaps
Section 1201 requirements may not be easily attained by public agency systems. When considering gaps in the availability of real-time traffic information, geographic coverage (or the roads for which that information is available) is one of the most important aspects. Gaps in coverage are presented here for different types of roads and data types, including weather. Key gaps detailed in this section are summarized as follows:
- Urban Freeway Coverage Gap - Only about 39 percent of urban freeway miles have sensor coverage to supply real-time traffic flow data; and even the largest cities fall significantly short of full freeway coverage.
- Rural Highways Flow Data Gap - There is a lack of coverage on rural freeways, with minimal traffic sensor coverage. Additionally, the private-sector data providers have a difficult time with rural freeways because of the low traffic volumes and sparseness of probe data points on these roads.
- Rural Highways Incident Data Gap - Statewide real-time incident reporting coverage does not occur. Although many states have implemented incident and event reporting, most do not exist on rural highways.
- Arterials Flow Data Gap - Real-time traffic information on arterials is scarce, and most arterial detection is tied to localized intersection-based signal operations, rather than traveler information.
- Local Roads Incident Data Gap - Most statewide systems that support traveler information have been designed for state corridors and facilities, so there are few that have the capability to support arterial information.
- Quantifying Coverage of Public-Sector Systems - There is a gap in reporting on public-sector data coverage, and the Deployment Statistics Database has gaps in its reporting due to a lack of survey response from different agencies.
- Route-Specific Weather Data Gap - There is a significant disparity in RWIS coverage between states, even in states with mature RWIS programs. There are wide swatches of area in adverse weather areas with no RWIS sensors.
3.6.1.1 Urban Freeway Coverage Gap
Agencies, the private sector, and industry experts generally agree that there is good coverage of urban area freeways through public-sector sensor deployments. However, gaps still exist. According to 2007 data from the US DOT Deployment Tracking Database, for a sample of 64 metropolitan areas surveyed, only about 39 percent of urban freeway miles have sensor coverage to supply real-time traffic flow data to traveler information and other traffic operations activities. This is up from 33 percent in 2004, but there remains a significant gap in data coverage considering urban freeways experience the majority of the nation’s traffic, congestion, and travel-time variability. In most major metropolitan areas, there is at least one major freeway facility without any sensor coverage at all. This equates to many miles of roadway experiencing significant congestion and travel-time variability where the public sector is not able to accurately capture real-time corridor conditions.
Even within the context of urban areas, however, different sized urban areas have different amounts of congestion, incident activity, and priority given to real-time traffic information. Figure 3.13 shows the total freeway mileage and the freeway centerline miles with real-time data collection technologies for the largest 50 metropolitan areas. The source of the freeway mileage is the National Highway Planning Network (NHPN). These data include roads designated by the NHPN as “Interstate” and “Urban Freeway.” They do not include any arterial miles. The source of the freeway centerline miles with real-time data collection technologies is the US Deployment Statistics Database.
Figure 3.13: Urban Freeway Miles and Miles with Real-Time Data Collection Technologies in the 50 Largest US Metropolitan Areas, Ranked by Population
The largest cities tend to have a higher percentage of freeway miles covered, although even the largest cities fall significantly short of full freeway coverage. It should be noted that these data are self-reported and may not accurately represent all metropolitan areas. There are several cities that did not have any coverage reported, although they are known to have ITS deployments. States indicated that gaps exist in the coverage that their systems currently provide. However, there are limitations as to how much detection infrastructure can feasibly be deployed and maintained with current resource constraints. And in many cases, funding ongoing maintenance is an even bigger challenge than funding new sensor deployments.
It also should be noted that these coverage data only include sensor coverage and not incidents, construction, weather, or other types of data. That being said, public agencies will typically only report incidents in areas where they have the ability to visually confirm reports through camera imagery, which tends to cover roughly the same roads as their traffic sensors.
The private sector is beginning to fill real-time traffic information coverage gaps through non-infrastructure-based methods. In fact, multiple private data providers offer traffic data on all urban freeways within the top 100+ markets. These data are not of the same resolution as sensor data. They measure only speeds and not volumes, occupancies, or lane-by-lane data. The private-sector data is not always integrated with DOT or metropolitan organizations’ central databases, but often it is available to the public for free on Web sites such as Google, Yahoo!, NAVTEQ Traffic, and Airsage.
3.6.1.2 Rural Highways Flow Data Gap
While urban freeways still have significant gaps, a lack of coverage on rural freeways is an even larger gap. Rural highways may have some environmental sensor stations and sporadic camera coverage, but there is typically minimal traffic sensor coverage. In addition, the private-sector data providers have a difficult time with rural freeways because of the low traffic volumes and corresponding sparseness of probe data points on these roads. Rural highways are typically a low priority for the public sector apart from traffic counts and weather applications in specific locations, especially considering the gaps in coverage in urban freeways. Public-sector representatives indicated a desire to provide more data on rural highways and noted increased requests from the public, but it is not financially feasible to do so. Despite the lower priority of local roads, there are certain rural areas that experience heavy seasonal congestion such as ski areas, which warrant traveler information. In fact, traveler information may be more valuable in these areas due to the direct economic impact of this travel and because vacation travelers are less able to anticipate traffic delays or know of alternate routes than urban commuters.
Nonetheless, the private-sector focus continues to be on Interstate routes in and near major metropolitan areas. Private-sector representatives indicated that although they do have capabilities to provide flow and speed information estimates on rural corridors, the demand is not as high as for urban areas. Some within the private sector also indicated expected growth in this market. In addition, past business models for traveler information were centered on FM broadcast areas, which do not typically extend into the rural areas. As a result, there was no basis for ad revenue associated with more densely populated urban areas. Moreover, as the market continues to evolve with satellite and Internet radio and in-vehicle systems, private-sector representatives expect former broadcast mindsets to change and demand will likely increase for rural area corridors.
Some providers are now claiming coverage of inter-city rural highways. However, at this early stage, it is difficult to discern the quality of the data available on low-volume roads. For the private sector, extent of coverage is closely tied to data quality. Since there is no public sector infrastructure (like what is available from freeway management system sensors in the urban areas), data comes from vehicle fleets, which may travel on any road in the country. With a sufficient pool and variety of vehicles within the data set, coverage can be obtained for any road on which these vehicles typically travel. However, the quality of the data depends on the number of data points that can be obtained through moving vehicles. The greater the density of data points, the better the accuracy of the data. Therefore, coverage must be defined not in terms of whether data points are available on a particular segment of roadway, but on whether there are sufficient data points to provide information of sufficient accuracy for the applications for which it is intended. If the application is a color-coded congestion map, the accuracy threshold is lower and the extent of coverage higher. If the application is to post travel times on a DMS, that requires a higher level of accuracy and fewer miles of the available coverage can meet that requirement. For these data sources, the accuracy is location-specific because it depends on the underlying vehicle fleet mix used to derive the data as well as the methods used to combine disparate sources of data, including historical data. These data sources are only beginning to be evaluated as more public-sector agencies purchase this data and perform accuracy studies. Public agencies purchasing this data are also becoming more interested in its underlying sources, whether it is predominately historical or real-time, and how much confidence the provider has in it.
3.6.1.3 Rural Highways Incident Data Gap
Currently, statewide real-time incident reporting coverage (to include rural area Interstates, state routes, and US routes) does not occur. Many states, however, have implemented incident and event reporting systems to capture construction, planned events, and incident information, although most of this is not real time. The accuracy of these systems is directly linked to regional/district as well as statewide resources keeping the information up to date. Agencies indicated the existence of challenges internal to their organizations that made it difficult to capture all of the events, as well as keep information current once it has been entered. Internal resource constraints, particularly regional and district staff needing to be responsible for a broad geographic area, may mean that staff are focused on responding to incidents or hazardous conditions, and are not able to access agency databases to continually update the situational information.
There is recognition that there is available data (through law enforcement/police CAD systems and other agency systems), but there has been a challenge in harnessing that data into a workable database. CAD systems tend to reside with local jurisdictions, and there are many different CAD vendors with no widely adopted standards for sharing information between them in real time. In one metropolitan area, there can be numerous different CAD systems in place, including state police/law enforcement; multiple fire/rescue organizations; multiple local law enforcement agencies; and in some areas, a separate 911 public safety answering point. There are excellent examples of state DOT and state police/law enforcement CAD data sharing, which supports more effective DOT response, as well as provides more comprehensive and timely data to support traveler information systems. In some states, however, there are multiple responder agencies that could take responsibility for incidents on state routes. Furthermore, while some agencies have adopted standards for exchanging data between public safety CAD systems and ATMS software used by DOTs, most CAD systems—and there are many different vendors—do not follow ITS standards voluntarily. While it is becoming more common to integrate platforms, these are site- and vendor-specific integrations. As a result, for a DOT to integrate with CAD systems over a regional area, it must be repeated for each CAD system, and rural areas tend to be the last with which to be integrated.
3.6.1.4 Arterials Flow Data Gap
Partly due to technology limitations and partly due to other factors, real-time traffic information on arterials is scarce. Most arterial detection is tied to localized intersection-based signal operations (or in some cases, corridor signal operations) rather than traveler information. As a consequence, stop-bar or system detectors do not provide information that is directly meaningful to the public. This is partially a technology challenge and partially an institutional challenge. Industry experts indicated that the information available currently for arterials is primarily intersection detection data, but it is used exclusively for signal control; information does not leave the controller. With additional investment in communications, there could be a great deal more data transmitted to TMCs.
The institutional challenge is in how that data is reported. Signal systems are local in nature, and a region may have several different signal systems owned by several different local agencies. There are no widely adopted real-time information exchange standards for signal systems, and there is little demand for such standards by the agencies that deploy signal systems. Some regions, in support of regional initiatives, have requested Synchro files from local signal systems as these file formats have become a de facto standard for signal timing information. Nonetheless, this information is not real-time, and is better suited to support internal operations rather than dissemination of external traveler information to the public. There is potential for probe data to fill these gaps, but market penetrations are not yet sufficient given the variability of travel times between individual vehicles. Infrastructure-based methods that track individual vehicles at high market penetrations hold the most promise for arterial travel times. This addresses the technology challenge, but the institutional challenges remain.
3.6.1.5 Local Roads Incident Data Gap
Because most statewide reporting/data systems that support traveler information have been designed for state corridors and facilities, there are few that have the capability to support arterial information. Some state DOTs have expanded their reporting systems to include arterials on a limited basis, to at least be able to capture incident or planned event information for those routes. The impetus for doing so has been to include this information on 511 phone and Web-based services. Barriers to addressing this include funding and resources.
One key challenge to providing incident data on arterial streets is the same as for rural incident data—decentralized CAD systems. While a DOT may integrate its traffic management software with a state police CAD system, which covers major freeway routes in an urban area, most 911 calls are routed to local dispatch centers with their own CAD systems. As there may be several disparate CAD systems in a region, to cover arterial streets, several different CAD systems need to be integrated.
3.6.1.6 Quantifying Coverage of Public-Sector Systems
In the development of this report, it has become clear that there is a gap in reporting on public-sector data coverage. The Deployment Statistics Database has gaps in its reporting due to a lack of survey response from different agencies. Previous sections of this document show some of the holes in this data for real-time data collection technologies (i.e., sensor and toll tag reader coverage). In addition to flow data, actual incident management coverage is difficult to assess, as is construction. That being said, 511 systems tend to provide broad geographic coverage of construction information, including most state roads in addition to Interstates and freeways. To assess coverage against requirements under the RTSMIP, current methods of assessing data coverage may need to be made more rigorous.
With regard to usage, there is no single measure of system usage for 511 systems, although 511 phone and Web services provide one of the most quantifiable usage source data for public-sector traveler information systems. With a 511 phone system, operating agencies can track the numbers of calls, when calls come in and from where, and the types of information that are being requested. At the national level, the 511 Deployment Coalition is tracking 511 phone usage from each system in operation, and uses this data to develop statistics and monitor usage trends over time. Traveler information Web sites pose different challenges for tracking usage; some systems track Web hits, others track user sessions. Depending on how a Web page is configured, multiple hits can register even though a user has not navigated from a home page. This will over-represent usage when compared to a metric based on user sessions. For systems where contractual payments are tied to usage, it may not be straightforward to achieve standardized definitions of usage.
3.6.1.7 Route-Specific Weather Data Gap
There is a gap in weather data as the information is generic when it is communicated to the public. The collection efforts may be route specific, but 511 and other traveler information services do not typically provide route-specific information to the public. The private sector is trying to use more route-specific weather data in their content.
3.6.2 Transit Coverage Gaps
While many transit agencies are deploying real-time information systems, many transit vehicles are still not equipped with the necessary technologies. Of those agencies that have deployed systems, most have not yet offered fully integrated coverage across their network and within their regional metropolitan area. Key gaps detailed in this section are summarized as follows:
- AVL Gap – While the number of transit vehicle is increasing, 62 percent of vehicles are not equipped with the AVL systems necessary to provide real-time vehicle location information.
- Communications Gap – Communications infrastructure is often not sufficient to provide real-time information, including networks that are unable to support the amount of data sent by large fleets.
- Regional Information Gap – There is a lack of system coverage at the regional level, including providing consolidated real-time information from transit agencies operating within a single region.
- Real-Time Information Deployment Gap – Some agencies have deployed AVL to a substantial portion of their transit vehicle, but have yet to leverage AVL information to provide real-time information; other agencies have developed the means to disseminate meaningful static information, but have not implemented real-time applications.
- Vehicle Capacity Information Gap – Although some agencies collect passenger count information, no transit agencies are currently sharing the information with their constituents.
- Modal Information Gap – Few agencies have developed integrated traveler information between modes, including traffic, transit, and parking. Integrating modal information is necessary to obtain real-time information for an entire end-to-end journey.
- Integrating Real-Time Information from Multiple Vehicle-Types Gap – Within transit agencies that operate a variety of types of transit vehicles (light rail, bus, ferry, etc.), there is a lack of integration of real-time information across various vehicle types, preventing customers from receiving end-to-end trip information.
3.6.2.1 AVL Gap
While AVL is becoming more common for transit agencies to own and operate, many agencies are still without AVL, often due to funding limitations or a perceived lack of need by agency managers. Despite this reluctance, many agencies are striving to increase AVL deployments to all transit routes. As a result, the number of transit vehicles with AVL has increased approximately 5 percent per year over the past decade as transit agencies discover the benefits of AVL and conduct periodic technology refreshes that include AVL, and as the public places a higher priority on receiving real-time information. Currently, 62 percent of transit buses across the country are equipped with AVL. However, 58 percent of those AVL-equipped transit buses do not provide real-time information to the public. As additional agencies bring AVL online, peer-to-peer networking could help these agencies learn to use their new data.
3.6.2.2 Communications Gap
While able to deploy AVL across a substantial part of their network, some transit agencies are unable to provide the communications infrastructure to support the collection of AVL data and dissemination of real-time information. The sheer size of some larger agencies’ service area and vehicle fleets can prevent them from being able to implement robust real-time information systems. For example, CTA operates approximately 2,000 buses. If the agency were to provide real-time information for the entire fleet, a communications backbone would have to be developed that could handle the vast number of data packets to be sent with enough frequency to enable real-time information. With the limited number of radio frequencies available to transit agencies for their private communications network using land mobile radio systems, real-time information needs are difficult to support. The agency may be able to work around this existing issue using wireless networks including cellular or WiMAX, which each present various implementation challenges. The agency is attempting to develop inexpensive methods to exchange data using the Internet and XML technologies as well.
3.6.2.3 Regional Information Gap
While a desire exists to provide real-time information across regional transit networks, none have currently developed the ability. The New York State Department of Transportation (NYSDOT) developed Trips123, which consolidates static transit information from agencies throughout the state. However, the system is currently unable to provide real-time information via the aggregated sources. Similarly, Los Angeles Metro has contracted to receive information from a large number of transit agency and bus service provider partners in Los Angeles County, although most of the information is primarily related to trip-planning functions and is based on scheduled, not real-time, information. Los Angeles Metro hopes to adopt a phased approach to include additional transit agencies with real-time information via 511 and Websites, but realizes that each agency requires its own integration timeframe. The Chicago Regional Transportation Authority (RTA) has been able to develop a real-time information network with other major transit agencies able to provide real-time information, including CTA, Chicago Metra, and Pace Suburban Bus Service. However, the system has yet to be deployed to the public.
The Metropolitan Transportation Commission (MTC) in the San Francisco Bay Area has developed a similar application in partnership with BART and the San Francisco Municipal Transportation Agency (Muni). Portland TriMet has also developed a robust real-time, next-arrival information network. It has set an aggressive goal to incorporate all transit users into a single system. As compared to US transit agencies, European agencies, including Turin Metro, Italy, and Transport for London, England, have developed more integrated data collaboration and information-sharing tactics between agencies and may serve as a model for US agencies.
There exists a need to increase system coverage within both single transit networks and within the regions. Several agencies indicated that due to rolling deployments or funding restrictions, they have deployed real-time information on only part of their agency’s transit network, and have not yet been able to deploy across the entire system. Some transit agencies worry that they will not be able to deploy and support real-time traveler information in favor of continuing to support core transit functions based upon existing funding realities.
Some transit agencies have already begun to deploy regional traveler information systems using static information. One of the most robust is NYSDOT’s Trips123, which aggregates static transit information from over 130 operators across the state. While Trips123 customers find the system highly effective, adding real-time information to the system is thus far out of reach for the agency. Chicago RTA has deployed an interagency transit information system with some real-time functionality, but only some routes are available as real-time information. In addition to increasing the amount of real-time information available, Chicago RTA sees a statewide system as a potential next step for the agency. As advanced as the systems offered by NYSDOT and Chicago RTA are, they are still well behind some European systems, including an extensive country-wide system in England that uses a national trip planner.
3.6.2.4 Real-Time Information Deployment Gap
The number of transit vehicles equipped with AVL systems has increased substantially over the past decade, such that agencies responding to the RITA survey report that approximately 62 percent of their transit vehicles were equipped with AVL as of 2007. Many agencies have deployed AVL with a primary focus on operations and fleet management, but they lack the capacity to disseminate real-time transit information to the public. A far greater number of agencies are able to disseminate static information, but not real-time information. Google Transit currently provides static transit information for over 100 metropolitan areas, but is not capable of receiving real-time information from its transit partners, although it has expressed interest in moving in that direction. Figure 3.14 shows the extensive static coverage that Google Transit has achieved by collecting information from transit agencies. Future technological advancements and data sharing could potentially allow this information to be displayed in real time.
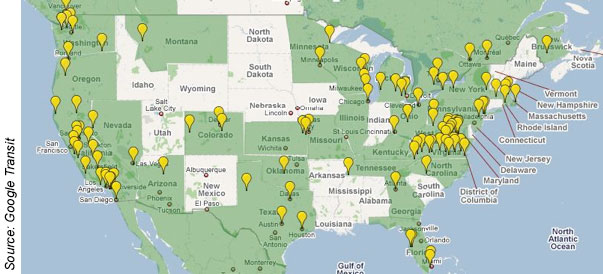
Figure 3.14: Google Transit Coverage Map
3.6.2.5 Vehicle Capacity Information Gap
APCs could be included as part of a real-time information offering. Providing this information for passengers waiting for a transit vehicle, in conjunction with vehicle location, could offer them the ability to improve the comfort of their journey. For example, if a wayside sign was able to indicate to a customer that the next bus is nearly at capacity, but a nearly empty bus would be arriving shortly thereafter, the customer would be more likely to wait for the less crowded bus, improving the riding experience. However, some issues exist in providing APC information to customers. For example, providing customers with APC information may cause situations whereby too many customers decide to wait for emptier buses, which then reach capacity quicker than usual impacting load conditions downstream.
3.6.2.6 Modal Integration Gap
Agencies are also aware of the need to better integrate traveler information between modes, including traffic, transit, and parking information, as information involving each of the modes is often necessary for an end-to-end journey. The integration of such modes should focus on combining alternatives and supplying a singular source for information where each mode has a similar look and feel. Websites are seen as having the most to offer in terms of providing multimodal information to customers. Institutionally, there is often a disconnect between who should tackle this responsibility as real-time traffic information is often the responsibility of state DOTs, while transit information is the responsibility of transit agencies, and parking information may be the responsibility of any number of municipal or private entities. Technical barriers are also common, including conflicts with matching routing algorithms.
3.6.2.7 Integrating Real-Time Information from Multiple Vehicle-Types Gap
The other type of multimodal real-time information is transit information within a single agency, but within multiple vehicle types. Many agencies expressed the desire to incorporate this type of real-time trip planning. Although no systems are currently operational, both Chicago and San Francisco have developed such systems (however, they have not yet gone live). Many agencies do not believe they will be able to afford such expensive, robust systems at this time or in the near future. Since each mode is still generally a public medium, open-source solutions may present methods to make such systems more ubiquitous.
3.6.3 Parking Coverage Gaps
3.6.3.1 Mapping Data Gap
Currently, the parking industry is fragmented in both its operation and sharing of information, especially between public and private operators. Although a handful of private companies have begun the process, there is a substantial gap in the mapping of parking spaces and parking information across metropolitan areas and regions. It is important to map not only the location of parking spaces but also attribute-level information such as whether a space is in a safe neighborhood, its proximity to notable destinations, its security features, and its lighting conditions. This information can be developed by private companies as well as commented on by social networking applications. The public sector can also play a substantial role in developing region-wide and interregional parking information.
3.6.3.2 Standardization Gap
As part of aggregating parking information, processes must be developed to standardize information, including a platform to compile and share data. This includes a standardized set of measures for defining parking facility attributes. This will allow for the integration of data sources that can be consolidated not only to map parking spaces but also for planning, efficiency, and congestion research purposes.
3.6.3.4 Deployment Gap
The deployment of real-time parking information systems has been relatively sparse. While it is only practical to deploy in parking facilities frequently at or near capacity, such as transit station park-and-rides, airports, and central business and entertainment districts, many congested areas lack any parking information. Improvements in communications and sensor technology should make implementation more practical and affordable, allowing for more sector deployments. Even fewer on-street smart parking systems have been deployed, although San Francisco’s full-scale implementation of real-time parking information dynamic parking rates via the SFPark program could provide a workable model for other cities to emulate. Additional deployments should focus on expansion toward corridor-wide deployments on transit lines, such as a Caltrans’ deployment of smart parking information facilities on the Route 101 corridor in California as part of SafeTrip-21.
Finally, no commercial vehicle smart parking systems have been deployed, although the FMCSA is currently planning several pilot implementations. Successful pilot demonstrations should be followed by a corridor-wide deployment.
3.6.4 Freight Coverage Gaps
3.6.4.1 In-Vehicle Communications Systems Usage Gap
The commoditization of in-vehicle communications systems will allow for more operators to procure real-time information, although the still substantial price may make such devices still out of the reach of carriers and industry sectors operating on thin margins, including drayage operators in ports and intermodal facilities. Many operators, especially older, less technologically advanced truckers, still may not fully understand the benefits of such systems. Additional outreach is required to show them the clear purpose of collecting and disseminating such information and prove to them that the information will not be used against them for enforcement purposes or to help their competitors.
3.6.4.2 Public-Sector Deployment Gap
To improve the real-time information available to commercial vehicles, the public sector needs to deploy additional real-time information applications. This includes both state/region-wide add-ons to existing passenger vehicle 511 systems, as well as increased coverage to traditional freight bottlenecks, including intermodal facilities and border crossings. Few agencies implemented freight-specific add-ons to their 511 systems, although programs at Washington DOT and Florida DOT may serve as a useful model. While several information systems have been deployed to areas with freight bottlenecks, additional freight-congested areas should be identified. While some borders crossings are providing real-time information, there are currently no crossings that have successfully deployed a system that provides truckers with multiple realistic crossing alternatives.
3.6.4.3 Inter-jurisdictional Systems Gap
A substantial gap exists in the ability to establish information-sharing agreements across jurisdictional boundaries. The current funding model places limitations on inter-jurisdictional systems, creating a situation where states do not place a high value on developing partnerships. Some states are naturally more inclined to promote inter-jurisdictional information sharing, such as Maryland, Virginia, and the District of Columbia, because they share a major metropolitan area. An important place to start is encouraging counties that border another state to reach across state lines to neighboring counties. Other regional partnerships are also developing. The I-95 Corridor Coalition, a consortium of east coast transportation agencies, is currently collaborating to build an interstate real-time traveler information network, including freight information. The coalition has successfully designed programs to improve commercial vehicle operations throughout the member states.
3.7 Closing the Gap and Roles for the US DOT
For organizations to provide comprehensive data collection on their networks, alternative solutions to infrastructure-based deployments are required. These solutions may be enabled by advancements in probe-data technology and other private-sector innovations. Additional data sharing needs to occur between organizations that are successfully procuring and integrating probe data from third-party entities.
In the development of this report, it has become evident that there is a gap in reporting on public-sector data coverage and concise reporting on private-sector coverage as well. The ITS Deployment Statistics Database has gaps in its reporting due to a lack of survey response from different agencies, and it does not include any reports from private-sector data entities. The ITS Database could also improve upon its tracking of arterial coverage as well as soliciting responses from smaller metropolitan areas.
For transit applications, it is important to encourage infrastructure deployments to improve fleet tracking data, improve communications alternatives, promote interagency partnerships, and promote clearly planned timeframes for system expansions and improvements. For infrastructure-based improvements, organizations should encourage the deployment of AVL on transit vehicles. This includes working with transit agencies to fund the deployments and to educate agencies on the benefits of deployments including real-time traveler information, systems operations and management, and performance measurement. To support comprehensive data collection on larger fleets and larger geographic areas, agencies must work to deploy WiMAX, cellular, and other communication networks that can be used by transit agencies.
Partnerships that promote interagency deployments and coordination should be promoted. The relationships should focus on multi-modal regional real-time information and involve coordination between transit agencies and the private sector. Additionally, transit agencies should be encouraged to develop comprehensive timetables for real-time deployments including an analysis of limitations or restrictions within existing policies. Lastly, agencies should move toward modal integration of real-time information for interagency coordination to consolidate data between state DOTs (traffic) and transit agencies (transit).
In addition to supporting transit solutions, funding for public WiFi and other open-air communication networks also can support smart parking and other ITS technologies. Expanded data collection for parking spaces should include location attributes such as whether a space is in a safe neighborhood, proximity to notable destinations, security features, and lighting conditions. To provide consistent data, it is important to develop a standardized set of measures for all parking space attributes. The consistency of data will provide for easy integration of data for mapping of parking spaces, but also for planning, efficiency, and congestion research relative to parking. Similar to emerging technologies in traffic data collection, it is important to continue funding pilot deployments, especially for smart parking for commercial vehicles and developing sustainable business models.
With regard to commercial vehicle operations, outreach programs that focus driver education on the benefits of technology are important. Outreach programs should focus on the fact that data collection and the dissemination of real-time information will not be used against drivers for enforcement purposes, nor to benefit competitors—they will be used for the greater good of the industry.. This outreach can use existing organizations and channels through FMCSA and state partners. To improve national freight movement, deployments of real-time information should be expanded at border crossings and intermodal facilities. Lastly, inter-jurisdictional systems for freight should be encouraged.