5. Efficiency Benefits Assessment
The goal of this Efficiency Assessment is to define and estimate the test technologies suites' ability to enhance motor carriers' financial performance and determine whether efficiency gains, if any, are adequate to induce motor carrier investment.
5.1 Approach to Determining Technology Efficiency Benefits
As described in Evaluation Technical Memorandum 4: Motor Carrier FOT ROI and Performance Measures,[7] the calculation of operational benefits, associated with the FOT technologies is one component of the broader benefit-cost assessment, detailed in Volume III, Section 2, and described in Section 8 of this synthesis document. The broader Benefit-Cost Assessment also takes into consideration the potential security benefits of the FOT technologies. In examining only motor carrier efficiency, it should be noted that a number of the technologies are primarily security-oriented in nature, and do not necessarily create a measurable operational improvement through their use (i.e., Panic Buttons or E-seals).
Regardless of technology configuration in the FOT, two technologies create the enabling platform on which the other test technologies operate – Wireless Communications and asset positioning/tracking. Through discussions with the participating motor carriers, these two capabilities provide the majority of measurable operational benefits. Without these two capabilities, potential operational, as well as safety and security benefits of the other test technologies, could not be realized.
5.1.1 Definition of Benefits
Based on the information collected during the FOT, at the micro or carrier-level, benefits were accrued through closer management of assets and personnel. Better management reduced out-of-route miles, enhanced driver productivity by facilitating the monitoring of location and driver work status, and through dynamic routing, potentially realized the opportunities for additional loads. The core mobile communications and asset tracking enabled the motor carriers to monitor their fleet operations both in near real-time and through historic record analysis to set tighter performance measures, and to realign fixed and variable routing decisions.
5.1.2 Analyses
Due to differences in the types of operations represented by the four load types in the FOT, the following two distinct analysis types (described in detail in Sections 5.2 and 5.3 of this synthesis document) were used to assess potential benefits for the participants:
- Input Factor Productivity, which allowed for determining increases in output for a given level of an input, or conversely, reducing the required level of input for a given output (i.e., increased number of pickups and deliveries for a given number of drivers).
- Partial Budgeting (of revenue increases and cost decreases), which was based on examining only those line items that represent a change from a baseline environment. Specific to this analysis, only those cost and benefit streams directly associated with the technologies' ability to effect change were considered.
5.2 Input Factor Productivity
This approach establishes and monetizes input factor efficiency in terms of increased output, holding other inputs constant, which was considered an appropriate framework for the 1A-B Bulk Fuel and 2B LTL (Non-Bulk pick-up and delivery [P&D]) scenarios in which driver productivity is a key operational metric.
Two analyses were conducted using Input Factor Productivity techniques – one for Bulk Fuel and another for LTL-Non-Bulk type operations because the participating motor carriers supplied two distinct types of operational data. The two analyses are described in the following Sections 5.2.1 and 5.2.2.
5.2.1 Bulk Fuel Analysis
The motor carrier represented in Scenario 1 operates under contract to customers to deliver gasoline to stations within approximately a 2-hour drive form the terminal. The key driver performance metric is percent of on-time performance versus a target schedule developed based on historical trip times. This motor carrier closely monitors this performance on a weekly basis to manage the drivers' productivity. The higher the percentage of on-time occurrences, the more trips can be made in a given day, thus reducing marginal driver costs, and maintaining customer satisfaction. This means that the driver cost per delivery declines.
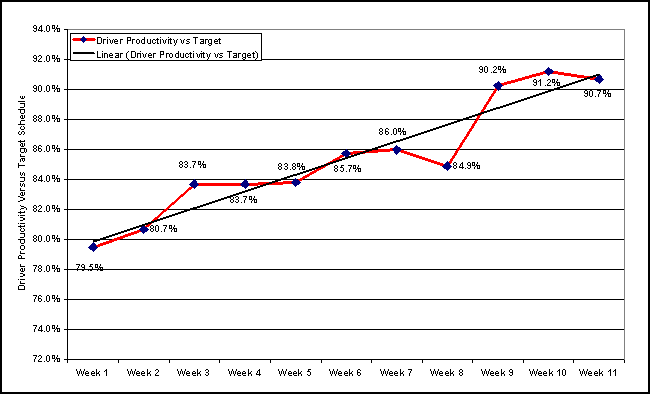
This motor carrier recently began using a Wireless Communications with GPS system to more accurately capture time-stamped events (start and end of day, breaks, arrive/leave rack, arrive/leave customer locations, etc.). The motor carrier provided the weekly performance statistics for 19 Bulk Fuel delivery drivers based at the main carrier terminal. These data covered an 11-week timeframe, beginning in mid-December 2003 (when the system was proved out and employees trained and familiar with the system). The weekly driver productivity reports demonstrated an overall increase in driver productivity over 11 weeks of 11 percent, bringing the aggregate level to approximately 90 percent of target. This level is seasonally adjusted to reflect varying operating demands throughout the year. This is considered a high level of utilization, but through monitoring and driver management efforts, the carrier continues to maintain and increase the level. Figure 5-1presents weekly average driver productivity levels versus target for the 11-week period.
Given the relatively small sample size over a relatively short period of time, the statistical significance of the observed productivity gains was tested and shown to be statistically significant at the 95 percent confidence level. In other words, the observed gains in productivity are real and not the result of sampling error.
To impute a cost savings (benefit) of these productivity gains, the loaded driver cost for this industry segment of $21.24 per hour was used.[8] The calculation of driver cost savings is defined as follows:
Percent Productivity Gain x Hourly Driver Cost x Hours Worked/month
= Monthly Savings/Driver
= 11% x $21.24 x 208 hrs/month
= $486 per driver per month, or approximately $5,800 per year.
This benefit estimate can be used as a per truck estimate, if one assumes one 8-hour shift per day. For those Bulk Fuel operations operating two shifts, the estimated per truck benefit can be doubled to $972 per truck per month.
5.2.2 LTL-High Hazard (Non-Bulk) Analysis
The participating motor carrier in Scenario 2 began a phased approach to installing the Wireless Communications with GPS vehicle positioning system into its fleet on a terminal-by-terminal basis in 2000. The deployments are currently ongoing, and since the end of 2003, trucks at over 2,000 terminals have been equipped with Wireless Communications with GPS tracking.
For each phase of the deployment, the resulting changes in performance are normalized to a Year 0 and averaged across a taper for Years 1–3 following deployment. (Year 3 is the last year where at least two "deployment class years" are represented.) This was done to account for any potential "learning curve" or adoption/productivity initial impacts that may exist. Additionally, a "non-technology" sample of terminals was available from the motor carrier to provide a "without" baseline for comparison purposes.
The net gains represent the difference between the driver productivity (as defined by pounds per hour picked up and delivered while on duty) for the "technology-equipped" terminals and those without the technology. By Year 3, average pounds per hour for the terminals with Wireless Communications with GPS vehicle positioning equipped trucks were 3.5 percent higher than for those terminals with trucks not equipped. Closer management of driver en-route activities (monitoring of driver downtime), improvements in dynamic routing decisions based on known vehicle positions are the primary contributory factors in realizing the improvement.
To impute a cost savings (benefit) of these productivity gains, the loaded driver cost for this industry segment, the same methodology was used as for the Bulk Fuel scenario. The value of these driver productivity (P&D) gains is calculated as:
3.5% net P&D increase x $26.42 avg. loaded driver wage/hr. x 173 hrs
= $160 per driver per month, or $1,920 per driver per year.
If one assumes one 8-hour shift per day (which is conservative, considering LTL shifts can run up to 10 hour days), then the per truck benefit would be $160 per month. Table 5-1 presents the yearly driver productivity gains.
| Year | Net Increase in Driver Productivity |
|---|---|
| Year 1 | 2.3% |
| Year 2 | 3.4% |
| Year 3 | 3.5% |
5.3 Partial Budgeting
The second approach that examined the impacts of technology on operations uses a framework that specifically examines the impact of technology on:
- Increased driver to dispatcher ratios.
- Reduced on the road delays.
- Reduced fuel consumption.
- Reduced out-of-route miles.
This modeling framework, best suited for operations approximating line haul, was found to be appropriate in assessing ROI for the following scenarios: 2A LTL-High Hazard; 3A-C Bulk Chemicals; and 4A-B Truckload Explosives.
The inputs were derived from carrier-provided operational and financial data, as well as anecdotal information, detailed analysis of archived data for the test trucks, and from published sources.
As the participating motor carriers have been using the Wireless Communications with GPS vehicle positioning for several years on a fleet basis, little "non-technology" baseline data was available to make direct before and after or with and without comparisons. The Evaluation Team used the companies' operating parameters, with participant opinions to model what the likely impacts on ROI would likely be if deployed currently. The opinions, albeit anecdotal, did benefit from this prior experience. Very conservative estimates of potential new load opportunities were used in the input set, recognizing that often, HAZMAT hauls are dedicated runs with specialized equipment and cannot always take advantage of a revenue producing backhaul as might be possible in dry van operations.
5.4 Partial Budget Assumptions, Inputs, and Results
The inputs used in calculating per truck monthly benefits of Wireless Communications with GPS tracking are presented in Volume III, Section 2. The ROI model essentially equates downtime savings associated with eliminated driver call-in stops and unscheduled en-route maintenance/repairs with increased asset capacity. The ability to know where assets are, the state of conditions vis-à-vis maintaining schedule, and knowing driver availability for hours of service allows dispatchers/load planners to assess the feasibility for picking up potential backhaul loads (applicable to the operation). The model also estimates the value of freed up phone call time for dispatchers talking with drivers, thus allowing them to focus on other duties, or have the time to manage more drivers if necessary. Other benefits include lower communications costs, less idling time (associated with driver call-in stops), resulting reduced in fuel and engine wear costs. These benefits are displayed in Table 5-2.
As described, the inputs are conservative in terms of the percent of additional full loads (no partial loads are assumed) that can be realized (1percent), or the percent of non-productive miles that can be eliminated (1percent). Therefore, the benefit estimates are relatively conservative.
| Benefits | LTL-High Hazard | Bulk Chemicals | Truckload Explosives |
|---|---|---|---|
| Reduced Call Stops/Check Calls | $296 | $253 | $491 |
| Reduces Telecommunications Costs | $28 | $19 | $30 |
| Increases the number of trucks dispatchers handle | $165 | $122 | $81 |
| Increases potential number of loads | $27 | $37 | $290 |
| Reduces idle time fuel consumption | $65 | $65 | $78 |
| Reduces idle time engine wear | $11 | $11 | $13 |
| Improved Maintenance Scheduling | $36 | $18 | $37 |
| Reduces maintenance and repair costs | $33 | $17 | $33 |
| Increases revenue miles by reducing repair down-time | $2 | $1 | $4 |
| Reduced Out-of-Route Miles | $180 | $123 | $116 |
| Creates savings of line haul variable costs | $180 | $123 | $116 |
| Improved Vehicle Utilization by Reducing Empty Miles | $309 | $199 | $270 |
| Increases potential number of trips | $309 | $199 | $270 |
| Total Monthly Benefit per Truck | $820 | $593 | $914 |
A sensitivity analysis of benefits was conducted on the variables given the assumptions that a percentage of out-of-route miles can be eliminated through improved trip monitoring, or the percentage of added trips that could be hauled with better pre-planning and fleet utilization (both of which strongly impact monthly benefits per truck) would be increased.
LTL-High Hazard operations (as represented by the motor carrier in scenario 2B) with a 1 percent reduction in out-of-route miles or a 1 percent increase in monthly trips would increase monthly benefits by $180 and $309 per truck per month, respectively. For Bulk Chemicals, the benefit increases are estimated to be $116 and $270, respectively. For Truckload Explosives, the benefit increases by $124 and $199, respectively.
The potential benefit increases for a 1 percent reduction in out-of-route miles are calculated to be 21, 20, and 14 percent for LTL-High Hazard, Bulk Chemicals and Truckload Explosives, respectively. A 1 percent increase in loads hauled is calculated to increase benefits by 38, 46, and 22 percent for LTL-High Hazard, Bulk Chemicals, and Truckload Explosives, respectively.
The results of the sensitivity analysis show that even marginal improvements in managing out-of-route miles or improving asset utilization as reflected in increased loads hauled can have a strong effect on carriers' profitability and ROI.
It is recognized that all operations are not able to realize many of the estimated benefits as modeled for the FOT participants. The proportion and degree to which carriers realize benefits of technologies has been examined in numerous case studies and industry benefit/cost analyses. To explore low-end benefits of the Wireless Communication s with GPS vehicle positioning system, this effort draws upon the results of a 1999 ATA Foundation study that examined the benefits and costs of technology systems across a wide-range of carrier operations for over 900 surveyed motor carriers.[9] Among the findings, carriers using Wireless Communications and vehicle tracking technologies, 33 to 47 percent increased loads; 22 to 35 percent reduced non-revenue miles; and 12 percent lowered driver to dispatcher ratios.
By focusing only on these three areas of operational efficiency improvements (using the midpoint values) and ignoring the other modeled benefits, the results of a "minimum" benefit analysis is presented in Table 5-3.
| Benefits | LTL-High Hazard | Bulk Chemicals | Truckload Explosives |
|---|---|---|---|
| Reduced Call Stops/Check Calls | $20 | $15 | $10 |
| Increases the number of trucks dispatchers handle | $165 x (12% of fleets) = $20 | $122 x (12% of fleets) = $15 | $81 x (12% percent of fleets) = $10 |
| Reduced Out-of-Route Miles | $52 | $36 | $34 |
| Creates savings of line haul variable costs | $180 x (29% of fleets) = $52 | $123 x (29% of fleets) = $36 | $116 x (29% of fleets) = $116 |
| Improved Vehicle Utilization by Reducing Empty Miles | $124 | $80 | $108 |
| Increases potential number of trips | $309 x (40% of fleets) = $124 | $199 x (40% of fleets) = $80 | $270 x (40% of fleets) = $108 |
| Total Monthly Benefit per Truck | $196 | $130 | $152 |
5.5 Efficiency Benefits Findings
A key finding was that the participating motor carriers ascribed little operational efficiency impact to the test technologies, with the exception of Wireless Communications with GPS tracking capabilities. Their views regarding operational efficiency were primarily focused on the ability to communicate efficiently with drivers, know where the vehicles are, and when to manage customer requests for status and arrival times; track driver and vehicle operational performance on the road; and to effect better load planning.
The use of Wireless Communications with GPS tracking capabilities shows significant benefits in terms of improved management of fleet personnel and assets to reduce unproductive miles; increase driver and dispatcher productivity; and realize increased loads.
There may be minimum fleet sizes in these sectors under which the usefulness of integrated communications and tracking systems may be easily reproduced with less advanced methods and technologies, such as cell phones and pagers. Volume III, Section 4: Benefit-Cost Assessment and Industry Deployment Potential examines this in the larger industry context.
Though not quantified through this effort, several of the participants thought GPS tracking was a valuable tool in the recovery of stolen assets – especially tractors and trailers. With the value of a tractor-trailer combination unit worth in excess of $100,000 and the cargo considerably more, being able to track and locate a missing asset is considered a potential ROI improvement, albeit, not quantifiable to the extent of rigor.
Geofencing was thought of as a useful application of the vehicle tracking system to enable alerts if a driver went out of route, thereby potentially reducing the costs of out-of-route miles. The efficiency benefits of Geofencing were considered in the Partial Budget analyses presented in the preceding sections as supporting the reduction in out-of-route miles. The exposure of the technologies to tethered and untethered trailer tracking was limited during the test and resulted in no significant quantifiable benefits. Participants using the technologies did acknowledge that benefits could include reduced equipment abuse by third parties. They further acknowledged that this could result in reduced trailer maintenance and possible realization of detainage charges, reduced numbers of trailers needed to meet service needs, and potentially reduced staff/administrative costs associated with equipment matching and dispatching activities.
There may be minimum fleet sizes in these sectors under which the usefulness of integrated communications and tracking systems may be easily reproduced with less advanced methods and technologies, such as cell phones and pagers. Volume III, Section 4 examines this in the larger industry context.
As mentioned previously, the ESCM concept was viewed as a potential efficiency tool through the reduction of paperwork. System use was constrained by the number of participants, and therefore, though the concept was accepted, reaction to the system itself was neutral.
The overall impact of the technologies on the motor carriers was that the technologies required the basic communications and tracking system, and that the carriers would realize additional costs in the concept of enhanced security. In this context, panic alerts and remote door locking capabilities were considered very useful with a willingness of carriers to possibly invest in them. For the most part, the participants indicated that the other "security" technologies would be considered, if the carriers' customers required their use and were willing to recoup the carriers' costs through increased freight rates.
7. SAIC, Hazardous Material Transportation Safety and Security Field Operational Test Final Detailed Test Plans, prepared for FMCSA, September 2003.
8. This figure was derived from the USDOT Bureau of Transportation Statistics, Motor Carrier Finance and Operating Statistics, 2002, accessed from http://transtats.bts/gov.
9. Motor Carrier Technologies – Fleet Operational Impacts and Implications for Intelligent Transportation Systems/Commercial Vehicle Operations , ATA Foundation, October 1999, conducted for Federal Highway Administration.