
Technical Report
For
Kentucky Commercial Vehicle Safety Applications Evaluation
U.S. Department of Transportation
Washington, DC 20590
Contract No. DTFH61-02-C-00134
Task Order BA34018
FHWA-JPO-08-025
January 31, 2008


Federal Motor Carrier Safety Administration
![]() PDF Version 2.9 MB
PDF Version 2.9 MB
Get Adobe PDF Reader Here
Contents
- Acknowledgments
- Executive Summary
- Abbreviations
- 1.0 Introduction and Program Background
- 2.0 Goals of the ISSES Deployment Project
- 3.0 Technologies Being Deployed
- 4.0 Summary of Evaluation Goals, Objectives, and Hypotheses
- 5.0 System Performance Evaluation
- 6.0 Inspection Efficiency Evaluation
- 7.0 User Acceptance and System Cost Evaluation
- 8.0 Conclusions and Implications
- 9.0 References
- Appendix A. Points of Contact
- Appendix B. Interview Guide
- Appendix C. Interview Responses
- Appendix D. Prior Research on Infrared Brake Screening Technology for CMVs
- Appendix E. Maintenance Summary (April – August 2007)
- Technical Report Documentation Page
Tables
- Table 5-1. Comparison of Laurel and Kenton station configurations
- Table 5-2. Radiation portal monitor files generated during field studies
- Table 6-1. Kentucky Clearinghouse database fields as of September, 2007
- Table 6-2. Carrier and NORPASS pull-in rates for Kentucky OOS rate inspection selection algorithm
- Table 6-3. Times when USDOT numbers were captured from truck traffic passing through ISSES equipment
- Table 6-4. Truck traffic volume observed during field study
- Table 6-5. Distribution of carrier base state for observed field study trucks
- Table 6-6. Distribution of reasons e-screening participating trucks were required to pull-in to inspection station during field study
- Table 6-7. ISS values and recommendations
- Table 6-8. Comparison of ISS risk distribution for e-screening and non-e-screening Kentucky field study trucks
- Table 6-9. Comparison of ISS risk distribution for trucks bypassing station and trucks pulling into station using Kentucky screening criteria
- Table 6-10. Inspection selection efficiency at Laurel County station
- Table 6-11. Statewide OOS violation rates by risk category for inspections performed January 1, 2005, through September 13, 2007
- Table 6-12. Comparison of expected number of OOS orders per 100 inspections for Laurel County inspection station using ISS scores to define risk categories—random selection versus current inspection practices
- Table 6-13. Comparisons of expected number of OOS orders per 100 inspections for Laurel County inspection station using ISS scores to define risk categories—random selection versus electronic screening where medium- and low-risk carriers are allowed to bypass station
- Table 6-14. Risk distribution of field study truck traffic and trucks kicked out from inspection selection OOS rate algorithm
- Table 6-15. Kentucky inspection selection efficiency using OOS rates to define risk
- Table 6-16. Statewide OOS violation rates by OOS rate risk category for inspections performed January 1, 2005, through September 13, 2007
- Table 6-17. Comparisons of expected number of OOS orders per 100 inspections for Laurel County inspection station using OOS rates to define risk categories
- Table 6-18. 2005 crash statistics for Kentucky and nation
- Table 6-19. Relevant national safety and safety enforcement statistics on large trucks
- Table 6-20. High-level overview of roadside enforcement scenarios
- Table 6-21. Probabilities of certain OOS violations occurring among vehicles involved in a crash and among the general population of trucks
- Table 6-22. Vehicle and driver OOS rate threshold values calculated from Kentucky inspections from January 2005 through mid-September 2007
- Table 6-23. Vehicle and driver OOS rate threshold values along with corresponding probabilities of an OOS violation calculated from Kentucky inspections from January 2005 through mid-September 2007
- Table 6-24. Number of crashes, injuries, and fatalities avoided under scenario RE-4
- Table 6-25. Brake violation and driver OOS rate threshold values calculated from Kentucky inspections from January 2005 through mid-September 2007
- Table 6-26. Brake violation and driver OOS rate threshold values along with corresponding probabilities of a brake-related or driver OOS violation calculated from Kentucky inspections from January 2005 through mid-September 2007
- Table 6-27. Number of crashes, injuries, and fatalities avoided under scenario RE-5
- Table 6-28. Number of crashes, injuries, and fatalities avoided under scenario RE-6
- Table 6-29. Estimated safety benefits of the ISSES and CVISN under selected deployment scenarios and assumptions
- Table 6-30. Credentialing information in the Kentucky Clearinghouse
- Table 6-31. Comparison of IFTA credentialing status with ISS risk category
- Table 6-32. Comparison of Weight/Distance Tax credentialing status with ISS risk category
- Table 7-1. User acceptance interview question topics
Figures
- Figure 1-1. London, Kentucky, northbound I-75 weigh station (Laurel County)
- Figure 1-2. London, Kentucky, ISSES deployment
- Figure 3-1. Layout of weigh-inspection station and traffic patterns at London, Kentucky (Laurel County) on northbound I-75
- Figure 5-1. Example image recorded by overhead camera at the Laurel site
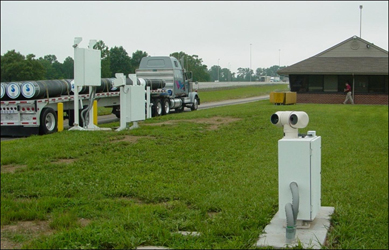
- Figure 5-2. Laser scanner for triggering and classification (far right) and raised radiation portal monitors (left and center-right)
- Figure 5-3. Graphic representations of radiation monitor output for CMVs passing through the Kenton and Laurel sites
- Figure 5-4. Location of thermal imaging video cameras at Laurel site, showing pan-tilt-zoom camera head
- Figure 5-5. Images captured by thermal imaging video cameras at Kenton site, as replayed on DVR viewer
- Figure 5-6. Two cameras used for ALPR subsystem
- Figure 5-7. Rear view of USDOT number reader camera
- Figure 5-8. Images generated by the ALPR system
- Figure 5-9. Image generated by USDOT number reader
- Figure 5-10.ISSES continuous monitoring interface, showing the "live view"
- Figure 5-11.ISSES management interface, showing the server detail options at left
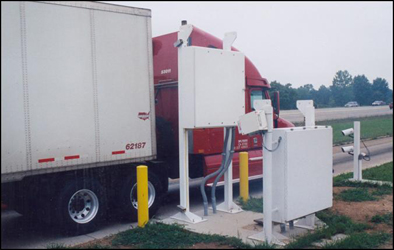
- Figure 5-12.Lower configuration of radiation detection panels at Kenton ISSES site
- Figure 5-13.ISSES configuration at Simpson site
- Figure 5-14.Series of images recorded by ISSES overhead camera at Laurel site on June 14, 2007
- Figure 5-15.Image taken while contrast on the Kenton IR camera was improperly adjusted
- Figure 5-16.Image taken from Kenton IR viewer after contrast adjustment
- Figure 6-1. Total number of trucks and trucks per hour observed by data collector during each day of field study
- Figure 6-2. Daily number of total truck bypasses and bypasses per hour for second week of field study
- Figure 6-3. Daily number of inspections during field study
- Figure 6-4. Percentage of e-screening participating field study truck traffic that bypassed and pulled in to inspection station
- Figure 6-5. ISS risk distribution for Kentucky field study truck traffic as well as national risk distribution from SAFER
- Figure 6-6. Probit relationship between safety index and the probability of an OOS violation
- Figure 6-7. Vehicle and driver OOS rates for the nation and various states participating in Kentucky CVSA and national CVISN deployment evaluations