
2.0 Modeling Approach
The AMS Methodology document presented three findings based on the analysis of capabilities found in existing AMS tools:
- Each tool type has different advantages and limitations, and is better than other tool types at some analysis capabilities. There is no one tool type at this point in time that can successfully address the analysis capabilities required by the ICM program. An integrated approach can support corridor management planning, design, and operations by combining the capabilities of existing tools.
- Key modeling gaps in existing tool’s capabilities include: a) the analysis of traveler responses to traveler information; b) the analysis of strategies related to tolling/HOT lanes/congestion pricing; and c) the analysis of mode shift and transit.
- Interfacing between travel demand models, mesoscopic simulation models, and microscopic simulation models presents integration challenges that can be addressed by identifying interface requirements that focus on: a) maintaining the consistency across analytical approaches in the different tools; and b) maintaining the consistency of performance measures used in the different tool types.
2.1 Test Corridor Site
The Test Corridor comprises the I‑880 corridor between the cities of Oakland and Fremont, California, with the I‑580/I‑80 interchange as the northern boundary and SR 237 as the southern boundary, for a distance of about 38 miles or more than 250 lane-miles. The ICM AMS team evaluated a number of candidate Test Corridor sites and selected I‑880 based on a number of criteria, including availability of macro-, meso-, and microscopic simulation models, validation and calibration data, ease of modifications to these models, multitude of transportation modes (single-occupancy vehicle (SOV), high-occupancy vehicle (HOV), transit, etc.), multitude of transportation facilities (freeways, arterials, HOV lanes, transit, etc.), and transferability/applicability of results and methods tested on the Test Corridor.
As one of the main arteries of the freeway system in the San Francisco Bay Area, I‑880 includes 38 miles of freeway connecting Silicon Valley with the East Bay. I‑880 serves the Port of Oakland, Oakland International Airport, and the Oakland Coliseum, as well as a major concentration of residential, office, industrial and warehouse land uses. I‑880 serves as both an access route for major interregional and international shippers and a primary intraregional goods-movement corridor. Facilities in the Test Corridor include the I‑880 freeway, arterial highways, the Alameda County (AC) bus transit routes, the Bay Area Rapid Transit (BART) rail, and intercity passenger and freight rail lines. An illustration of the Test Corridor is shown in Figure 2.1. The Test Corridor is described in more detail in the “Test Corridor Model Description” document, one of the ICM AMS deliverables.
2.2 Modeling Approach
The approach adopted for the test corridor analysis applies the AMS Methodology findings and the AMS framework shown in Figure 2.2. The Test Corridor AMS approach encompasses tools with different traffic analysis resolutions. All three classes of simulation modeling approaches – macroscopic, mesoscopic, and microscopic – may be applied for evaluating ICM strategies. This modeling approach provides the greatest degree of flexibility and robustness in supporting subsequent tasks for AMS support of Pioneer Sites. In this section, the Test Corridor site selected in Task 2.1 is presented and then the AMS Framework for the Test Corridor is described.
Figure 2.2 Test Corridor AMS Framework
The AMS methodology for Test Corridor applies macroscopic trip table manipulation for the determination of overall trip patterns, mesoscopic analysis of the impact of driver behavior in reaction to ICM strategies (both within and between modes), and microscopic analysis of the impact of traffic control strategies at roadway junctions (such as arterial intersections or freeway interchanges). The methodology also includes a simple pivot-point mode shift model and a transit travel-time estimation module, the development of interfaces between different tools, and the development of a performance measurement and benefit/cost module.
In this AMS framework, macroscopic, mesoscopic, and microscopic traffic analysis tools can interface with each other, passing trip tables and travel times back and forth looking for natural stability within the system. Absolute convergence may not be achieved because of inherent differences at the various modeling levels. This methodology will seek a natural state for practical convergence between different models, and the iterative process will be terminated or truncated at a point where reasonable convergence is achieved.
This section describes the various off-the-shelf and custom tools applied for the Test Corridor to conduct the modeling of the ICM strategies.
Travel Demand Forecasting Model
Predicting travel demand requires specific analytical capabilities, such as the consideration of destination choice, mode choice, time-of-day travel choice, and route choice, as well as the representation of traffic flow in the highway network. These attributes are found in the structure and orientation of travel demand models; these are mathematical models that forecast future travel demand from current conditions, and future projections of household and employment characteristics.
A validated CUBE travel demand model (TDM) of the Alameda County Congestion Management Agency, depicted in Figure 2.3, will be used to develop the trip tables and networks for the Test Corridor. Subarea trip tables and networks will be developed from the TDM –for use in the simulation model. The travel demand model also will be used as the analysis engine for a simple pivot-point mode-choice model which will analyze mode shifts in response to congestion and to ICM strategies. The output from the mode choice analysis and trip table manipulation will be corridor-based trip tables that take into account trip impacts associated with corridor conditions, current operations, or operational changes. A detailed description of the mode choice model is provided later in this section.
Figure 2.3 Alameda County Travel Demand Model
Mesoscopic Simulation Model
Mesoscopic models combine properties of both microscopic and macroscopic simulation models. The mesoscopic models’ unit of traffic flow is the individual vehicle, and they assign vehicle types and driver behavior, as well as their relationships with the roadway characteristics. Their movement, however, follows the approach of macroscopic models and is governed by the average speed on the travel link. Mesoscopic models provide less fidelity than microsimulation tools, but are superior to travel demand models, in that, mesoscopic models can evaluate dynamic traveler diversions in large-scale networks.
A DynaSmart-P mesoscopic model of the subarea extending beyond the mainline I‑880 corridor will be used for the analysis of ICM strategies of the Test Corridor. The DynaSmart‑P network will use a trip table from the travel demand model. The model will be used to support the analysis of the dynamic impact of ICM strategies that may induce shifts of trips from one network to another, such as pricing, and corridor-specific traveler information (pre-trip and e‑route). An illustration of the mesoscopic simulation network is shown in Figure 2.4.
Figure 2.4 Mesoscopic Simulation Network for the Test Corridor
Microscopic Simulation Model
Microscopic simulation models simulate the movement of individual vehicles, based on theories of car-following and lane-changing. Typically, vehicles enter a transportation network using a statistical distribution of arrivals (a stochastic process); and are tracked through the network over small time intervals (e.g., one second or fraction of a second). Typically, upon entry, each vehicle is assigned a destination, a vehicle type, and a driver type. In many microscopic simulation models, the traffic operational characteristics of each vehicle are influenced by vertical grade, horizontal curvature, and superelevation, based on relationships developed in prior research. The primary means of calibrating and validating microscopic simulation models is through the adjustment of driver sensitivity factors.
A Paramics microsimulation model for the Test Corridor is being developed for I‑880 as part of the California Department of Transportation (Caltrans) Model Corridor study. Depending on the schedule of this parallel effort the Paramics model may be available to support the evaluation of the operational control aspects of the ICM strategies, such as ramp metering and traffic signal coordination strategies. Microscopic simulation analysis can output detailed travel times that can be used to augment the mesoscopic simulation analysis. This augmentation would entail the conversion of operational impacts identified at the microscopic level into adjustment factors at the mesoscopic level. These factors can support the modification of the mesoscopic analysis, such that the impacts of the operational control aspects of ICM strategies can be analyzed in conjunction with the trip management and route shifting aspects of those strategies. An illustration of the Paramics model network for the Test Corridor is shown in Figure 2.5.
Figure 2.5 Microscopic Simulation Network for the Test Corridor
Model Interface
Linkage mechanisms are required to establish consistency between the modeling resolutions of the AMS tools. In general, three types of interfaces are required to allow communications between macroscopic travel demand models, mesoscopic simulation models, and microscopic simulation models:
- An interface focusing on network features;
- An interface focusing on the temporal distribution of trips; and
- An interface focusing on the refinement/aggregation of model traffic analysis zones that generate and attract travel demand.
For example, the interface between a travel demand model and a microscopic simulation model requires that uniform peak-period travel demand from the travel demand model is transformed into a dynamic travel demand that changes every 5 to 15 minutes. This interface further requires that there is compatibility between the zonal structures and networks in the two model types. This interface will be flexible and extensible to be applied as the linkage mechanism between different travel demand, meso, and micro models.
Analysis of Mode Shift and Transit
A known gap in the analysis of ICM relates to the performance and impacts of transit services. Mode shift in the Test Corridor can be due to scenario impacts (incidents, etc.) and ICM strategies (such as Traveler Information Systems, ramp metering, etc.). Modeling of mode shift requires input of transit travel times which need to be calculated and provided by network segment and at key decision points in the corridor. This can support comparison of network and modal alternatives and facilitate the analysis of traveler shifts among different transportation modes.
The pivot-point mode shift model works with trip tables from the travel demand model, and with more accurate travel times estimated by simulation models. A depiction of the application is shown in Figure 2.6; the work flow in the mode choice model is shown in Figure 2.7.
Figure 2.6 Pivot Point Mode Choice Model Application
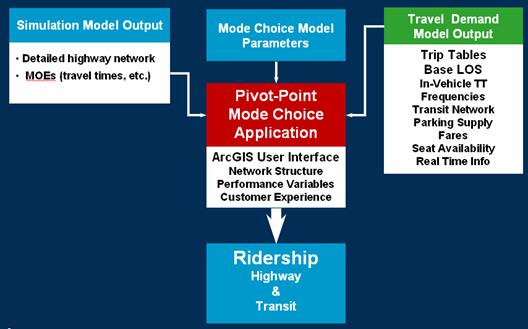
Figure 2.7 Pivot Point Mode Shift Model – Work Flow
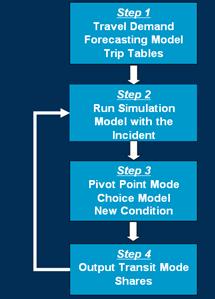
This approach provides: 1) calculation of transit travel times for each requested level of analysis given the corridor conditions or operations input; 2) incorporation of inputs from each level of analysis to adjust transit travel times per segment and decision point; and 3) generation of outputs that can be incorporated into the other modeling tools as analysis adjustment factors. This approach supports the corridor analysis of transit in an ICM environment and provides the information necessary to account for the interrelation of impacts with the traffic operations in the corridor.