
4.0 Model Calibration
Accurate calibration is a necessary first step for proper simulation modeling. Before modeling ICM strategies, model calibration ensures that base scenarios represent reality, creating confidence in the scenario comparison. It should be noted that even the most detailed microsimulation model still contains only a portion of all of the variables that affect real-world traffic conditions, which can affect the accuracy of the calibration. Details of the methodology that will be used for data calibration are provided below.
4.1 Simulation Model Calibration
Each simulation software program has a set of user-adjustable parameters that enable the practitioner to calibrate the software to better match specific local conditions. These parameter adjustments are necessary because no simulation model can include all of the possible factors (both on- and off-street) that might affect capacity and traffic operations. The calibration process accounts for the impact of these “unmodeled” site-specific factors through the adjustment of the calibration parameters included in the software for this specific purpose. Therefore, model calibration involves the selection of a few parameters for calibration and the repeated operation of the model to identify the best values for those parameters. Calibration improves the ability of the model to accurately reproduce local traffic conditions. The key issues in calibration are:
- Identification of necessary model calibration targets;
- Selection of the appropriate calibration parameter values to best match locally measured street, highway, freeway, and intersection capacities;
- Selection of the calibration parameter values that best reproduce current route choice patterns; and
- Calibration of the overall model against overall system performance measures, such as travel time, delay, and queues.
4.2 Calibration Approach
Available data on bottleneck locations, traffic flows, and travel times will be used for calibrating the simulation models for the analysis of the Test Corridor. The Test Corridor calibration strategy will be based on the three-step strategy recommended in the FHWA Guidelines for Applying Traffic Microsimulation Modeling Software (Dowling, R., A. Skabardonis, and V. Alexiadis, Traffic Analysis Toolbox Volume III: Guidelines for Applying Traffic Microsimulation Modeling Software, FHWA-HRT-04-040, Federal Highway Administration, July 2004):
- Capacity calibration – An initial calibration will be performed to identify the values for the capacity adjustment parameters that cause the model to best reproduce observed traffic capacities in the field. A global calibration is performed first, followed by link-specific fine-tuning.
- Route choice calibration – The Test Corridor has parallel arterial streets, making route choice calibration important. A second calibration process will be performed with the route choice parameters. A global calibration is performed first, followed by link-specific fine-tuning.
- System performance calibration – Finally, the overall model estimates of system performance (travel times and queues) are compared to the field measurements for travel times and queues. Fine-tuning adjustments are made to enable the model to better match the field measurements.
Calibration Criteria
Calibration criteria presented in Table 4.1 will be applied for the test corridor simulation, subject to the budget and schedule constraints for the Test Corridor AMS.
Table 4.1 Calibration Criteria for the Test Corridor AMS
Calibration Criteria and Measures |
Calibration Acceptance Targets |
|---|---|
Traffic flows within 15% of observed volumes for links with peak-period volumes greater than 2,000 |
For 85% of cases for links with peak-period volumes greater than 2,000 |
Sum of all link flows |
Within 5% of sum of all link counts |
Travel times within 15% |
Greater than 85% of cases |
Visual Audits |
To analyst’s satisfaction |
Visual Audits |
To analyst’s satisfaction |
4.3 Preliminary Model Calibration Results
Preliminary results for the calibration of the Test Corridor DynaSmart‑P model are presented in this section.
Figure 4.1 shows observed versus simulated traffic volumes across 7 consecutive iterations in the calibration process. Progressively the calibration results have become better from Iteration 1 to Iteration 7. For most links with high-traffic volumes (greater than peak-period traffic flows of 2,000), simulated volumes fall within the 15 percent error range (dotted lines in Figure 4.1).
Figure 4.1 DynaSmart-P Calibration – Observed versus Simulated Volumes
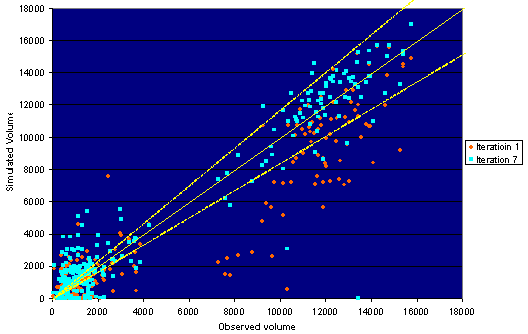
Figure 4.2 shows percent error between observed and simulated traffic volumes for the calibrated DynaSmart-P baseline simulation. Again, for most links with high-traffic volumes (greater than peak-period traffic flows of 2,000), simulated volumes fall within the 15 percent error range (dotted lines in Figure 4.1).
Figure 4.2 DynaSmart-P Calibration – Error in Link Volumes
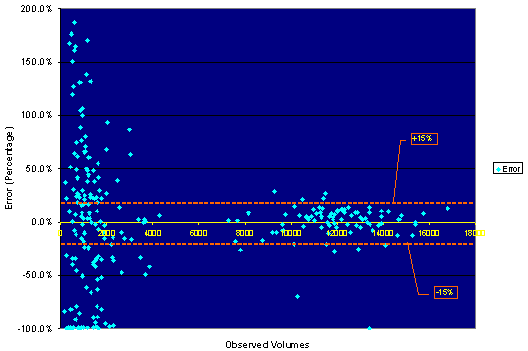
Table 4.2 shows observed, simulated, and free-flow average travel times at 6 segments of the Test Corridor in the southbound direction. Overall, the simulated corridor travel time is within the 15 percent error range.
Table 4.2 Travel Time Calibration – Southbound – AM
Segment |
Start |
End |
Observed Time |
Simulated Calibrated |
Free-Flow |
|---|---|---|---|---|---|
1 |
North end |
29th Avenue |
4.90 |
5.12 |
4.30 |
2 |
29th Avenue |
98th Avenue |
4.15 |
4.02 |
3.60 |
3 |
98th Avenue |
I‑238 |
8.10 |
8.79 |
3.70 |
4 |
I‑238 |
SR 92 |
7.40 |
10.29 |
3.90 |
5 |
SR 92 |
SR 84 |
6.97 |
10.22 |
5.73 |
6 |
SR 84 |
Auto mall |
6.92 |
5.51 |
5.01 |
Total |
No value |
No value |
38.44 |
43.95 |
26.24 |
Table 4.3 shows observed, simulated, and free-flow average travel times at 7 segments of the Test Corridor in the northbound direction. Overall, the simulated corridor travel time is within a 20 percent error range.
Table 4.3 Travel Time Calibration – Northbound – AM
Segment |
Start |
End |
Observed Time |
Simulated Calibrated |
Free-Flow |
|---|---|---|---|---|---|
1 |
Sorth end |
Auto mall |
6.35 |
5.72 |
5.94 |
2 |
Auto mall |
SR 84 |
5.12 |
12.18 |
5.04 |
3 |
SR 84 |
SR 92 |
11.27 |
16.37 |
5.91 |
4 |
SR 92 |
I‑238 |
3.90 |
5.86 |
3.30 |
5 |
I‑238 |
98th Avenue |
6.45 |
3.97 |
3.90 |
6 |
98th Avenue |
29th Avenue |
5.37 |
3.58 |
3.63 |
7 |
29th Avenue |
North end |
5.45 |
5.18 |
3.93 |
Total |
No value |
No value |
43.91 |
52.86 |
31.65 |
Some of these calibration results do not meet the calibration criteria presented in Table 4.1 primarily because meeting these criteria was assigned a lower priority given the resource constraints for the Test Corridor AMS. In a real-corridor ICM application continued calibration is needed, including a) calibration for average and non-average conditions, b) meeting calibration targets for aggregate travel times and delay, and c) more explicitly taking into account bottleneck flows including temporal variation throughout the modeled time period.