ITS - Intelligent Transportation Systems Report ITS Home Page

National Evaluation of the SafeTrip-21 Initiative:
California Connected Traveler Test Bed, Draft Evaluation Report:
Networked Traveler - Transit/Smart Parking

U.S. Department of Transportation logo.
ITS Joint Program Office
Research And Innovative Technology Administration

January 14, 2011

FHWA-JPO-11-014

Contract Number: DTFH61-06-D-00005
Task Order T-09-008

Adobe logo. Download the Printable Version [PDF, 7 MB]
You will need the Adobe Acrobat Reader to view this PDF.

Collage of photos and images from the cover of this report, including a Caltrain car, an electronics cabinet,  a long queue of cars heading toward an interstate onramp, a photo of a test vehicle, and a screenshot of a traveler information map.


Quality Assurance Statement

The U.S. Department of Transportation (U.S. DOT) provides high-quality information to serve Government, industry, and the public in a manner that promotes public understanding. Standards and policies are used to ensure and maximize the quality, objectivity, utility, and integrity of its information. RITA periodically reviews quality issues and adjusts its programs and processes to ensure continuous quality improvement.

Table of Contents


[ Technical Report Documentation Page ] [ Acknowledgements ] [ Abbreviations ]

EXECUTIVE SUMMARY
PART I: INTRODUCTION
PART II: FINDINGS
1. BACKGROUND
1.1 NETWORKED TRAVELER – TRANSIT/SMART PARKING TEST
1.1.1 PATH2Go Trip Planner
1.1.2 PATH2Go Web Based Traveler Information
1.1.3 PATH2Go Smart Phone Application
1.2 EVALUATION APPROACH
2 PATH2GO SMART PHONE APPLICATION GEO-FENCING TEST
2.1 GEO-FENCING 101
2.2 GEO-FENCING DESIGN
2.3 GEO-FENCING TEST
2.3.1 Test Approach
2.3.2 Findings
3 USAGE STATISTICS
3.1 APPLICATIONS LAUNCH
3.2 USER BASE
3.2.1 PATH2Go Smart Phone Application
3.2.2 PATH2Go Website Applications
3.3 TARGETED MARKETING EFFORTS
3.3.1 Impact of Direct Marketing on Usage
3.4 USER CHARACTERISTICS
3.4.1 Trends in User Frequency
3.4.2 Trends in Website Visits
3.4.3 Trends in Accessing the Website
3.4.4 Trends in Geographic Location of Users
3.5 SUMMARY
4 USER PERCEPTIONS
4.1 PURPOSE
4.2 SURVEY APPROACH
4.3 SUMMARY OF RESPONDENT CHARACTERISTICS
4.4 USE OF THE APPLICATIONS/WEBSITE
4.5 TRIP PLANNING USING THE PATH2GO APPLICATIONS
4.6 SUGGESTIONS FOR MAKING THE APPLICATION BETTER
4.7 SUMMARY
5 DEPLOYMENT EXPERIENCE ASSESSMENT
5.1 FINDINGS
5.1.1 Background
5.1.2 PATH goals
5.1.3 Implementation challenges and how they were overcome
5.1.4 Methodologies for determining user needs
5.1.5 Institutional challenges
5.1.6 Approaches for managing anonymity and privacy
PART III: SUMMARY AND CONCLUSIONS
6 SUMMARY AND CONCLUSIONS
6.1 SUMMARY
6.2 CONCLUSIONS
6.2.1 Observe the consumer response to the NT-T/SP application
6.2.2 Understand the technical and institutional issues associated with distributing multi-modal information to smart phone users
6.2.3 Test the ability of geo-fencing as a method to prevent distracted driving
6.2.4 Understand the development process and institutional issues associated with implementing a server-based geo-fencing method versus a client-based method on mobile devices
6.2.5 Measure usage of the NT-T/SP application
6.2.6 Analyze the perceived accuracy and usefulness of mode shift alerts and en-route transit information
PART IV: APPENDICES
APPENDIX A: SCREENSHOT OF PATH2GO USER REGISTRATION SURVEY
APPENDIX B: GEO-FENCING TEST ITINERARY
APPENDIX C: ITS BERKELEY PRESS RELEASE
APPENDIX D: SPECIFIC PATH2GO MEDIA COVERAGE
APPENDIX E: PATH FLYER DISTRIBUTED AT TRANSIT STATIONS

List of Figures

Figure 1-1. Screenshot of PATH2Go Trip Planner Website.
Figure 1-2. Caltrain Smart Parking 3G Transmitter in Redwood City, CA.
Figure 1-3. Screenshot of the PATH2Go Web Based Traveler Information Website.
Figure 1-4. PATH2Go Smart Phone Application Login Screen on Apple iPhone.
Figure 1-5. PATH2Go Smart Phone Application.
Figure 1-6. Apple iPhone User Interface for the PATH2Go Smart Phone Application.
Figure 1-7. PATH2Go Smart Phone Application – Distracted Driving Alert.
Figure 2-1. PATH2Go Smart Phone Application – Geo-fencing System Design.
Figure 2-2. Geo-fencing Design Decision Process.
Figure 3-1. PATH2Go applications Launch on MTC 511 Website, July 29, 2010.
Figure 3-2. Cumulative Number of Registered Users, July 29, 2010 – November 15, 2010.
Figure 3-3. Total Number of PATH2Go Smart Phone Application Users per Day, August 23, 2010 – November 2, 2010.
Figure 3-4. Total Number of Website Visits by Week, August 15, 2010 – November 15, 2010.
Figure 3-5. Cumulative Number of Absolute Unique Visitors by Week, August 2010 – November 15, 2010.
Figure 3-6. Website Usage in Visits by Day, August 15, 2010 – September 3, 2010.
Figure 3-7. Networked Traveler Project Website – Usage in Visits by Day, August 15, 2010 – September 3, 2010.
Figure 3-8. Twitter Post on caltrain Twitter page.
Figure 3-9. Website Usage in Visits by Day, August 15, 2010 – November 15, 2010.
Figure 3-10. Visitor Loyalty, August 15, 2010 – November 15, 2010.
Figure 3-11. Visitor Recency, August 15, 2010 – November 15, 2010.
Figure 3-12. Visitor Recency for Returning Visitors Only, August 15, 2010 – November 15, 2010.
Figure 3-13. Website Usage in Visits by Time of Day, August 15, 2010 – November 15, 2010.
Figure 3-14. Website Usage in Visits by Day of Week, August 15, 2010 – November 15, 2010.
Figure 3-15. Length of Visit, August 15, 2010 – November 15, 2010.
Figure 3-16. Types of Traffic Sources by Number of Visits, August 15, 2010 – November 15, 2010.
Figure 3-17. Networked Traveler Project Website – Types of Traffic Sources by Number of Visits, August 15, 2010 – November 15, 2010.
Figure 3-18. National Website Usage by City Density, August 15, 2010 – November 15, 2010.
Figure 3-19. Bay Area Website Traffic by City Density, August 15, 2010 – November 15, 2010.
Figure 4-1. Initial E-mail to Registered Users Requesting Survey Participation, October 11, 2010
Figure 4-2. Pop-up and Text Links to User Survey on PATH2Go Traveler Information website
Figure 4-3. PATH2Go Web-Based User Survey Responses
Figure 4-4. Respondent Gender
Figure 4-5. Respondent Age Group
Figure 4-6. Respondents' Access to a Personal Automobile
Figure 4-7. Respondents' Primary Mode for Commuting
Figure 4-8. Respondents' Other Transportation Modes for Their Commute
Figure 4-9. Primary Transit Services Used in the Bay Area
Figure 4-10. Sources Where Respondents Heard About the Path2Go Applications
Figure 4-11. Use of the Path2Go Trip Planner Website
Figure 4-12. Use of the Path2Go Traveler Information Website
Figure 4-13. Use of the Path2Go Smart Phone Application
Figure 4-14. Mobile Device Used for the Smart Phone Application
Figure 4-15. Respondents' Perceptions of the Smart Phone Application's Protection of Personal Information
Figure 4-16. Respondents' Perceptions of Having Received the Disabled Warning While Using the Smart Phone Application
Figure 4-17. Respondents' Perceptions on the Appropriateness of the Warning Message Received
Figure 4-18. Respondents’ Perceptions on the Level of Annoyance of the Application Being Blocked
Figure 4-19. Frequency of Using PATH2Go Applications for Planning Transit Trips
Figure 4-20. Purpose of Trips When Using the PATH2Go Applications
Figure 4-21. Respondents'’ Perceptions – Applications Provided them with Information They Were Seeking
Figure 4-22. Respondents' Perceptions – Applications' Presentation
Figure 4-23. Respondents' Perceptions – Applications' Organization
Figure 4-24. Respondents’ Perceptions – How Easy to Find Information on Applications
Figure 4-25. Respondents' Perceptions – Application was Trouble Free
Figure 4-26. Respondent Perceptions – Applications Provide Valuable Information
Figure 4-27. Respondents' Perceptions – Application Information for Multiple Transit Services
Figure 4-28. Respondents' Perceptions – Reliability of Real-time Arrival and Departure Information
Figure 4-29. Respondents' Perceptions – Applications Make Them More Confident About Using Transit
Figure 4-30. Respondents' Perceptions – Would Applications Influence Transportation Mode
Figure 4-31. Respondents' Perceptions – Application Influence on Intended Route

List of Tables

Table 1-1. Data Source by Transit Agency.
Table 1-2. Details of Instrumented Caltrain Parking Lots.
Table 1-3. Goals, Objectives, and Hypothesis Statements
Table 2-1. Identifiable Scenarios Based on Geo-fencing Design Provided by PATH
Table 2-2. Test Transit Routes
Table 2-3. Observations Collected During Geo-Fencing Test, November 6, 2010 – November 7, 2010.
Table 2-4. Geo-fencing Test Results by Test Scenario.
Table 3-1. Traffic Sources by Number of Visits, August 15, 2010 – November 15, 2010.
Table 3-2. Networked Traveler Project Website – Traffic Sources by Number of Visits, August 15, 2010 – November 15, 2010.
Table 4-1. Receipt of Disable Message (by Device)
Table 4-2 Level of Annoyance when Device was Blocked (by Device)

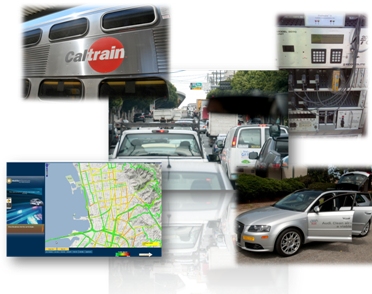
Cover image credits (clockwise from top left, ending in center): PATH, UC Berkeley; Sudhir Murthy, TrafInfo Communications, Inc.; PATH, UC Berkeley; CCIT, UC Berkeley; PATH, UC Berkeley.

Next