3. Impact of Technology
3.1 Impact on Transit Planning and Operations
As reported in Phase II based on information obtained from staff interviews, there have been significant improvements in daily operations and planning activities since the implementation of the ITS technologies at MST. These improvements can be attributed directly to the use of the technologies and tools in both departments.
The following technologies are being used by the planning department at MST:
- HASTUS scheduling system;
- The ACS;
- Video playback system;
- ArcView geographic information system (GIS); and
- Microsoft Office products (e.g., Microsoft Excel and Microsoft Access).
The operations department uses the following technologies in addition to the above technologies:
- HASTUS-DDAM, the timekeeping module of HASTUS; and
- Trapeze Pass and Mentor-Ranger on the MST RIDES paratransit system (operated by MV Transportation, a contractor).
HASTUS assists MST in preparing fixed route schedules and daily driver assignments. The DDAM module of HASTUS allows MST to track driver attendance with respect to assigned schedules. These systems are installed in the Communications Center (see Figure 6).
The ACS system is primarily accessible in the Communications Center but can be accessed remotely over the MST virtual private network (VPN) by authorized staff. The ACS system includes a voice and data communication system (see Figure 7 for a photograph of the radio equipment in the Communications Center), a performance monitoring screen, and a real-time vehicle tracking screen (see Figure 8).

Figure 6. HASTUS Scheduling and DDAM Workstation in the Communications Center

Figure 7. Radio Equipment in the Communications Center

Figure 8. The ACS Workstation in the Communications Center
The ACS assists MST in daily operations by providing various capabilities to manage its fleet and coach operators in real-time. The following features of the ACS have been critical in improving operations at MST:
- Real-time Vehicle Tracking: The coach operators and dispatchers receive schedule adherence warnings when the vehicles are running early or late based on a configurable threshold.
- Text messaging: Both dispatcher and coach operators send data messages to each other as needed..The store and forward feature of the ACS provides the capability of sending messages to an employee (via their ID number) from a dispatch workstation. These messages pop up when the employee receiving a message logs onto a workstation.
- Covert alarms: The coach operators can send emergency alarm messages to the dispatch center. MST reports that covert alarms typically occur once or twice a month. Sirens go off at the Communications Center when covert alarms are received.
- Automated Vehicle Announcements (AVA): The AVA system (with support from the ACS) makes visual and audible announcements at major stops and intersections.
- Route Adherence Monitoring: The dispatchers can monitor vehicles that stray from their routes using the ACS.
- ACS System Control Log: The control log provides a record of daily events and can be searched using a text/keyword search feature.
- Reporting: The ACS provides several standard reports. Along with the standard reports, the ACS system provides several monthly summary reports which are used to provide summary information to the MST Board.
- Archived Data: The ACS provides data for review by the planning staff as needed. The planning department exports and analyzes archived data using external tools (e.g., Microsoft Excel). Archived data is also used for planning studies. For example, the comprehensive operational analysis study done for the Salinas area in 2006 used data from the ACS.
The ACS provides a playback feature to review vehicle operation at desired time durations in the past; however, this feature is not used much by the planning department. Rather, the planning staff relies on data exports from the ACS for manual review and analysis of operational data with the help of Microsoft Excel and Access tools.
The AVL playback feature, however, has been very helpful to the operations department. The ability to review vehicle activities within a given time period allows operations staff to investigate customer complaints about early or late arrivals and departures of MST vehicles. Before the implementation of this feature, MST could not validate customer complaints regarding vehicles failing to arrive or leave the stop on time (e.g., when customers referred to their own watches). Further, this feature assists in investigating situations in which MST may have a valid complaint against a coach operator. MST has trained all its coach operators to use the time displayed on the MDT to avoid any conflicts with other time sources.
3.1.1 Operational Data Collection and Analysis
3.1.1.1 AVL Data
3.1.1.1.1 Recap of Phase II Data Analysis
In the earlier analysis conducted as part of Phase II, the Team had analyzed data for a subset of the MST route system. The dataset consisted of routes that operate in Monterey and Salinas. Also, those routes carried nearly 80 percent of MST riders and had not experienced any significant shift in ridership since the installation of ACS.
ACS data was analyzed for Routes 4, 5, 9, 10, 20, 24, and 41 for the time period of mid-April to end of May for the years 2003 through 2007. The Evaluation Team did not use MST's on-time performance definitions for our analysis since MST had used two different on-time performance standards during the evaluation timeframe. These two standards were as follows:
- From 2003 to 2006, on-time performance was three minutes or more being defined as "late"; and
- From 2006 to the present, on-time performance was five minutes or more being defined as "late."
In Phase II of the evaluation, the Evaluation Team calculated on-time performance statistics using the above standards, but the results were not conclusive. Even though the Team noticed improvements in on-time performance since the technology implementation, the reasons for the improvements were not obvious (i.e., whether it was due to ACS implementation or the change in on-time performance standards). Hence, the Team decided to use an indicator of on-time performance called "lateness," which was calculated as the deviation of the actual arrival times from the scheduled arrival times. Lateness was analyzed across the years by the following:
- Route and direction;
- Time of day; and
- Day of week.
Generally, the analysis did not show any clear trend in average lateness over time for the selected routes, thus leading to inconclusive results. This situation was based on the following:
- Data-related issues that included a low sample size (approximately 12 percent) as data from a period of mid-April to the end of May was used for analysis;
- Inconsistencies in lateness trends were noted in 2003 and 2004 due to large percentages of missing data on the routes selected for analysis;
- The presence of a large number of outliers in the dataset resulted in biased results. In Phase II, the Team had not rejected lateness values less than 30 minutes since that would have reduced the size of sample dataset even more;
- Several operational changes made throughout the evaluation timeframe, including schedule changes, changes in fares in 2006 and 2007, and timepoint adjustments in 2005; and
- External factors, including traffic conditions.
Phase III of the evaluation analyzes on-time performance taking the above issues into consideration. In this phase, the Team has addressed the issues mentioned earlier by utilizing a larger dataset for analysis, minimizing missing data, and removing exceptions from the dataset. Also in this phase, the Evaluation Team analyzed data by schedule periods (i.e., a time period corresponding to a specific operational schedule; e.g., fall 2006) since summary statistics aggregated by year did not provide conclusive results in Phase II.
3.1.1.1.2 Phase III Data Analysis Approach
Having learned from the experience of Phase II, the Evaluation Team collected and analyzed a larger amount of schedule adherence data from the ACS database for a more restricted timeframe (i.e., 2005 onwards). Data was collected from March 29, 2005, through June 16, 2009. This dataset included daily schedule adherence data for all routes within the MST system except for express routes.
As discussed earlier, the Evaluation Team used schedule periods to differentiate the impacts of service changes on on-time performance from the impacts caused by deploying the ACS. For example, MST made major modifications to its service that resulted in schedule changes in October 2006 and January 2007. These changes were found to be one of the reasons behind the inconsistent trends in lateness noticed in Phase II. Hence in this phase, the summary statistics were calculated by schedule periods to determine whether or not there were any on-time performance trends.
However, a preliminary analysis of missing schedule adherence data revealed major data deficiencies in the data that we collected. A preliminary analysis was conducted to identify missing data for each route across various schedule periods (see Table 7 in Appendix B). More than 20 percent of the adherence data was missing on most routes. In fact, in several cases, more than 60 percent of the data was missing (see highlighted cells in red in Table 7).
The routes that the Evaluation Team analyzed in Phase II were not necessarily appropriate for our Phase III analysis because of the high percentage of missing data on those routes. For example, Table 8 in Appendix B shows a significant amount of missing data on Routes 4 and 5 during 2007. Route 20 has a considerable proportion of missing data before mid-2007. Also, Route 24, a contracted route, is missing a lot of data across all schedule periods.
Only a few routes offered a consistent sample size across the analysis timeframe. Thus, we selected Routes 1, 9, 10, 41 and 42 since these routes had the least amount of missing data. Also, these routes are designated as primary routes in the MST system and together account for a large share (40-50%) of the total ridership.
We observed that buses arrived earlier than the scheduled time on a number of instances on all routes. It could be due to excess running time that has been built into the schedule between timepoints. In Phase II, all early arrivals were treated as on-time to be consistent with MST's operational practice. MST treats early arrivals as on-time since early buses are supposed to wait until the scheduled departure time before leaving the stop. In Phase III of the evaluation, the Team conducted a separate analysis for early and late arrivals at timepoints (referred to as "earliness" and "lateness") since treating earliness and lateness separately reduces any potential bias when summarizing the data at the trip level. Also, this approach avoids the potential of these values cancelling each other out, which may happen when both early and late timepoints on a trip are included when summarizing data at the trip level.
Before estimating schedule adherence, the data was evaluated to exclude outlier adherence values, which exhibit large deviations from the mean values (e.g., lateness values higher than 15 minutes). The timepoints for all routes were sorted into datasets representing a range of earliness and lateness values (e.g., 0 to 5 minutes late and 5-10 minutes late). This analysis was useful in determining the general trend of earliness and lateness noticed in the data, and assisted in identifying and eliminating outlier values. Table 3 and Table 4 present this analysis for the routes used in the analysis.
| Route | Total number of timepoints | Percentage of missing timepoints | Percentage of Early Timepoints | ||||||
|---|---|---|---|---|---|---|---|---|---|
| 5 min or less | 5-10 Min | 10-15 Min | 15-20 Min | 20-25 Min | 25-30 Min | 30+ Min | |||
| 1 | 313,097 | 11.18% | 28.87% | 1.59% | 0.03% | 0.01% | 0.02% | 0.03% | 1.80% |
| 9 | 390,800 | 4.45% | 19.99% | 3.28% | 0.09% | 0.02% | 0.01% | 0.00% | 0.04% |
| 10 | 491,122 | 3.61% | 20.79% | 1.07% | 0.06% | 0.01% | 0.00% | 0.00% | 0.02% |
| 41 | 429,128 | 10.28% | 27.80% | 2.83% | 0.12% | 0.02% | 0.03% | 0.03% | 0.02% |
| 42 | 329,807 | 8.87% | 28.91% | 3.86% | 0.27% | 0.05% | 0.01% | 0.00% | 0.05% |
| Route | Total number of timepoints | Percentage of missing timepoints | Percentage of Early Timepoints | ||||||
|---|---|---|---|---|---|---|---|---|---|
| 5 min or less | 5-10 Min | 10-15 Min | 15-20 Min | 20-25 Min | 25-30 Min | 30+ Min | |||
| 1 | 313,097 | 11.18% | 46.48% | 6.54% | 1.43% | 0.53% | 0.24% | 0.09% | 0.90% |
| 9 | 390,800 | 4.45% | 61.95% | 8.61% | 0.94% | 0.19% | 0.08% | 0.02% | 0.13% |
| 10 | 491,122 | 3.61% | 63.33% | 9.25% | 1.21% | 0.21% | 0.08% | 0.02% | 0.09% |
| 41 | 429,128 | 10.28% | 44.10% | 10.71% | 3.14% | 0.36% | 0.23% | 0.07% | 0.08% |
| 42 | 329,807 | 8.87% | 43.22% | 11.64% | 2.53% | 0.28% | 0.04% | 0.01% | 0.05% |
It is evident from Table 3 and Table 4 that most timepoints are either early or late within the range of zero to ten minutes. Very few trips are early or late beyond 10 minutes, and should be treated as exceptions. Hence, only timepoints with earliness or lateness within 10 minutes were considered for the analysis in order to obtain an unbiased summary of schedule deviations
3.1.1.2 Other Data
In Phase II, other information resources were collected in addition to AVL data to test the hypotheses related to COA studies, ridership, and productivity measures.
3.1.2 Findings
3.1.2.1 Impact on Comprehensive Operational Analysis
As reported in Phase II, based on MST staff interviews, the Comprehensive Operational Analysis (COA) studies conducted after the technology implementation (e.g., Salinas Area COA study in 2006) have taken less time to complete compared to earlier studies. The accuracy of the analysis results obtained from these COA studies is also more reliable as compared to earlier studies (e.g., COA study in 1999). Due to the availability of ACS, now MST has access to a larger volume of more reliable data for analyses. MST can respond to the data needs of its consultants in a better and more timely manner. Previously, MST had to hire temporary staff to meet the data collection needs for COA studies.
The availability of the ACS provides the flexibility to consider different scenarios for operational analyses (e.g., seasonal ridership and monthly ridership). MST believes that such flexibility is very useful, especially for analyzing seasonal patterns (e.g., patterns of ridership and the on-time performance) in their system.9
The accuracy and reliability of the ACS data assists MST in defending information that is presented to the Board of Directors and the general public in implementing recommendations of COA studies. Before the ACS implementation, MST could not provide enough information to support Board requests. For example, the service improvement plan proposed after the COA study in 1999 faced a lot of questions and concerns during the public meetings. It was challenging for MST to defend those results since the data was collected manually and could not be validated using additional data. Also, the validation process would have demanded extra resources in terms of time and money. Now, the ACS can provide additional data if needed. For example, in 2006, MST proposed to eliminate service on Route 21 due to poor performance and was able to defend their proposal based on an analysis conducted using archived ACS data.
Even though MST believes that the cost of data collection has been reduced as a result of the ACS, it does not have any quantitative information to show the actual change in the cost of conducting COA studies.
3.1.2.2 Impact on On-Time Performance
3.1.2.2.1 Results of Phase III Data Analysis
In order to understand the analysis results, the Team revisited several operational and policy changes implemented by MST that could have had a direct or indirect impact on its on-time performance and reliability (or customer perception of reliability). Figure 9 shows a list of the changes implemented between 2002 (at the time of ACS implementation) and June 2009. Further, Figure 9 lists several activities related to ACS implementation and operation (e.g., missing data and trigger zone modification) and implementation of other technologies related to ACS.
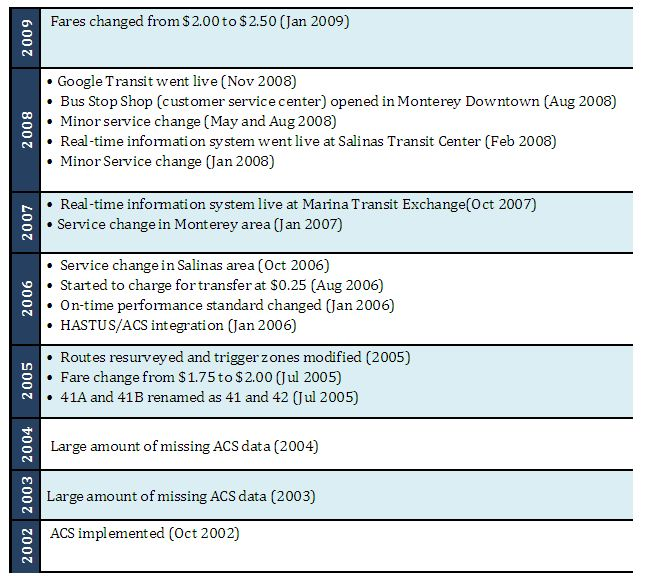
Image details
Figure 9. Timeline of Events Related to ACS Deployment
The implementation of the real-time information system would not have directly impacted MST operations but is listed in the figure since this implementation could have impacted the customer perception of service reliability (before and after its implementation). Customer perception of reliability was measured as part of the qualitative analysis.
Analysis results for lateness and earliness by trip are discussed in Sections 3.1.2.2.1.2 and 3.1.2.2.1.1. Section 3.1.2.2.1.3 includes a discussion about earliness and lateness trends by timepoint.
3.1.2.2.1.1 Earliness Analysis by Trip
Average earliness by trip for the selected routes was calculated as follows. First, all early timepoints were identified on a trip. Then, the sum of earliness across these timepoints was divided by the number of early timepoints on that trip to calculate the average earliness for an individual trip. The average value of earliness for all trips on a particular route for a given time period was calculated by dividing the sum of earliness by trip for all trips within the time period by the number of early timepoints in that time period. Hence, the calculation of earliness can be represented by the following equation:

The variables used in the equation can be defined as follows:
Eij = Earliness value at Timepoint i on Trip j
NE = Total number of timepoints on a trip at which buses arrived early
NS = Total number of trips within a schedule period on a route
Average earliness by trip was calculated by time of day and day of week to observe the impact of traffic on earliness trends. In this section, the earliness analysis for three scenarios is presented, including earliness values for all trips, all weekday off-peak trips, and Saturday trips. The results are presented separately for inbound and outbound trips. Analysis results for additional scenarios are provided in Appendix B.
Figure 10 and Figure 11 represent average earliness for all trips in the analysis timeframe for inbound and outbound directions. In the inbound direction, Routes 1, 9, and 10 show a gradual increase in earliness over the study time frame. Routes 41 and 42 show a decrease in earliness from the end of January 2006 to June 2007, followed by an increasing trend. Further, a sharp decrease can be noted on Routes 41 and 42 from July 2008 through May 2009. The change in earliness around July 2008 coincides with the service change that was made in August 2008 which resulted in the elimination of a timepoint located at the intersection of Del Monte and Sanborn Streets. Also, the variable patterns on Routes 41 and 42 across the evaluation timeframe could be attributed to operational changes made on these routes in 2005 and 2008.

Figure 10. Average Earliness by Route for the Inbound Direction
In the outbound direction, earliness does not vary significantly for any of the routes in the analysis over the time period. These routes show a slight increase from July 2008 through May 2009. However, this pattern cannot be attributed to any operational changes.

Figure 11. Average Earliness by Route for the Outbound Direction
Figure 12 and Figure 13 show average earliness for weekday off-peak trips, which are not affected by rush hour traffic. However, no consistent trend in earliness was found. Inbound trips on Route 1 show an increase in earliness starting in January 2007, which could be due to changes made in the route in January 2007. Average earliness values for Routes 9 and 10 do not vary by more than 1 minute between consecutive schedule periods but at the same time they do not follow any trend across the study timeframe. Routes 41 and 42 show a more variable trend of earliness due to the operational changes mentioned earlier. No significant change in trends was recognized for outbound trips.

Figure 12. Average Earliness by Route in Inbound Direction during the Weekday Off-peak Period

Figure 13. Average Earliness by Route in the Outbound Direction during the Weekday Off-peak Period
Figure 14 and Figure 15 present average earliness by trip for Saturday trips. Saturday trips were considered for analysis since data for these trips could assist in analyzing an earliness trend without a bias, which could be caused by commuter traffic when Saturday trips are analyzed along with weekday trips. However, no consistent trend in earliness was noted.
In the inbound direction, Routes 9 and 10 show a significant increase in average earliness from January 2007. This increase was not seen in weekday trips. This can be attributed to service changes that went into effect that eliminated service to some areas on Routes 9 and 10 during weekends and holidays. No significant trend in earliness was noted in the outbound direction.

Figure 14. Average Earliness by Route in the Inbound Direction on Saturdays

Figure 15. Average Earliness by Route in the Outbound Direction on Saturdays
While no clear trends in earliness are seen across the study timeframe, average earliness in the outbound direction does not show large changes between any consecutive schedule periods. A large number of early arrivals suggest that some additional running time was built into the schedules for all routes selected for the analysis.
In the inbound direction for Routes 41 and 42, the decrease in earliness is noted between January and May 2006, followed by an increase from June 2007 through the beginning of 2008. Then, there was another sharp decrease from January 2008 through May 2009.
Average earliness for weekday off-peak trips in the inbound direction on Route 1 increased from January through May 2007, and then remained constant. MST implemented a schedule change on the same route on January 27, 2007 (that rerouted Route 1 at both downtown Pacific Grove and downtown Monterey). This may have resulted in travel time savings that are more significantly evident during the off-peak periods.
3.1.2.2.1.2 Lateness Analysis by Trip
Average lateness was calculated in a fashion similar to average earliness and can be represented by the following equation:

The variables used in the equation can be defined as follows:
Lij = Lateness value at Timepoint i on Trip j
NL = Total number of timepoints on a trip at which buses arrived late
NS = Total number of trips within a schedule period on a route
Figure 16 and Figure 17 show the trends for average lateness per late trip for selected routes in inbound and outbound directions. In these charts, it is evident that Route 1, 9, and 10 have a more or less constant lateness with a variability of less than 1.5 minutes over the timeframe. Routes 41 and 42 experienced an increase in lateness from the end of January 2006 to the end of July 2007, and then again from the end of January 2008 to mid-May 2009. Outbound trips on these routes do not display any well-defined increases or declines, but exhibit smaller changes during the evaluation timeframe as compared to trends seen with inbound trips.

Figure 16. Average Lateness by Route in the Inbound Direction
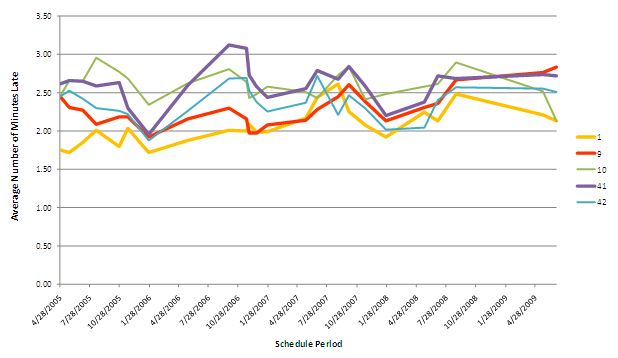
Figure 17. Average Lateness by Route in the Outbound Direction
The inbound and outbound trips in the weekday off-peak period have similar trends (see Figure 18 and Figure 19) as discussed above. This means that the factors responsible for inconsistent schedule adherence were not impacted by rush-hour traffic during a weekday.
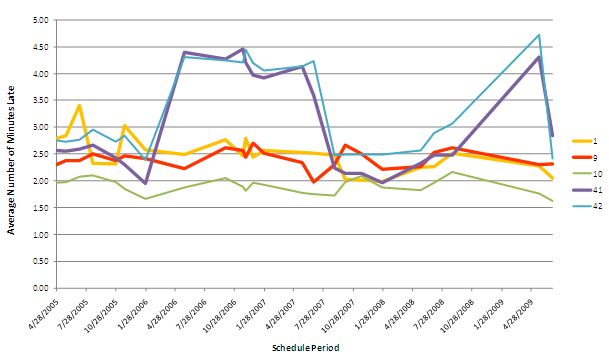
Figure 18. Average Lateness by Route in the Inbound Direction during the Weekday Off-peak Period
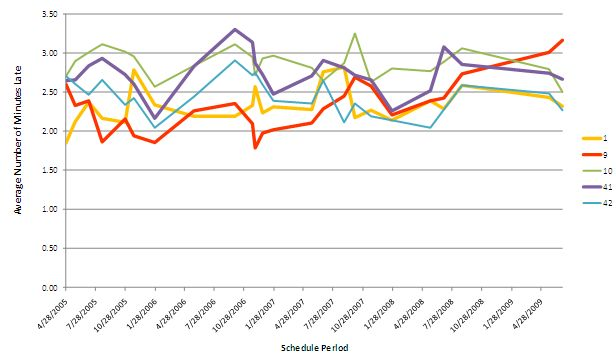
Figure 19. Average Lateness by Route in the Outbound Direction during the Weekday Off-peak Period
Trends for Saturday only trips are provided in Figure 20 and Figure 21. The Saturday trips also show similar trends as seen in Figure 16 through Figure 19, apart from minor fluctuations noticed over certain schedule periods. This observation seems to suggest that commuter and school-related travel, and/or peak traffic do not bear a significant impact on the on-time performance for these bus routes. Also, elimination of weekend and holiday trips going into certain parts of the MST service area on Routes 9 and 10 did not have any significant impacts on the lateness trends of these routes.
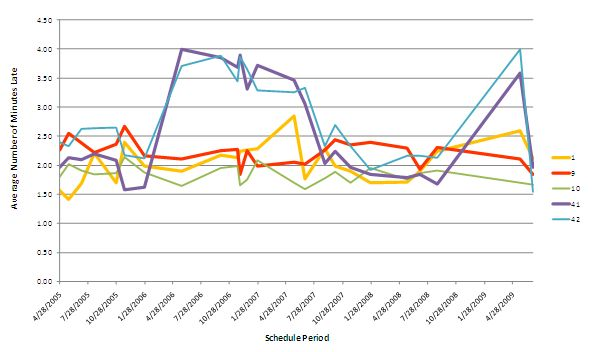
Figure 20. Average Lateness by Route in the Inbound Direction on Saturdays
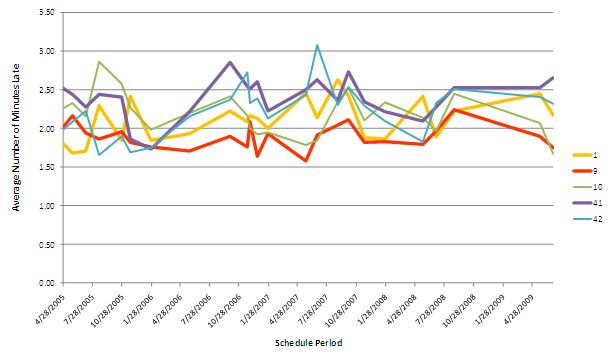
Figure 21. Average Lateness by Route in the Outbound Direction on Saturdays
Observations that can be made on the basis of the above analysis results are as follows:
- Routes 9 and 10 show similar trends in average lateness to each other. The same is true for Routes 41 and 42. In both route pairs, individual routes run on the same corridor for a significant length, which may explain similar on-time performance values since several timepoints are common.
- Routes 1, 9, and 10 in the inbound direction do not exhibit high variability in average lateness - they vary in a range of 1 to 1.5 minutes. However Routes 41 and 42 display two prominent peaks during the study time frame.
- Outbound trips present a constantly fluctuating trend of lateness throughout the timeframe suggesting seasonal variations.
- We also reviewed ridership numbers to determine if schedule periods with higher boarding counts (e.g., during tourist season in August) were resulting in lateness as larger number of boardings at stops would increase bus dwell time at those stops resulting in higher values of lateness. Routes 41 and 42 experienced high ridership during May 2006 through August 2006, and again in May, August and October 2007, with ridership dipping in January and February 2007. This may have contributed to high average lateness seen in the graphs for 2006 for both inbound and outbound direction.
3.1.2.2.1.3 Average Lateness and Earliness by Timepoint
While all of the previous analyses aggregate lateness and earliness by trip, the Evaluation Team also evaluated average lateness and earliness by timepoint to understand whether the geographic location of timepoints was correlated to schedule adherence at those timepoints. This analysis identifies timepoints that incur greater earliness or lateness and offers a further explanation for earliness and lateness trends at the trip level.
All five routes' trips were separately analyzed in the inbound and outbound directions. For each timepoint, average lateness is calculated by summing all adherence values that indicate a late arrival. This value is divided by the number of late arrivals. Average earliness is calculated in a similar manner (i.e., total number of minutes early divided by total number of early arrivals). Some key observations based on this timepoint level analysis are summarized in Sections A and B along with supporting graphs. Analysis results for other scenarios which were not as significant are provided in Appendix B.
A. Salinas Transit Center
The Salinas Transit Center serves as the starting point of outbound trips on Routes 41 and 42. As shown in Figure 22 and Figure 23, there is a significant fluctuation in the average earliness at the start point of outbound trips. However, other timepoints in do not show such variability. We are not aware of why this significant fluctuation exists.
In the legend for Figure 22 through Figure 25, timepoints are numbered (shown within parentheses in the charts) according to their order in the direction of travel.
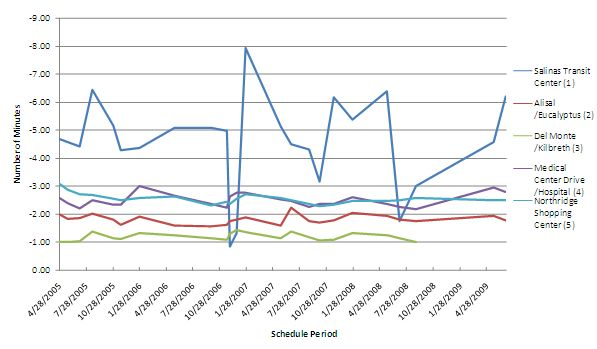
Figure 22. Average Earliness at Timepoints on Route 41 (Outbound)
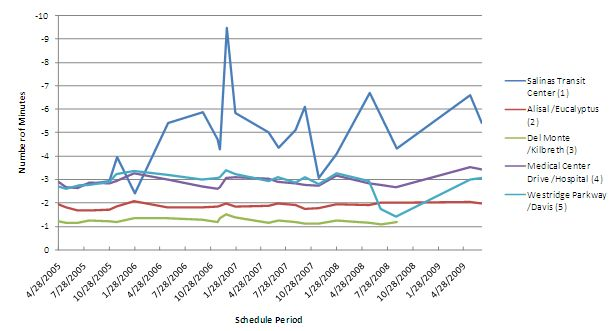
Figure 23. Average Earliness at Timepoints on Route 42 (Outbound)
As shown in Figure 24 and Figure 25, the average lateness of the inbound trips on Routes 41 and 42 at Salinas Transit Center (the last timepoint) indicate a significant increase of approximately 4 minutes between January 2006 and May 2007. This decreases sharply from May to August 2007 and then begins to increase from the end of August 2008 through May 2009. The pattern of lateness seen at the timepoint level is similar to that at the trip level for Routes 41 and 42. This pattern suggests that a significant delay occurs at the end of the trip in Salinas, possibly due to higher levels of traffic in this urban area. Also, it may be due to high boarding counts and, therefore, higher dwell times at this location. Other timepoints have a fairly constant level of lateness throughout the analysis time frame.
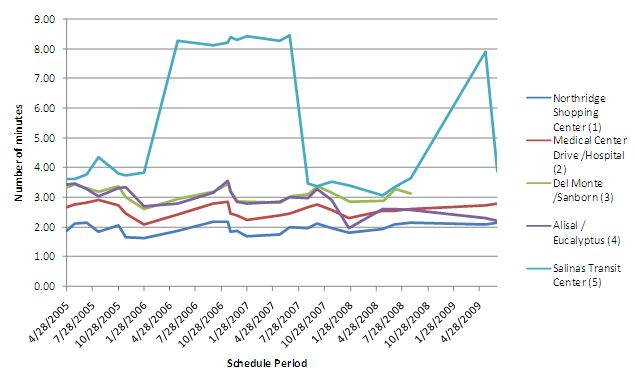
Figure 24. Average Lateness by Timepoints on Route 41 (Inbound)
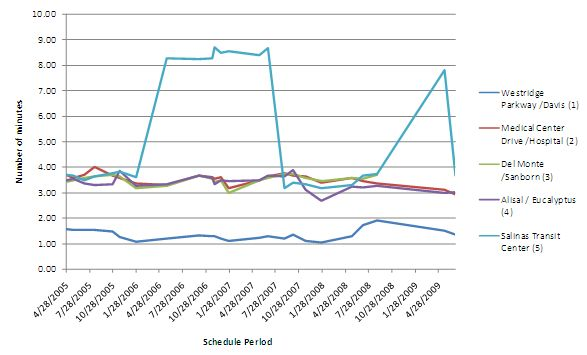
Figure 25. Average Lateness by Timepoints on Route 42 (Inbound)
B. Monterey Transit Plaza
Monterey Transit Plaza is the starting point of all outbound trips on Routes 1, 9, and 10. Surprisingly, the average earliness trends show significant fluctuations at this timepoint (similar to Salinas Transit Center). These trends are shown in Figure 26, Figure 27 and Figure 28. These fluctuations are not observed at other timepoints.
In the legend in Figures 26 through 28, timepoints are numbered (shown in parentheses in the charts) according to their order in the direction of travel.
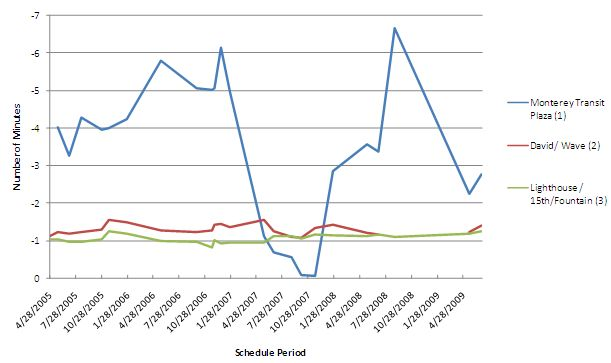
Figure 26. Average Earliness for Timepoints at Route 1 (Outbound)
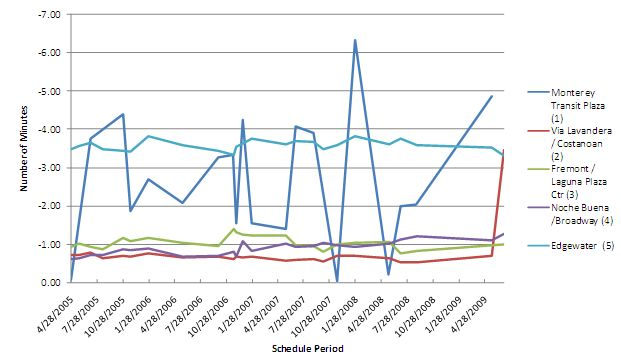
Figure 27. Average Earliness for Timepoints on Route 9 (Outbound)
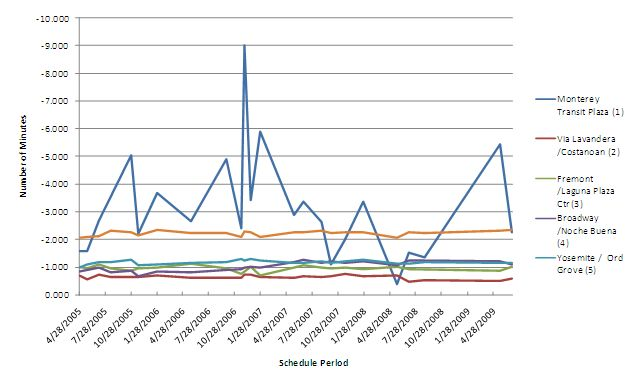
Figure 28. Average Earliness at Timepoints on Route 10 (Outbound)
The timepoint analysis of earliness and lateness led to the following observations:
- Monterey Transit Plaza, Salinas Transit Center, and Edgewater Transit Exchange are among the timepoints that have the most variable and broad windows within which earliness and lateness is seen to vary.
- The trend in lateness observed at the Salinas Transit Center between 2006 and 2007 and between 2008 and 2009 is similar to what we observed in the analysis of Routes 41 and 42 at the trip level. This observation indicates that significant lateness at the Salinas Transit Center alone could have contributed to the significant lateness observed at the trip level. It is likely since high boarding counts at the Salinas Transit Center could have resulted in high dwell times, and hence, late departures from this location, resulting in significant lateness values for trips on Routes 41 and 42.
- The average earliness of outbound trips at timepoints other than the start of the trip did not vary significantly over the analysis time frame. However, the variation at starting points, as discussed above, is significant and suggests that schedule adherence is unreliable at these timepoints.
- As seen in the trip level analysis, the average lateness for the routes in the outbound direction fluctuates periodically throughout the timeframe but does not show any significant changes. Lateness follows the same pattern at all timepoints on individual routes demonstrating that no geographic factor is significantly contributing to the changes in on-time performance.
- The average lateness in the inbound direction varies significantly at the timepoint level, particularly for Routes 41 and 42.
- The average earliness of inbound trips generally is higher at the last timepoint, which is Monterey Transit Plaza for Routes 1, 9 and 10, and Salinas Transit Center for Routes 41 and 42. There is no clear trend for average earliness at any of the other timepoints along these routes.
3.1.2.2.1.4 Overall Summary of AVL Data Analyses
We analyzed schedule adherence trends by both trip and timepoint, but were not able to support the hypotheses mentioned earlier. Similar to Phase II, the selected routes were changed throughout the analysis period. Variable trends in schedule adherence were recognized, and thought to be due to a variety of reasons.
Even though a clear trend was not evident, variability was within a range of one to two minutes in all cases for both earliness and lateness. Also, lateness was observed to be less than 5 minutes, which is within the threshold for lateness as defined by MST. Typically, MST dispatchers would take action and alert drivers about late arrivals and departures at a timepoint only when the vehicles are late by 5 minutes or more. Thus, schedule deviations of less than 5 minutes would have remained unnoticed by MST operations. Also, early arrivals are regarded as on-time by MST, so unusual early trends were not recognized as anomalies.
Thus, despite the fluctuating trends in our analysis, we can conclude that MST has been able to use ACS to their advantage in keeping their trips on time per their definition of on-time performance. Also, as indicated in Phase II, MST has been making many decisions regarding service planning and scheduling changes since 2005 by analyzing the on-time performance of routes (per their standards) using AVL data, along with incorporating feedback from other analyses. For example, changes such as restructuring certain routes, eliminating and adding certain timepoints, adding running times, and eliminating or adding certain trips (e.g., morning trips or express trips) were done primarily by reviewing the route performance using data from the ACS. The impacts of some of these changes on on-time performance trends have been discussed in earlier sections in the report.
However, as concluded in Phase II, the on-time performance and reliability improvements in MST service cannot be directly attributed to the implementation and utilization of the ACS.
3.1.2.2.2 Findings from the Customer Survey
In Phase III, the customer intercept survey data showed that nearly 70% of the surveyed riders in Monterey and Salinas (where service changes were made in 2006 and 2007, respectively) are "satisfied" or "very satisfied" with MST's on-time performance. Also, a significant number of surveyed riders feel that the new improvements have resulted in making transfers at major transfer centers easier.
In addition, overall satisfaction with the routes selected for quantitative analysis in Phase III is 70 percent and 80 percent (see Figure 71 and Figure 72 in Section 3.8.3.4 for a detailed description).
3.1.2.2.3 Findings from MST Staff Interviews
As reported in Phase II, MST believes that the process of tracking on-time performance has become more efficient since the implementation of the ACS. Prior to the ACS deployment, the on-time performance was determined manually by supervisors by checking vehicle performance against timepoints. Now this process is automated in the ACS system. The ACS tracks vehicle on-time performance at every timepoint and alerts coach operators, dispatchers, and supervisors as needed.
Initially, there were issues with the data generated by the ACS system, but this system has improved over the past few years and has become more reliable in reporting on-time performance. Immediately following the ACS deployment, only 78 percent of timepoints were correctly defined in the ACS system. This problem was due to errors generated in surveying routes and was corrected after resurveying those routes in 2004. The routes were initially surveyed by the ACS vendor. After obtaining proper training, MST conducted the surveys again themselves for the routes with the highest volume of missing information. Resurveying has helped MST reduce the amount of missing data in the ACS. Consequently, the ACS has been collecting better on-time performance data for MST routes since the resurveying was completed.
Along with resolving issues related to resurveying, MST had to learn a lot about field conditions for setting the thresholds for on-time performance. The change in the on-time performance threshold in 2006 has helped MST in improving the percentage of their on-time performance. These thresholds for early and late arrivals were recommended by the COA study conducted by MST in 2005.
Generally, MST believes that the ACS has helped the agency to monitor and improve its on-time performance in recent years. They have noticed that the system-wide on-time performance has improved since the implementation of the technologies. Figure 29 and Figure 30 present the system-wide on-time performance statistics measured in FY 2004 and 2007, respectively. It is evident from these charts that MST's on-time performance was more than 80 percent across FY2007, with monthly average on-time performance being approximately 84 percent. Earlier, in FY 2004, the monthly average on-time performance was only 74 percent. However, it is not evident from these charts that improvements have been due to the change in on-time performance standards or technology implementations. The impact of the change in early and late arrival thresholds on on-time performance standards discussed in Section 3.1.1.1.1 could be the reason behind this improvement.
The ACS has enabled MST to make coach operators more accountable. Now, reports can be generated in the ACS related to operator performances, so coach operators are aware that they will be held accountable for early or late departures. The on-time performance compliance reports for operators are provided routinely to supervisors who can be pro-active in monitoring the vehicles that are operated by specific coach operators.
MST believes that it has achieved significant travel time savings since the technology implementation but it does not have any quantitative information to support that claim. However, the results of the recent COA studies in 2005 and 2006 show some travel time savings. MST has been focusing on reducing travel time to some of its destinations by analyzing ACS data. The agency has already introduced certain express bus services (e.g., Seaside to Carmel). These changes have resulted in increased ridership and decreased travel times along those routes.
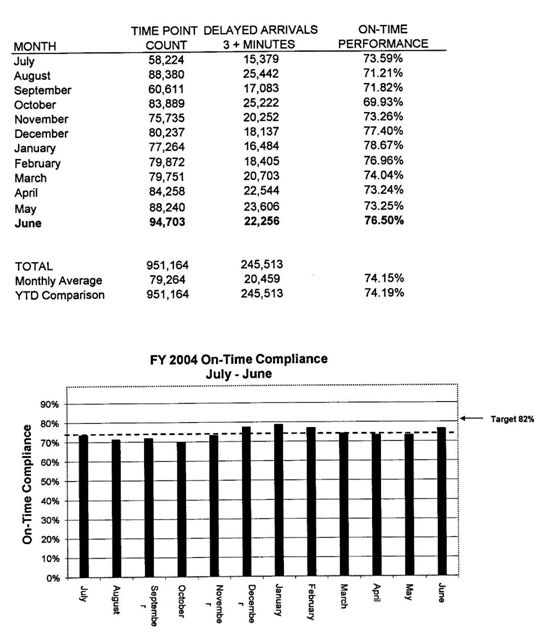
Image details
Figure 29. System-Wide On-Time Performance Statistics in FY 200410
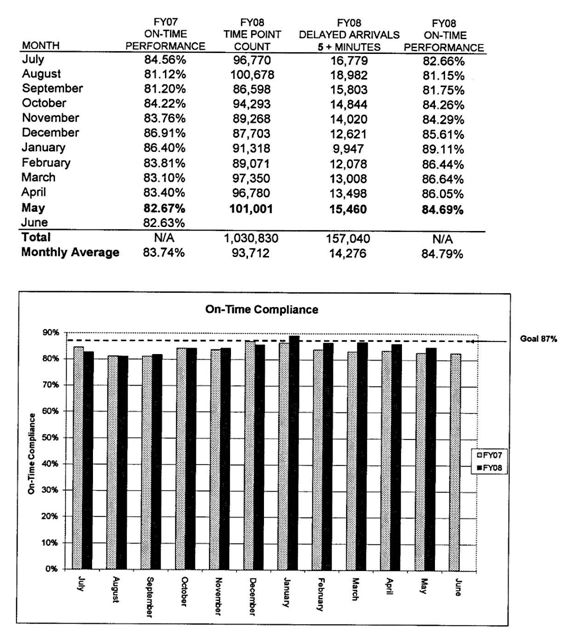
Image details
Figure 30. System-Wide On-Time Performance in FY 2007 and FY 200811
As stated earlier, the ACS data has helped MST understand seasonal patterns in on-time performance (also obvious in Figure 29 and Figure 30). MST recognizes that on-time performance is reduced during the summer season due to increases in road traffic. Also, MST believes that the rush hour traffic impacts on-time performance and, consequently, adjusts schedules to provide sufficient running time for vehicles operating during peak hours.
3.1.2.3 Impact on Resource
As reported in Phase II, MST did not have a significant change in staff due to the technology implementation. Occasionally, MST hired interns for preparing maps while conducting COA studies, but interns mostly perform GIS analysis work (using ArcView).
MST believes that technology has provided limited help in saving resources. In fact, the technology implementation has generated the need for more staff to manage and use the data generated by the deployed systems. MST spends a large amount of time in managing and analyzing the additional information generated by the ACS and other technologies. Nevertheless, it takes less time to collect data now since MST does not have to rely completely on manual data collection.
MST has recognized several benefits from the scheduling system. HASTUS has allowed MST to perform runcutting in less time than it took using their prior product; currently, it takes 2 to 3 hours to perform the runcutting. In addition, MST can fine-tune blocking by bringing trips together more efficiently in the HASTUS system.
The technology has helped MST use its vehicle fleet efficiently. When MST retired 17 vehicles from its fleet, it purchased only 15 vehicles to replace them. Also, there has been a reduction in the number of coach operators from 132 to 123. While some of this reduction can be attributed to technology, a budget cut was partially responsible for this reduction as well.
3.1.2.4 Impact on Productivity
MST has noted that there have been improvements in productivity since the implementation of the ACS. However, MST does not consider the improvements in productivity to be an absolute indicator of good transit performance. For example, MST noticed that a reduction in productivity (e.g., passenger per revenue-hour or passenger per revenue-mile) on some routes also reduced overcrowding and resulted in faster boarding and improved on-time performance. The overcrowding on buses was reduced by restructuring some of the MST routes to reduce transfers based on results of an analysis of the ACS data. MST analyzed origin and destination information in the ACS system for routes that were overcrowded and had poor on-time performance. MST decided to add another service to provide direct routes and reduce transfers, which resulted in redistributing loads in the system.
3.1.2.5 Impact on Passenger Counting and Ridership
Before the ACS implementation, MST counted passengers using ride checkers, which required recruiting a dedicated staff. MST also used to obtain passenger counts from fareboxes. However, the passenger counts obtained from fareboxes were not thought to be very useful since the location and time of boarding was not available from the farebox. MST believes that the time and location of boardings from the ACS assists them in reducing operational costs and revenue-hours.
MST decided to approach passenger counting in a different way than many agencies that deploy automated passenger counting (APC) systems. MST was skeptical about the reliability of the APCs available in the market at the time of the ACS implementation. Instead it decided to implement an innovative solution for tracking the number of boardings with the help of the ACS system: MST designed and implemented an interface on the MDT for the coach operator to enter passenger counts. MST coach operators use this interface to enter the number of boardings at each stop. This interface also allows MST to associate numeric codes with boardings to indicate the fare type. For example, MST can capture boardings during special events using a special code for such events.
The boarding counts are sent to the ACS in real-time. While MST collects its passenger counts through the use of the ACS, spot checks are sometimes conducted on overcrowded buses to ensure that the counts are being recorded accurately. At times, MST had issues with training the coach operators in using the passenger counting feature on the MST. For example, the coach operators were found entering boarding information after leaving the departure zone and had to be retrained to use the feature while the vehicle was not in motion or after leaving the stop.
Information regarding the direct impact of the ACS implementation on ridership changes was not available. However, MST adjusted certain routes based on archived ACS data, resulting in a trend of increasing ridership since 2004 (see Figure 31). MST ridership declined in 2008 and 2009, and this decrease could be due to socio-economic changes in the MST service area (e.g., job losses in the Salinas area). This decrease in ridership could not be directly attributed to changes made in MST service.
Further, the on-board rider survey conducted by MST in December 2007 reported that 80 percent of MST riders agreed that MST service had improved since 2006. Also, MST service received an average rating of 1.7 (where, 1=excellent, 2= good, 3= fair and 4= poor) in the same survey. Also, as stated earlier based on intercept survey results, nearly 80 percent of the surveyed riders from Monterey and Salinas areas are satisfied or very satisfied with MST service.
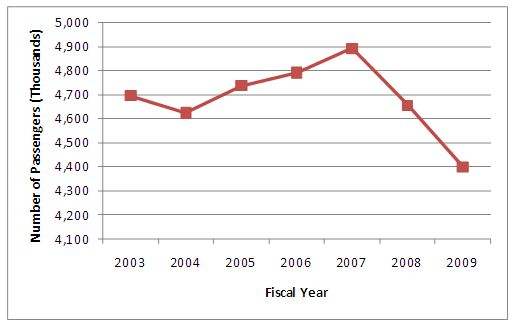
Figure 31. Annual Ridership
The passenger counting information obtained from the ACS has assisted MST in restructuring its services. For example, MST reduced service hours on certain routes that were found to have a low number of boardings during those hours.
MST experienced a ridership increase due to the deployment of on-board internet access on two long-distance commuter routes: the Monterey-San Jose express and Salinas-King City. MST conducted a survey in October 2007 to find out the response of riders to the Internet access. The survey results showed that riders consider this as an important amenity for commuters. The passenger survey showed that 55 percent of the respondents were aware of the on-board Internet access and 24 percent of the respondents had used the service before. Based on the initial positive response, MST is planning to install wireless Internet access at other locations such as transfer facilities and parking garages with the help of a local private partner.
3.1.2.6 Impact on Vehicle-Hours, Vehicle-Miles and Passenger-Miles
Figure 32 shows an increasing trend in the number of annual passenger-miles and serves as a positive indicator for increased ridership. Passenger-mile data for 2008 and 2009 could not be obtained from MST, so updated trend information is not available for this MOE.
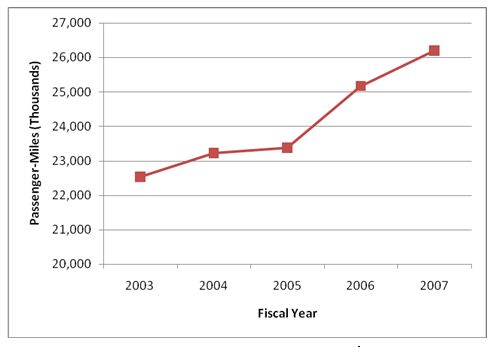
Figure 32. Annual Passenger-Miles
A review of annual vehicle revenue-miles shows an inconsistent pattern (see Figure 33). Revenue-mile statistics were the highest in 2007. An increasing trend can be seen in recent years. However, the increase in revenue-miles cannot be attributed directly to the impacts of technology deployment, as there is limited evidence to support this claim.
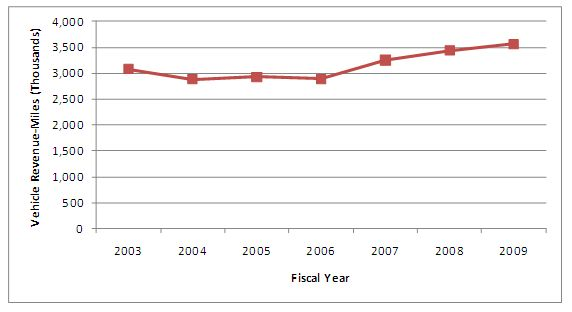
Figure 33. Annual Vehicle Revenue-Miles
Figure 34 shows an increasing trend in passenger-miles per employee since the technology deployment. This indicates that productivity has improved since the 2003. In summary, MST has served more passengers with existing resources through the use of technology. Passenger-mile data for 2008 and 2009 could not be obtained from MST, so updated trend information is not available for passenger-miles per employee.
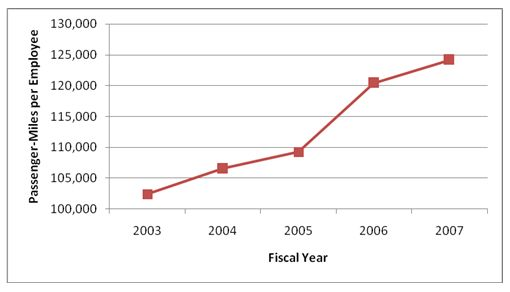
Figure 34. Annual Passenger-Miles per Employee
Figure 35 shows the trend in annual revenue-hours since 2003. This graphic shows that the annual revenue-hours have increased consistently since 2006 even though there was an inconsistent trend prior to that. This inconsistent trend prior to 2006 could be a result of operational changes implemented by MST. But, it is important to analyze vehicle revenue-hours in conjunction with the number of boardings. As seen in Figure 36, boardings per revenue-hour have consistently decreased since 2006. However, the decrease is less than five boardings per hour and can be attributed to various operational and policy changes (including a fare change) made during the evaluation timeframe. Also, external factors such as socio-economic changes in the area (e.g., an increase in unemployment) could have resulted in a decrease in ridership in 2008 and 2009.
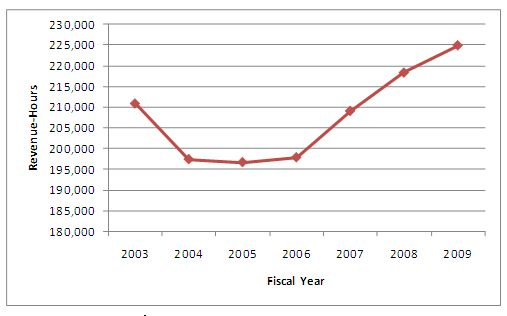
Figure 35. Annual Revenue-Hours
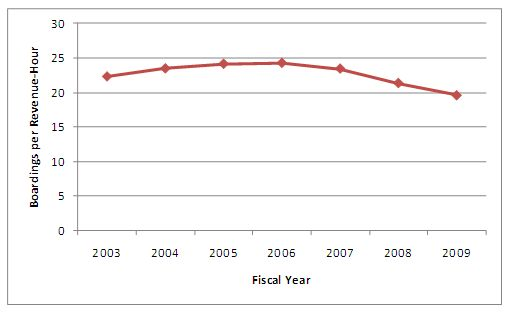
Figure 36. Boarding per Revenue Hour by Fiscal Year
3.1.2.7 Other Impacts and Perceived Benefits
As reported in Phase II, based on staff input, MST recognizes that the technology has, in general, resulted in efficiency improvements as well as increased MST's confidence in its ability to provide accurate information to customers. Beyond the major impacts described in earlier subsections, the ACS has assisted MST in improving activities that take place in planning and operations departments. These impacts are as follows:
- Impact of Real-time Vehicle Data: MST believes that the ACS has had more impact on numerous departments than other technologies implemented at MST. Primarily, the capability of the ACS to provide real-time data from the field has been of great use to all departments. MST no longer has to rely on anecdotal information from supervisors or coach operators. Further, anecdotal information can be integrated with the field data generated by the ACS and the video surveillance system. This ability to integrate information enables MST to prioritize events or incidents and act immediately on those events or incidents that need urgent attention.
- Impact on Planning: MST has developed innovative ways of utilizing the data from the ACS for various planning needs. For example, MST uses boarding data from the ACS to determine the stops with high boardings for installing shelters. Also, the system assists MST in determining if shelters should be moved to more appropriate locations. For example, on one of the MST routes, shelters were placed next to each other at stops even though there were not enough boardings. MST decided to move the shelters and was able to use the boarding data to convince the City Council about the decision. The boarding data is used by MST to attract advertisers at shelter locations also.
- Impact of HASTUS: In 2005, MST implemented new contract rules which required scheduling software that would take these rules into account. At the same time it needed to replace the existing fixed-route scheduling software, so MST procured new the new HASTUS scheduling software from Giro, Inc. HASTUS is able to handle specific contract requirements such as meal and rest breaks and can perform better runcutting than the previous software.
Also, as mentioned earlier, MST has decided to use Google Transit trip planner, which requires a data feed to reflect service changes at the agency. HASTUS will provide the data feed for Google Transit. The data feed will be sent to Google every 3 months (at the time of each schedule change).
- Improvements in Service through Data Analyses: The MST planning department built an interface between Microsoft Access and the ACS database to extract specific information by writing ad-hoc queries. MST uses data from the ACS to determine the routes that do not have sufficient run-time built in their scheduled runs. MST also uses the results obtained from the analyses to review and adjust the timepoints on routes that it found to be late consistently.
- Reduction in Voice Radio Traffic: Information on the average length of calls does not exist. However, MST believes that the number of voice calls has been reduced by 60 percent since the ACS implementation. One of the reasons the agency believes that the number of voice calls has been reduced is that the dispatchers know the real-time locations of vehicles from ACS and need to contact coach operators only on a by-exception basis. Also, the data messaging feature in the ACS can be used when a coach operator does not need to speak to the dispatcher.
Prior to the implementation of the ACS; voice radio was the only mode of communication for coach operators, dispatchers and supervisors. At this time, the radio system was over capacity due to the high volume of voice traffic. Also, prior to the ACS implementation, every bus arriving at a transit center plaza used to call the dispatcher to hold the bus for transfer, resulting in constant voice radio traffic. The number of such calls has decreased since coach operators call the dispatcher only when they need to hold the last bus for the day.
- Impact on Supervisors: The ACS system assists dispatchers in locating the supervisor nearest to a vehicle when there is an incident. Starting in September 2008, MST plans to equip supervisor vehicles with ruggedized laptops that will provide them with access to the ACS while they are working in the field. Remote access to the ACS will be provided over a virtual private network (VPN) connection.
Originally, MST requested that the ACS vendor provide a quote for remotely accessing ACS, but the agency found the quote to be relatively high. Additionally, MST questioned the reliability of the vendor's remote access technology. Eventually, MST developed an in-house solution. The remote access capability over VPN also enables MST staff to access the ACS from home during emergency situations or non-business hours.
- Impact on Emergency Management: MST receives covert (or silent) alarms from coach operators when they indicate that there is an emergency situation. Usually, MST receives a very low number of these alarms (e.g., two alarms per month). A majority of the covert alarms received by MST are due to accidental activations. However, MST believes that this covert alarm feature has been valuable to the organization, even though it has had a very limited experience using it.
As stated earlier, the ACS assists MST in managing the evacuation process during natural disasters such as wildfires in summer 2008. For example, during the recent Big Sur wildfires, MST was identified by the Office of Emergency Services (OES) as a secondary resource for providing evacuation services. MST developed plans to monitor the vehicles that would be part of the evacuation task-forces in the ACS.
- Impact on Coach Operators: There has been a noticeable change in the behavior of coach operator after the ACS deployment. They have become more responsive and accountable for operating their vehicles on time. This change can be attributed primarily to the real-time vehicle tracking capability of the ACS.
Also, MST has improved their training of coach operators with the help of videos recorded by the on-board surveillance system.
3.2 Impact on Maintenance and Incident Management
3.2.1 Overview of the Maintenance Process and the Maintenance System
The maintenance department at MST maintains the fixed route vehicles fleet and relief units in-house. They follow up with contractors on the maintenance of MST RIDES vehicles and trolleys. Generally, contractors such as MV Transportation maintain their own vehicles and provide daily reports on the status of their vehicles to MST. MST is responsible for the maintenance of the major components of contracted vehicles.
The maintenance department purchased and installed a maintenance management system (MMS) in March 2006. The MMS has been implemented at MST by integrating the capabilities of both automated fuel management (e.g., automated fuel dispensing, tracking fuel consumption and efficiency) and fleet management (e.g., work order processing and preventive management) technologies. MST procured both fleet management (i.e., FleetFocus) and fuel management (i.e., Fuel Focus) systems from the vendor.
Contractors are using the MMS at a very basic level, mostly to generate preventive maintenance (PM) reports. Even though vehicles operated by contractors are set-up in the MMS at MST, maintenance systems at these organizations are not integrated.
Initially, MST had plans to integrate the MMS with the financial and accounting management software (FAMIS). MST developed an interface with help of the FAMIS vendor but the interface was not successful. Eventually, MST decided against integrating the two systems. Since there is no interface between the FAMIS and the MMS, MST cannot automate the initiation of purchase order. However, a manual workaround for generating purchase orders for required asset components (e.g., maintenance parts) is semi-automated.
Figure 37 shows the automated fueling system installed at the MST headquarters garage. The system, known as FuelFocus, consists of several automated features such as automatic vehicle identification and odometer reading with the help of radio frequency (RF) technology and overhead sensors (see Figure 38), electronic fuel dispensing, remote access to the fuel station hardware, and data logging and report generation. This automated fuel management system assists MST in tracking and controlling fuel usage by all MST vehicles.
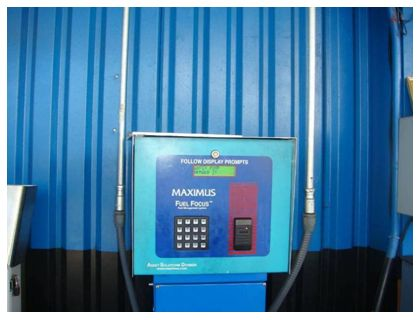
Figure 37. Fuel Focus Hardware
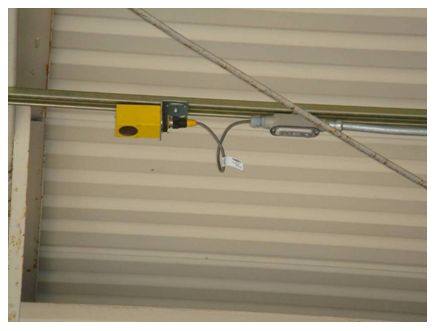
Figure 38. Overhead Sensors for Automatic Identification of Vehicles
The FleetFocus component of the MMS assists MST in managing and controlling both preventive and corrective maintenance processes. FleetFocus captures labor in real-time and processes and monitors the status of all preventive and corrective maintenance works orders. The system can also store and report on various types of information such as equipment availability, warranty administration, and inventory control.
Preventive maintenance reports are run daily from the FleetFocus module of the MMS. MST performs vehicle servicing between 1 a.m. and 5 a.m., when all buses are parked at the MST garage. All vehicles scheduled for maintenance are held at the garage and the MMS generates work orders for these vehicles. Eventually, vehicle assignments are made to mechanics at the maintenance shop.
Further, vehicle inspections are conducted every night and the inspection data is entered into FleetFocus. The maintenance department uses laptops to run local diagnosis on ITS equipment installed on vehicles. The corrective maintenance reports are generated at night and any vehicle with a defect is taken to the maintenance shop.
Each corrective maintenance work order, identified based on vehicle inspection reports, is organized in the MMS by an individual task code. Since all maintenance tasks identified in the inspection report are coded, the maintenance reports generated by the MMS can be filtered by these task codes (e.g., which problem generated a particular work order).
The majority of the maintenance related data is collected and managed by the maintenance department electronically. Inspection data is typically entered in the MMS by a mechanic. The data-entry can take a long time for some mechanics to perform. MST believes that the data collection and reporting interface is appropriate for the end user but some of the data must be manually compiled for reporting purposes.
Figure 39 shows a vehicle undergoing maintenance in the headquarters maintenance shop.
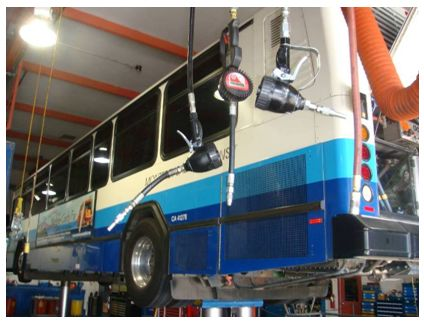
Figure 39. An MST Vehicle in a Maintenance Shop
In addition to using the MMS, maintenance staff can access the ACS, which enables them to search for various types of vehicle alarms in the ACS control log. Typical alarms captured by the ACS system are related to incidents or accidents, wheelchair issues, and mechanical failures.
3.2.2 Findings
3.2.2.1 Impact of Remote Diagnostics Data Analysis
Initially, the ACS was implemented using an alarm monitoring system (also known as remote diagnostics) for monitoring mechanical alarms. Remote diagnostics were intended to provide staff with a list of vehicle component alarms in the event queue of the ACS (e.g., engine fire, and low oil-pressure). However, the remote diagnostics system did not work as expected and was generating a large number of false alarms. It was not practical to examine such a large amount of information in real-time, particularly since most of it was false. Also, the Communications Center had become insensitive to the remote diagnostics since so many alerts were false alarms.
The vendor was notified about the problem with remote diagnostics and provided one person on-site at MST for 8 months to resolve the problem. The vendor staff person attempted to filter the event queue based on certain criteria, but that did not resolve the problem. Eventually, MST decided to ignore the real-time monitoring of discrete alarms in 2005. Now, coach operators call the dispatcher if they notice problems with any of the on-board vehicle components. MST still refers to these alarm messages for maintenance by searching the ACS control logs but does not respond to these messages in real-time.
3.2.2.2 Impact on Maintenance Management
The Team found during the staff interviews in Phase II that the maintenance department has realized the following benefits since the implementation of the ACS and the MMS systems:
- Ability to Locate Vehicles in Real-time: The maintenance department
has access to the ACS and uses it to locate vehicles in real-time. This capability
helps maintenance department to locate a vehicle that needs to be replaced
by a relief unit or is being used for a special event. Occasionally, the maintenance
staff uses the playback feature of the ACS to review vehicle operations.
- Change in Resources: MST had plans to reduce the number of maintenance
staff, especially the parts staff, after the implementation of the MMS in
2006. This was due to the fact that the most of the maintenance information
was being captured electronically. However, due to the problems with the system,
MST did not make any changes in the number of staff. In fact, the technologies
have resulted in more responsibilities and a necessity for data management.
- Improvement in Work-Process: The MMS has improved the maintenance
work process by providing better control of the maintenance workflow. The
MMS allows the maintenance manager to monitor the ongoing work. Also, the
performance of individual mechanics can be monitored in the MMS.
- Reporting: The reports in the current MMS have proved to be very
useful to the maintenance department. For example, a certain type of report
that was needed for a Board meeting could be produced quickly with the assistance
of the MMS.
- Monitoring Using the Video Surveillance System: The video surveillance
system was initially procured to enhance the security and safety of drivers
and customers, but it is also being used for various other purposes. For example,
the maintenance department uses the video playback feature to monitor the
quality of vehicle servicing in the maintenance shop. The maintenance department
also uses facility surveillance cameras to view the buses being serviced in
the shop in real-time with the help of closed circuit television (CCTV) technology.
- Secured Access to Facilities: As stated earlier, MST is planning
to control access to all its facilities using a proximity card. Currently,
doors at MST facilities are secured with the help of numeric code-based locks,
the codes for which have to be changed very often.
ST has already implemented a proximity card to enter the facility at the Marina Transit Exchange. The system is very useful and provides control to identify only those employees who should have access, determine the times at which specific employees should have access, and to create a log of all facility entries and exits.
3.3 Impact on Safety and Security
3.3.1 Overview of the Security System at MST
MST procured a video surveillance system from General Electric Security in FY 2002, and buses are now equipped with interior and exterior cameras. MST equipped its buses with cameras in phases, as stated previously in Section 1.2.4. Both interior and exterior cameras were installed. The exterior cameras are located in the front of the vehicle (facing outside the window) and on the left and right sides of the vehicle (see Figure 40).
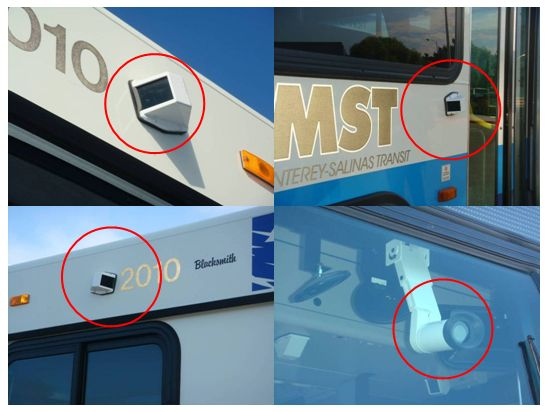
Figure 40. Exterior Camera Installations
Video is recorded on-board by digital video recorders (DVR). DVRs can store up to 72 hours of video, and the video is overwritten after 72 hours are recorded. These DVRs on all MST buses cumulatively capture up to 500 hours of video per day. MST downloads up to three DVRs a day for review. Central playback software is used to review the video. This capability assists MST in reviewing any accidents or incidents after the fact. These videos include both audio and video data from multiple cameras.
A panic button can be used by coach operators to tag incidents, after which the DVR software increases the speed of video recording. The videos are generally recorded at three frames per second (fps). On activation of the incident tagging, recording speed increases to 30 fps. This capability assists MST to capture the full-motion view of an incident or accident.
Generally, the on-board surveillance system has provided a safer transit system. Also, the surveillance system has helped MST reduce the number of false insurance claims from customers and defend against lawsuits. Accident investigations are conducted in-house, but outside consultants are involved when legal advice or assistance is required. MST has designated one staff member to perform in-house investigations. In summary, the surveillance system helps MST in:
- Resolving passenger disputes;
- Resolving complaints against drivers;
- Resolving passenger slip and falls claims;
- Verifying running red light complaints; and
- Verifying over-exaggerated complaints regarding operator assault.
CCTV video surveillance system has been installed at various physical facilities including transit centers (see Figure 41). The MST headquarters building does not yet have the surveillance system installed, but MST is pursuing a grant to install video cameras at this facility. MST believes that, as it grows, it will need to install cameras at more locations.
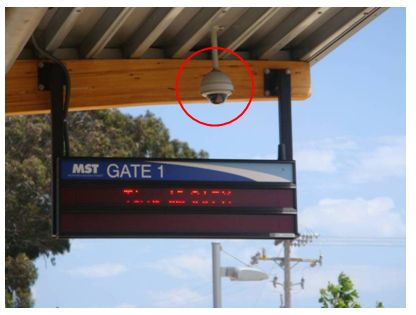
Figure 41. Facility Camera Installation (highlighted in circle) at Marina Transit Exchange
MST has also been planning to implement real-time video monitoring capability in which cameras will send live video feed to a central location on certain routes. However, it is uncertain whether or not MST will implement this system since its recurring cost is relatively high (e.g., $50 per vehicle per month). Also, the security staff thinks that a real-time video monitoring system is not required and the current system is sufficient to meet the agency's needs.
3.3.2 Findings
The security department reported during the Phase II interviews that implementation of the surveillance system has been very useful. Both employees and coach operators feel safer due to the presence of the video surveillance system. Also, coach operators believe that the surveillance system is for their protection and is not installed to "watch them." MST credits the employees' union for handling the implementation appropriately.
The major impact of the surveillance system has been on the process of handling incidents and accidents and resolution of financial claims by passengers, as described below.
3.3.2.1 Impact on the Number of Incidents/Thefts/Vandalism
When an accident or incident occurs, a road supervisor creates an incident form in the accident database of the MMS and attaches any relevant information (e.g., an image). The security department performs an investigation after receiving a claim related to an incident and attaches any further document (e.g., accident report, images, and the police report) to the initial report. The video surveillance system is not integrated with the ACS system and security investigators view the ACS control log to gather any additional information related to vehicle operations. The electronic filing of incident and accident data has made the retrieval of information much easier for MST employees. Previously, investigators had to comb through paper files for the pertinent information.
As stated above, after fall 2008, supervisors will be able to access the MMS and ACS systems from their vehicles through remote access on laptops. This capability will expedite the incident and accident investigation process and will also reduce supervisors' response times.
3.3.2.2 Impact on Financial Savings
The number and dollar amount of false insurance claims has been reduced since the video surveillance system was deployed. One of the reasons for this decrease is that passengers are aware that MST is using video surveillance and has evidence for incidents involving MST buses and physical facilities. In general, MST states that the video surveillance system has helped save the amount equivalent to 50 percent of the cost of the camera system as of FY 2007. Also, MST stated that the camera system has reduced its liability and insurance premiums since the video surveillance system was deployed.
Figure 42 shows the amount recovered by MST per the number of claims submitted by its customers in each fiscal year. This information is not available for fiscal years prior to 2005. However, the chart shows an increasing trend since the FY 2005 and supports MST's conclusion regarding the claim and insurance-related financial savings.
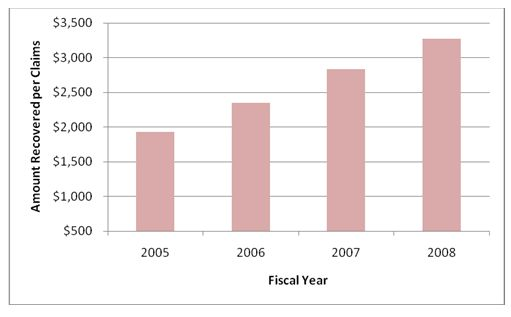
Figure 42. Amount Recovered per Claims
MST utilizes evidence from the video system to identify false passenger claims (e.g., slips and falls). MST reported that it recovered $70,000 in FY 2007, which it would have lost to customers making false claims in the absence of evidence. Before the installation of the video surveillance system, their recovery was between $800 and $1,800 per year. Also, MST was responsible for paying $3 million in settlements when it did not have video evidence to support or deny passenger claims.
Other impacts due to the video surveillance system are as follows:
- An insurance claim was made by a passenger against MST for $25,000 in July 2008. However, the final settlement was reduced to $2,500 when the party was made aware that MST had video evidence showing what actually happened.
- Coach operators are protected through the use of the video system when false complaints are received against them. In one instance, the video evidence helped MST to prove that the coach operator was not negligent as a passenger claimed.
- In July 2008, a particular vehicle was in the yard on a day that MST received a complaint from a passenger who claimed to be on this particular vehicle. The passenger claimed that he was standing because the bus was full, and ended up hitting his head when he fell down. Similarly, in a separate event, someone claimed that the bus had hit his bicycle even though the bus did not. MST was able to view the videos and prove that the complaints were false. In another incident, a coach operator saw an accident and called the Communications Center to notify them of the accident. 911 was subsequently contacted about the accident. MST received a call the next day from a person claiming that the MST bus was involved in the accident. But, the video evidence helped MST prove that that the claim was not accurate.
- One coach operator, whose actions were captured on video, was proven to be stealing. This operator was terminated. MST was aware that there was a discrepancy in money collection and passenger counting, and was able to investigate those discrepancies using the video monitoring system.
3.3.2.3 Other Impacts of the Surveillance System
MST has developed a good relationship with the local police department and works very closely with them by providing video information captured by the surveillance systems. MST has provided evidence in various criminal activities (e.g., bank robbery, shooting) to local police departments with the help of the surveillance system. Several examples are as follows:
- On Route 41, individuals were caught discharging a weapon and were later identified and apprehended by the police with the help of videos provided by MST.
- MST provided video footage of a bank robbery incident in Marina.
- The local police department in Sand City asked MST for help investigating a specific criminal activity. MST was able to provide the video evidence that showed an individual being beaten. The police were able to identify and apprehend everyone who was involved in the event the next morning.
- Video evidence provided by MST helped keep a Salinas police officer from being suspended. The officer was accused of being involved in an accident, but MST videos proved that the police officer was not involved.
- MST provides vehicles to the local police department for exercises as part of Special Weapons and Tactics (SWAT) training. Videos recorded by MST cameras assist the police in reviewing and critiquing officers' performance in these exercises. This assistance has further strengthened MST's relationship with local police departments.
MST recognizes that passengers realize the presence of the surveillance system and consequently misbehave or vandalize much less on-board MST vehicles or while waiting at MST transit centers. Also, placards on buses notify riders that they are being watched. This is perhaps one of the reasons why the number of rider incidents have decreased since the video system was installed.
Facility security cameras have assisted MST in catching vandals. For example, an individual was caught writing on a camera and was later identified and apprehended.
3.4 Impact on MST Reporting
MST recognizes that a large amount of data is being generated by the ITS systems installed at MST. They have limited resources with which to fully utilize all of the information. All of the deployed systems have reporting capabilities, but many of the canned reports are not very useful. For example, standard reports from the ACS currently (as of August 2008) do not meet the needs of the planning department. The planning staff has to use reports that were developed in-house using Microsoft Access. However, the ACS system provides a few monthly summary reports that are useful in presenting information to the MST Board. The finance and security departments stated that reports from the FAMIS and MMS systems do not meet their needs currently.
MST stated that the National Transit Database (NTD) reporting process has become easier with the presence of ridership data from the ACS. Revenue and boarding information reports are generated for NTD after combining farebox data with ridership information from the ACS. No information was available on the relative difference in the times necessary to produce NTD reports before and after the implementation of the technologies. However, there has been some anecdotal savings. For example, while collecting data for two trips at the same time, two separate people had to go out into the field before the technology implementation. Now one person goes into the field, and the other person counts boardings and alightings by reviewing the recorded on-board videos. Further, MST uses video recordings for verifying and correcting boarding or alighting data while doing triennial surveys.
Even though MST has various reports available to make better decisions from individual systems, the agency believes that a more sophisticated reporting system will be beneficial to all departments. A better reporting system will provide information across all MST systems (e.g., farebox, ACS, MMS and FAMIS) through just one single interface.
As reported in Phase II, MST had hired a consultant to review the information needs of each department and design reports using Microsoft Excel, Crystal Reports and other web-based tools. These new reports were expected to be designed during the fall of 2008. However, they were not yet ready at the time of Phase III evaluation (as of June 2009) and no updated information is available on the impact of the usage of the archived ITS data and data from other systems (e.g., financial system) at MST.
3.5 Impact on Customer Service
As reported in Phase II of the evaluation, MST has developed a customer service database in-house using Microsoft Access. This database, which provides capabilities similar to that of a customized customer service system, allows customer service staff to categorize and track all comments and complaints at any time. Generally, MST resolves most of its complaints within one month. The Customer Service (CS) department assigns each complaint to the appropriate staff based on the category of the complaint via an e-mail. CS staff can either e-mail or send a fax to the customer when the complaint is resolved. Ironically, MST recognized that once it started responding to customer complaints in a timely fashion, it started receiving more complaints.
There are four ways for customers to provide their comments to MST: comments can be submitted on the website, submitted via email, reported via the phone, or reported in-person. Sometimes MST receives complaints in real-time (e.g., unavailability of on-board Internet access). Overall, the CS department receives a variety of comments, feedback, and complaints (e.g., vehicles not leaving on-time, late arrival of a bus, and incorrect on-board next stop announcements).
The CS department has four licenses available to access the ACS. Hence, CS staff can view the real-time location of a vehicle on the ACS to answer customer queries related to the location or arrival time of a vehicle. When the CS staff receives complaints related to an incident, representatives have the ability to playback (on the ACS) where the vehicle was and when in order to investigate the accident. Before the ACS, dispatchers were the only source of information to investigate a complaint. Also, now CS representatives are stationed at CS booths at MST transit centers with direct access to the ACS, meaning that they can provide the public with real-time information
The ACS and the complaints tracking function of the CS database provide the flexibility for MST to reassign duties among the CS staff as needed. Also, CS staff is spending less time answering customer phone calls due to the introduction of other modes of communication (e.g., e-mail and sending messages through the MST website).
Since street supervisors will eventually have access to the ACS remotely on laptops, they will be more proactive in monitoring vehicle performance. MST believes that this capability will help reduce the number of complaints made about on-time performance since this will be constantly monitored in the field as well as at the Communications Center.
MST is planning to include questions regarding technologies in upcoming customer surveys. For example, in the fall of 2007 customer survey, there was a question regarding customers' experience with the new on-board Wi-Fi internet access system. Similarly, questions regarding Google Transit, real-time information signs and online pass sales will be included in future surveys.
Figure 43 shows the layout of the customer service center recently built at the Marina Transit Exchange. The center is equipped with a workstation to access the ACS and other systems as needed. Also there is a workstation for CCTV monitoring from facility cameras.
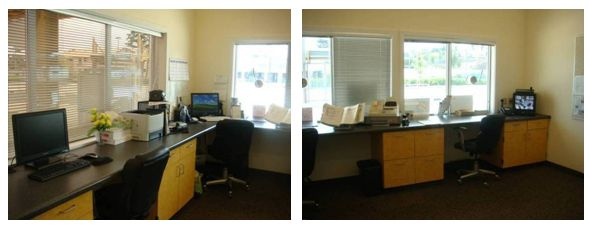
Figure 43. Customer Service Center at Marina Transit Exchange
3.6 Impact on Finance
MST deployed a financial accounting and management system (FAMIS) from Microsoft in 2006. The system, called Microsoft Dynamic NAV (formerly Microsoft Navision), enables MST to manage its financial data (e.g., general ledger, cash management, and management of accounts payable and receivables). Before the FAMIS implementation, MST was using Fleetnet for general accounting. The FAMIS provides the capability to generate reports as needed. However, the current reporting capability will be enhanced in fall of 2008, as stated in Section 3.4
MST is planning to implement a proximity card-based login for coach operators, which eventually will be integrated with the attendance management (DDAM) and payroll systems. This integration will assist MST in automating the whole payroll process since attendance information will be fed directly into the payroll system.
MST was able to raise the pay-to-platform12 ratio to more than 90 percent since the technology (primarily HASTUS and the ACS) implementation. Before this implementation, the pay-to-platform ratio was between 80 percent and 90 percent. Also, there has been a reduction in the number of deadhead (non-revenue) miles since the technology implementation.
Figure 44 shows that revenue has been steadily increasing since 2003 (these figures account for the fare increases that occurred during this timeframe as shown in Figure 9 above). The increase in revenue has been larger since 2005 as MST was able to make better use of the technologies after they stabilized. Also, MST made several operational changes since 2005 (implementing the recommendations from the COA studies).
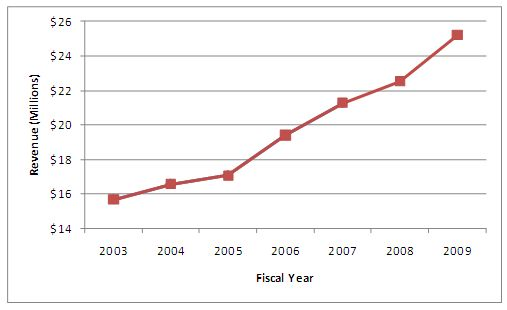
Figure 44. Annual Revenue
Figure 45 shows an increasing trend in revenue per passenger mile over the last 5 years. These statistics indicate MST's increase in revenue along with an increase in ridership since the implementation of technologies. Passenger-mile data for 2008 and 2009 could not be obtained from MST, so updated trend information is not available for revenue per passenger-mile.
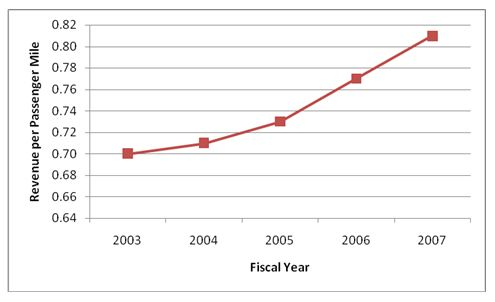
Figure 45. Annual Revenue per Passenger-Mile
3.7 Impact on Management and Administration
3.7.1 Improved Decision Making
The deployment of ITS technologies enables MST to make better decisions now that it has access to factual data from the field which is collected and archived by ITS technologies such as the ACS and video surveillance system. The MST staff is aware of the availability of archived ACS data and video recordings, so customer complaints can be verified before MST reacts to a situation.
Before the technology implementation, MST's primary source of information was mostly coach operators and field supervisors. The information was anecdotal in nature, and often could not be substantiated.
3.7.2 Organizational Improvements
MST managers believe that the implementation of the technologies has allowed them to function more efficiently by facilitating their daily processes. A few examples of these improvements are as follows:
- Runcutting using HASTUS helped MST management recognize that the agency needed a lower number of relief units. Also, buses are serving a larger number of passengers within the same service hours due to more efficient scheduling and runcutting using HASTUS.
- Videos have provided information that defend route and other operational changes. Additionally, on-board and facility cameras have reduced criminal activities that involve MST vehicles or physical facilities. For example, a front-facing camera on an MST bus captured a shooting incident and assisted the local police in identifying and apprehending the criminals. As stated earlier, MST's relationship with the local police departments has improved as MST provides video and other evidence as needed.
- The COA studies conducted for the Monterey Peninsula and Salinas areas used data from the ACS system. Hence, the data collection effort was significantly reduced and temporary staff was not required. Also, the data was more accurate and reliable than that previously collected manually. MST managers believe that they could not have done these studies in the timeframes that they did without the ACS data.
- The technology has helped to identify routes that are not cost effective and are candidates for contractor operation.
3.7.3 Increased Attention towards Future Technology Deployments
The success of technology deployment has facilitated the exploration and consideration of additional technologies for deployment. For example, after the success of the on-board Internet access program on commuter routes, MST is considering the creation of "web stations," which are stops that have wireless internet access. Further, online pass sales have increased since the introduction of on-board internet access.
As mentioned earlier, MST is considering the procurement of a smart card fare collection system, which will improve MST operations by reducing boarding times, facilitating revenue reconciliation, and increasing customer convenience.
Having been impressed with the acceptance of technology by the general public, the MST Board has adopted technology as a priority for the upcoming years to make the overall system and services more attractive to existing and potential riders.
3.7.4 Change in Resources
There have been some changes in resources since the technology implementation. First, an Information Technology (IT) director position was added and then a mechanic was reassigned as an ITS technician.
There have not been any reductions in operations staff, as additional staff was needed to monitor the ACS during regular service hours. Also, staff was needed to analyze the data being generated by the ACS in order to consider potential operational improvements.
3.7.5 Return on Investment
While there are no quantitative figures to provide an actual return on investment from the technologies, MST provided the following rough estimates:
- The implementation of HASTUS has resulted in a $1 million savings annually due to its ability to incorporate contractually required items, such as meal and rest breaks, for coach operators in daily schedules.
- MST managers believe that coach operator productivity has increased. Further, they feel that HASTUS runcutting has improved the pay-to-platform ratio.
- Video evidence from the surveillance system has helped MST reduce the number of false claims.
- The requirement for peak period vehicles has been reduced since the implementation of the ACS and HASTUS. As mentioned earlier, after retiring 17 buses, only 15 were needed as replacements.
- The implementation of maintenance software has improved inventory control and other functions such as warranty tracking.
- It is estimated that the implementation of the payroll system has resulted in up to $15,000 in savings per year.
- MST stopped using compressed natural gas (CNG) buses since the operating cost per hour for CNG buses was much higher than that for diesel buses. The average miles per gallon (mpg) for CNG was 1.4, while it was 5 mpg for diesel.
3.8 Impact on Customer Satisfaction
The Monterey-Salinas Transit (MST) Intercept Surveys were conducted to explore travel behavior and assess the perceptions of transit users at the Monterey Transit Plaza and Salinas Transit Center as they relate to the understandability and usefulness of the technology and sources of travel-related information. The following section describes the survey development and administration process followed by a discussion of the main findings of the survey.
The surveys were conducted to address the secondary hypothesis that the project will result in improved customer satisfaction. While an increase in customer satisfaction could not be directly measured (due to the absence of "before" data), this survey was developed to specifically to gain an understanding of MST rider's perceptions of the:
- On-board automated announcements (for bus stop information);
- Real-time traveler information in transit centers;
- Automated trip planning on Website;
- Bus schedule information sources;
- Reported use of future technologies for schedule information; and
- Overall satisfaction with the MST bus service.
The survey was designed to be easily completed in just a few minutes with a surveyor offering respondents the choice to have the survey read to them or to be self-administered. The survey was composed of multiple choice/check boxes and contained only 18 items, allowing for quick completion and minimizing the impact on commuters' time. The survey was also translated into (or administered in) Spanish, since in some areas MST provides transit services to persons who primarily speak Spanish.
On-site surveyors surveyed patrons who agreed to participate and met the following criteria:
- They were 16 years or older;
- They had not already completed a survey;
- They had seen the new signs (for Salinas Transit Center riders only); and
- They were boarding the bus at either the Monterey Transit Plaza or Salinas Transit Center.
A total of 805 surveys was completed; with 404 at the Monterey site and 401 at the Salinas site. This total exceeded the estimated sample size of 566 needed (the number who declined to participate was modest). The estimates for sample size were derived from the most recent passenger counts for the month of September. At the Monterey Transit Plaza, 26,566 passengers (or an average of 885 per day) boarded at the three (Pearl, Tyler, and Munras) boarding areas. At the Salinas Transit Center, 39,952 passengers (or about 1,331 per day) boarded at the eight gates. Using the average daily boarding rates at these locations it was determined a total of 566 surveys (268 at Monterey and 298 at Salinas) would be necessary to achieve a 95 percent confidence level (with a 5 percent confidence interval). This represented approximately 25 percent of the total daily boardings.
3.8.1 Survey Administration Process
Surveyors were identified by badges displaying the word "Surveyor" and bearing the MST logo. At each location, customers were approached by a surveyor, invited to participate, and made aware of participation incentives. Riders who declined to participate were thanked, and no further effort was made; however, the decline rate was modest. All participants were given the option of completing the survey in either Spanish or English. After completion of the survey, participants were offered three dollars in food vouchers at a local fast food restaurant for their participation.
Surveys were conducted mid-week (Tuesday and Wednesday) during peak travel periods. Morning surveys were administered between 7:00 a.m. and 11:00 a.m. at each location. Afternoon surveys were administered between 3:00 p.m. to 7:00 p.m. at the Monterey Transit Plaza. At the Salinas Transit Center, afternoon surveys were administered between 3:00 p.m. and 6:00 p.m. on Tuesday and between 2:00 p.m. and 6:00 p.m. on Wednesday (due to the absence of a security guard after 6:00 p.m.).
Surveyor training was conducted on Monday, September 14, 2009. Five bilingual surveyors and one field supervisor were stationed at the Salinas Transit Center during each survey period. Five surveyors and one field supervisor staffed the Monterey Transit Plaza as well, although only two morning surveyors and three afternoon surveyors were bilingual. The staffing service providing the surveyors at the Monterey Transit Plaza was not able to provide additional bilingual surveyors, resulting in the use of some English-only survey personnel.
The results presented in this section include comparisons between respondents in Monterey and Salinas. Generally, the results show a high level of agreement between Monterey Transit Plaza and Salinas Transit Center rider responses, especially in terms of their level of confidence in the bus arrival times.
As shown in Figure 46 the majority (90 percent) of riders were waiting for one of seven buses in Monterey. Almost two-thirds were waiting to travel on routes 9, 10, and 20. While in Salinas, shown in Figure 47, 98 percent of the riders were waiting for one of nine routes and the frequency was more evenly distributed among the routes.
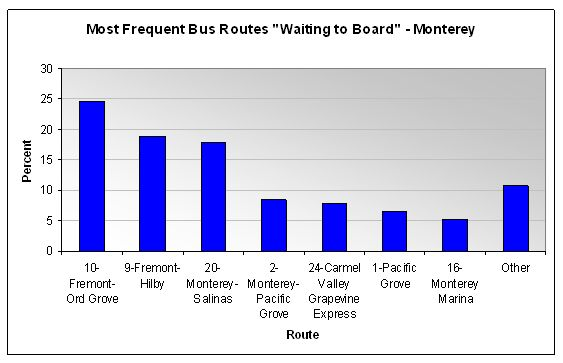
Figure 46. Most Frequently Reported Buses Respondents Were Waiting to Board - Monterey
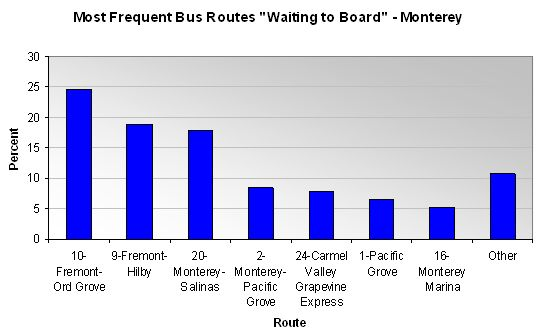
Figure 47. Most Frequently Reported Buses Respondents Were Waiting to Board - Salinas
3.8.2 Respondent Characteristics
3.8.2.1 Respondent Demographics
As shown in Figure 48, the majority of the transit users who responded to the survey were in the youngest age group (e.g., 16-25); this was consistent for both Monterey and Salinas respondents. Slightly higher proportions of the Salinas respondents were in the 26-35 and 36 to 45 age groups with approximately one-third of Salinas respondents in these age groups and one-fourth of the Monterey respondents. Approximately one-fourth of all respondents were aged 46 or older.
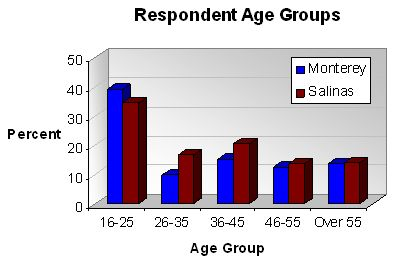
Figure 48. Respondent Age Group by Location
Distribution by gender is shown in Figure 49. As shown, for each location there was a slight majority of male respondents; however, the proportion of males and females was essentially identical for Monterey and Salinas respondents.
When considering the primary language spoken at home (see Figure 50), a much higher proportion of the Salinas respondents reported Spanish as their primary language, compared to the Monterey respondents (44 percent and 29 percent, respectively). While a number also reported "Other," these were primarily reported by only one to three respondents and represented a broad range of languages including Filipino, Indian, Japanese, and Russian, among others.
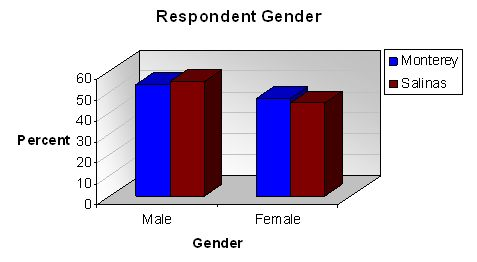
Figure 49. Respondent Gender by Location
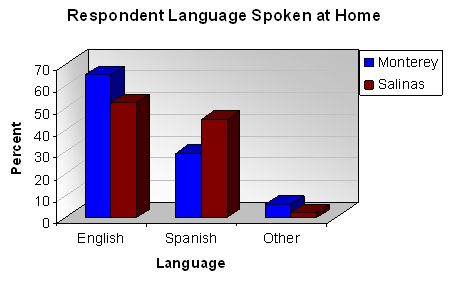
Figure 50. Primary Language Spoken by Location
3.8.2.2 Transit Use Characteristics
Figure 51 and Figure 52 summarize respondents' use of the buses and most frequent reasons for transit use. As shown in Figure 6, a much higher proportion (68 percent) of Monterey respondents reported riding the bus 5 or more days per week than their Salinas counterparts (50 percent). In fact, Salinas riders have a more varied pattern, with almost one-third riding the bus only 1 to 4 days per week and approximately one-fifth riding only a few times per month.
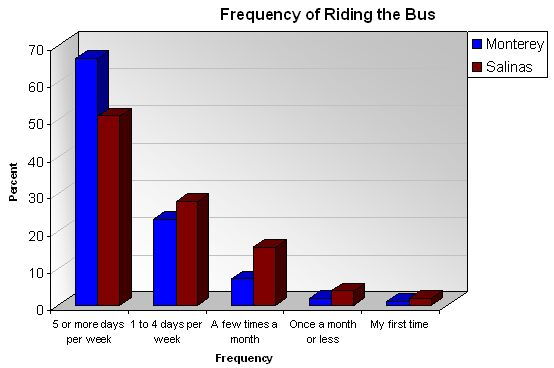
Figure 51. Bus Riding Frequency by Location
Riders' bus riding frequency could be related to their reported reasons for riding the bus (see Figure 52). Almost eight in ten of Monterey respondents reported they ride the bus to commute either to work or school, with "errands" and "other" reasons showing a much lower percentage. This might explain their more frequent and more regular bus usage. However, for Salinas respondents, their bus riding pattern appears to be less routine when considering all the queried reasons. Approximately 50 percent of Salinas respondents report they commute to work or school, but roughly one-third also report riding the bus to "run errands," a much higher proportion than Monterey respondents. This might also help explain the differences between the two respondent groups regarding frequency of use; the Salinas respondents' lower rate of bus riding could be due to the non-routine nature of their need to run errands, rather than regular commuting patterns. The reasons given as "other" (see Figure 53) also showed that Salinas respondents, more so than the Monterey riders, tended to use the bus for appointments (primarily medical), for visiting family and/or friends, and to "get around." It would appear that Salinas riders rely much more on the bus system than private vehicles for local travel.
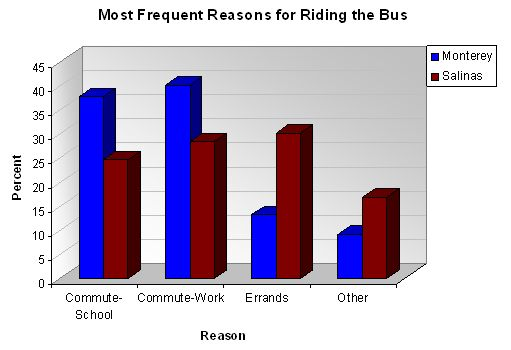
Figure 52. Reasons for Riding the Bus by Location
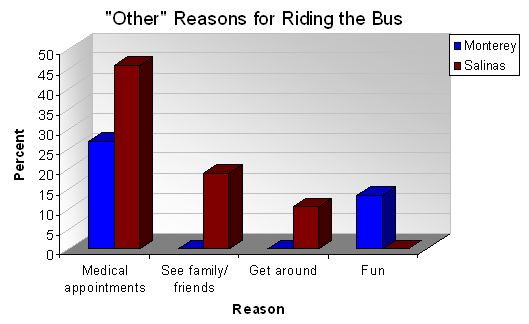
Figure 53. "Other" Reasons for Riding the Bus by Location
3.8.3 Survey Findings
3.8.3.1 Schedule Information Sources
As shown in Figure 54, there was a consistent pattern across all respondents regarding the sources used for schedule information. This consistency was also evident between the Monterey and Salinas respondents. By an overwhelming majority, respondents reported they used the Printed Schedule/Riders Guide (overall, 64 percent) when compared to the alternative choices: the MST website or calling Customer Service.
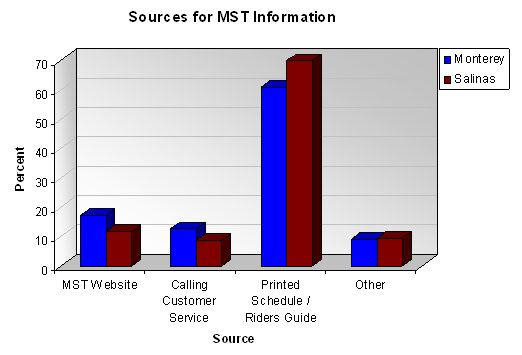
Figure 54. Sources Used to Obtain MST Schedule Information by Location
This pattern of responses could be seen as somewhat surprising, owing to the proportion of respondents who reported they had the internet available at their homes. As shown in Figure 55, almost two in three Monterey respondents and almost one in two Salinas respondents reported having internet access. It could be that bus riders who ride the same routes regularly (especially for the Monterey commuters), do not feel the need to check schedules based on their experience with the system and their specific route patterns. They may view using the internet as a source to check primarily for schedules on routes they normally do not ride.
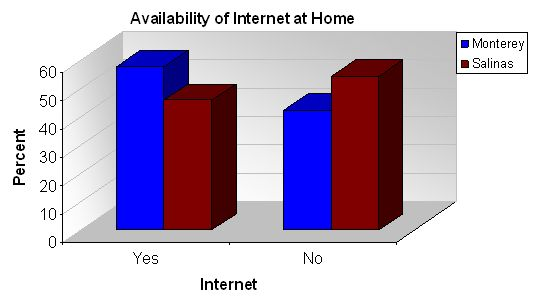
Figure 55. Availability of the Internet at Home
When considering internet availability by sources used (see Figure 56) this pattern is still evident. Even though approximately half of the respondents from each location indicate they have internet access at home, less than one-fifth of those with access report having visiting the MST website. It also seems apparent that those without internet access rely much more on the Printed Schedule/Riders Guide (almost 80 percent) than those with access (60 percent), although both groups' use of the printed material is very high.
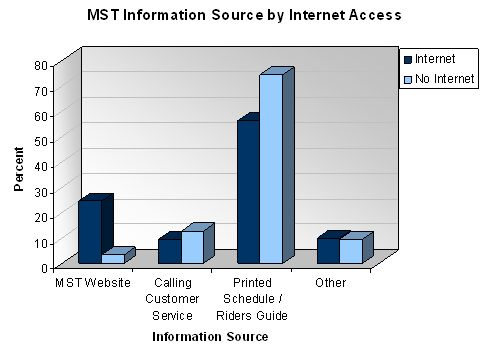
Figure 56. Schedule Information Sources by Internet Access
As depicted in Figure 57, while visits to the MST website are reported at relatively low rates, it does appear that respondents in the younger age groups are more apt to use the MST website. Almost one-fifth of those in the 16-25 and 26-35 year old age groups reported accessing the site. This pattern is almost reversed for use of the Printed Schedule/Riders Guide, with the older age groups reporting use of this source (though, again, this source is the overwhelming source of schedule information).
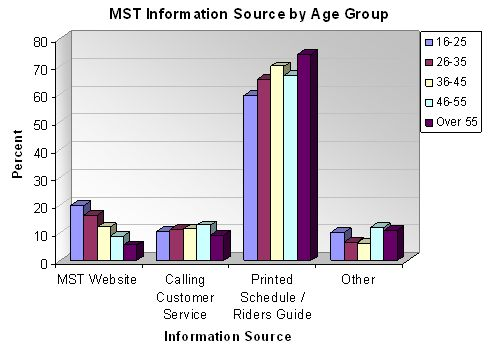
Figure 57. Schedule Information Sources by Age Group
Also, when considering information source by language, as shown in Figure 58, it appears that riders whose primary language is English report greater use of the MST website than Spanish speakers. Conversely, Spanish speaking riders show a higher proportion of use of the Printed Schedule/Riders Guide. The other sources, while reported by a much smaller proportion of riders, show no real difference by language.
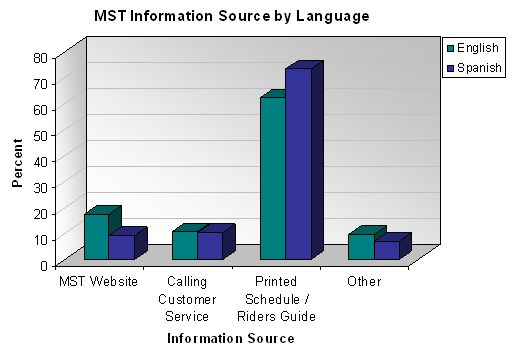
Figure 58. MST Information Source by Language
These results could be explained when examining internet access by the primary language reported spoken at home. As shown in Figure 59, the proportion of those who have internet access and those who do not is related to language. In fact, the proportions are essentially inverse; 60 percent of English speakers report having internet access, while essentially the same proportion of Spanish speakers report not having internet access at home.
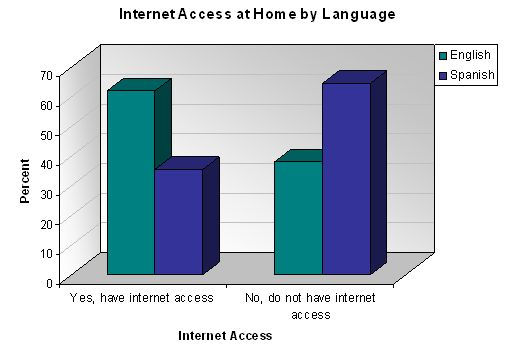
Figure 59. Internet Access by Primary Language Spoken at Home
These preferences (or non-preferences) for non-internet sources are also evident when considering respondents' use of the automated trip planning feature (see Figure 60). As seen, very few (14 percent) of the respondents used this feature; this included 12 percent of the Monterey respondents and 15 percent of the Salinas respondents. In fact, 28 percent of riders who used the automated trip planning feature regularly use the MST website as their information source; whereas 45 percent of those used this feature reported they use the printed materials as their primary information source.
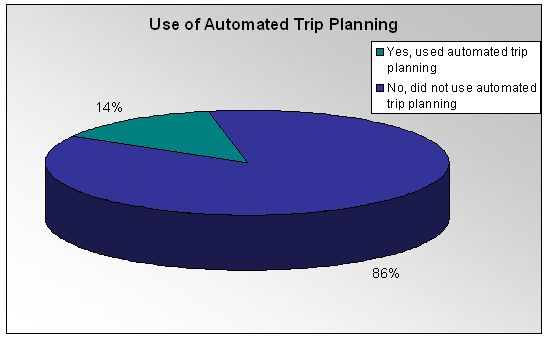
Figure 60. Respondents Use of the Automated Trip Planning Feature
3.8.3.2 Information Preferences
As shown in Figure 61, respondents at both locations overwhelmingly reported they would like to receive both arrival and departure times at the plaza/center. This finding is interesting since, at present, the Monterey Transit Plaza does not yet have the capability to present that information. However, at Salinas, where the electronic signs are in place, seven out of ten indicated they would like to see departure information in addition to the arrival information.
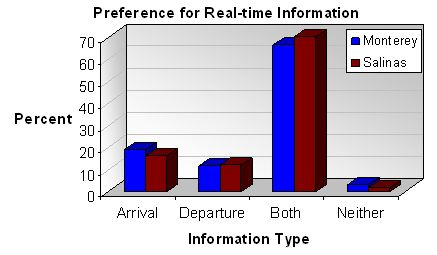
Figure 61. Preference for Arrival/Departure Information
Respondents from Salinas seemed to be very confident in the arrival times displayed on the electronic signs. As shown in Figure 62, approximately three-fourths of respondents reported they were "sure" or "very sure" of the arrival times. Less than 20 percent reported being "unsure" or "very unsure."
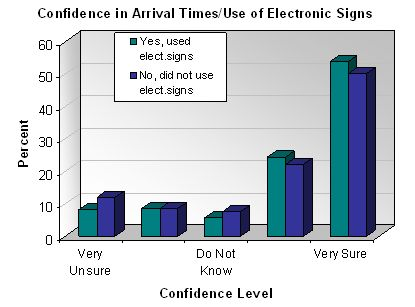
Figure 62. Confidence in Bus Arrival Times Using Electronic Signs (Salinas only)
As Figure 63 shows, use of the electronic signs is relatively stable by frequency of bus use. While it may have been expected that riders who rode the bus infrequently might use the signs more (based on their inexperience with the routes/schedules), it appears that almost two-thirds of riders use the signs across all levels of bus use. This is especially true for riders who use the bus 1 to 4 days per week and for those using the bus "for the first time."
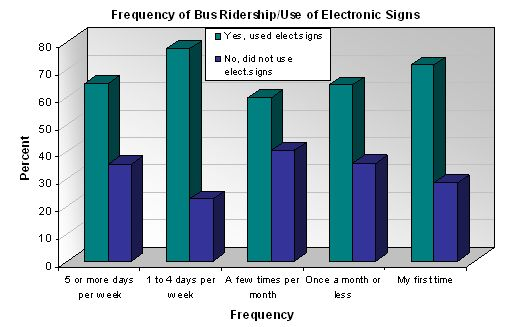
Figure 63. Use of Electronic Signs by Bus Use Frequency (Salinas only)
When considering riders' primary language, it appears that usage is very similar for riders who report speaking English or Spanish at home (see Figure 64). In fact, a slightly higher proportion of Spanish speaking riders use the electronic signs.
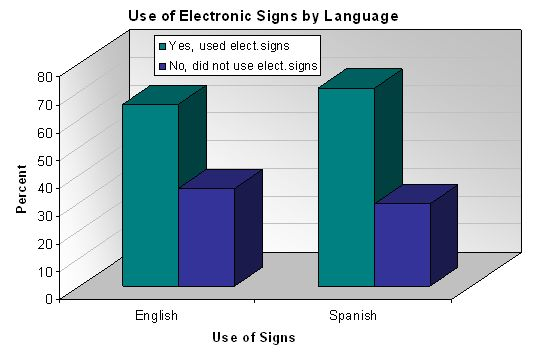
Figure 64. Use of Electronic Signs by Primary Language (Salinas only)
3.8.3.3 Confidence in Bus Arrival Times
When considering riders' ratings of the confidence they have in the arrival times, they responded very positively. As Figure 65 shows, almost 80 percent said they were "somewhat sure" or "very sure" of the arrival times. This level of confidence was consistent at both Monterey and Salinas, though the Salinas riders reported a slightly higher rating of "very sure." Analysis showed no difference in confidence by location (t = 0.67; p<.51).
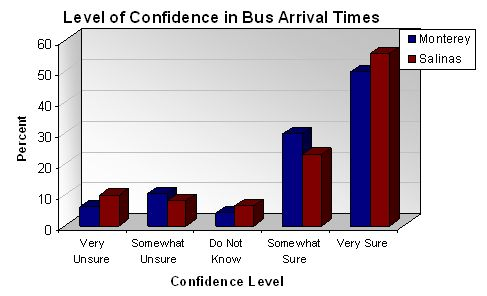
Figure 65. Confidence Level in Bus Arrival Times by Location
In addition, when examining riders' level of confidence, it appears that it is high regardless of how often they ride the bus and the reasons for riding the bus. Figure 66 shows riders' level of confidence based on their frequency of bus use. As shown, the level of confidence is consistent (and high; nearly 80 percent) whether they ride the bus "5 or more days per week" or "once a month or less." For first time riders, this proportion is somewhat less; approximately 75 percent reported they were "somewhat sure" and one-fourth reported being "very unsure." However, these riders represented less than two percent of the respondents.
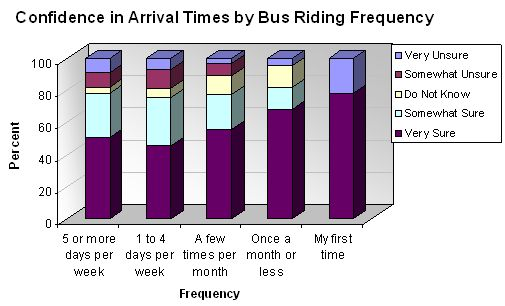
Figure 66. Confidence Level in Bus Arrival Times by Riding Frequency
Similarly, when examining the confidence in arrival times based on the reason for riding the bus (Figure 67), confidence also appears very high. Between 70 and 76 percent of riders report being "somewhat sure" or "very sure" of the arrival times. It does appear, however, that riders who commute to go to school, show slightly lower levels of confidence, with 15 percent reporting they were "somewhat unsure" of the arrival times.
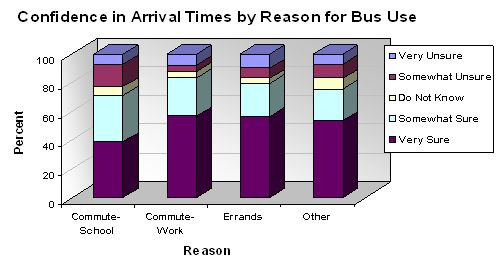
Figure 67. Confidence in Bus Arrival Times by Reason for Riding the Bus
Consistency of riders' confidence levels was also obtained when considering the sources of schedule information they used (Figure 68). As the figure illustrates, few riders were unsure of arrival times - the overwhelming majority reported they were "somewhat sure" or "very sure." Responses of "very sure" were consistently near or slightly above 40 percent those who reported "somewhat sure" also showed high degrees of consistency, though riders who used the MST Website reported slightly higher levels of being "somewhat sure."
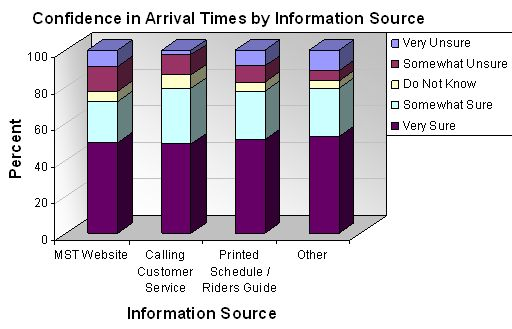
Figure 68. Confidence in Bus Arrival Times by Schedule Information Source
Finally, when considering only Salinas riders, comparisons of confidence level by use of the electronic signs showed essentially no difference, as depicted in Figure 69. The proportion of riders who reported being "somewhat sure" and "very sure" was essentially identical for those who used the electronic signs and those who did not. Further analysis showed the difference in confidence level was not significant (t = 1.12; p < .24).
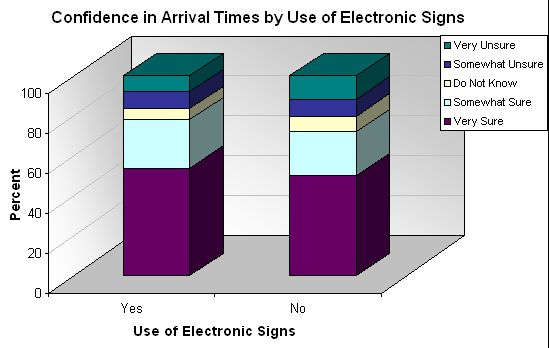
Figure 69. Confidence in Bus Arrival Times by Use of Electronic Signs (Salinas only)
3.8.3.4 Overall Satisfaction with MST
When considering riders' overall satisfaction with the MST, riders from both Monterey and Salinas report high levels of satisfaction across many attributes of the MST (see Figure 70). Approximately 70 percent of riders from both Monterey and Salinas report they are "satisfied" or "very satisfied" with the system's on-time performance, ease of making transfers, frequency of service, hours of service, and number of routes served. Furthermore, only between 10 and 13 percent report being "unsatisfied" or "very unsatisfied" with these aspects of the system.
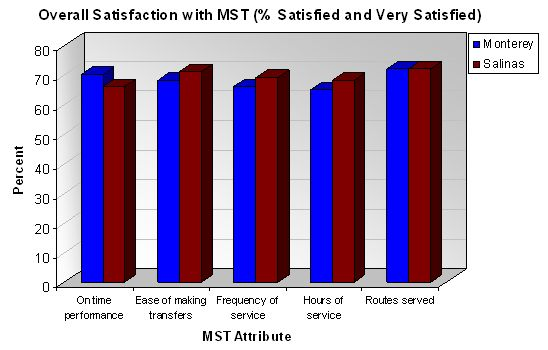
Figure 70. Overall Satisfaction with MST Attributes
When considering the most frequently traveled routes in Salinas (see Figure 71) riders' average ratings across all the aspects are very high, hovering near a value of 4.13 Of the 11 routes examined, the ratings of 9 routes are either equal to or greater than 4.
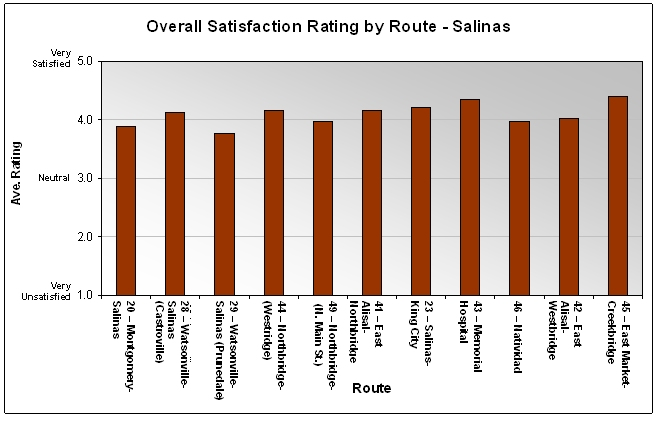
Figure 71. Overall MST Satisfaction Ratings by Route – Salinas
Similar findings were obtained for the most frequently ridden routes in Monterey (see Figure 72). All overall mean ratings were near 4 (using the same scale) and for the seven routes included, five were equal to or greater than 4.
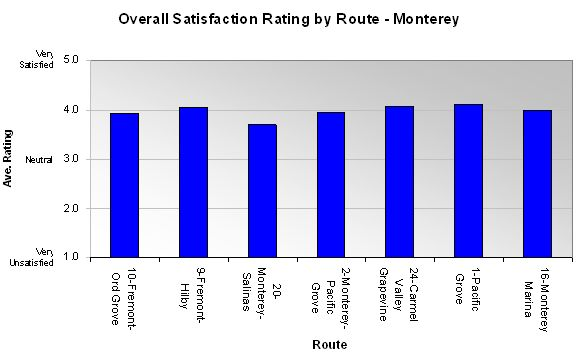
Figure 72. Overall MST Satisfaction Ratings by Route – Monterey
Similarly, as shown in Figure 73, when queried about various attributes of the automated stop announcement, riders reported high levels of agreement that the announcement was loud enough, helped them find their stops, and gave them enough time to get ready before the stop. These results were consistent across both locations and the levels of agreement were consistently in the 70 to 75 percent range.
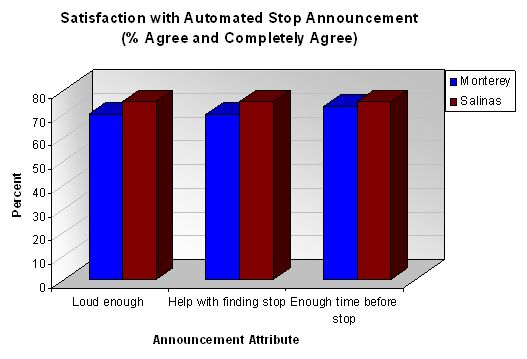
Figure 73. Riders' Agreement with Automated Stop Announcement Attributes
Finally, the Salinas riders were asked to rate the performance of the electronic signs. As shown in Figure 74, again, agreement with the attributes of the signs was high, with approximately three-fourths responding that they "somewhat agree" or "completely agree."
This rating was consistent for the signs' usefulness, accuracy, ease of understanding, and displaying the bus status information.
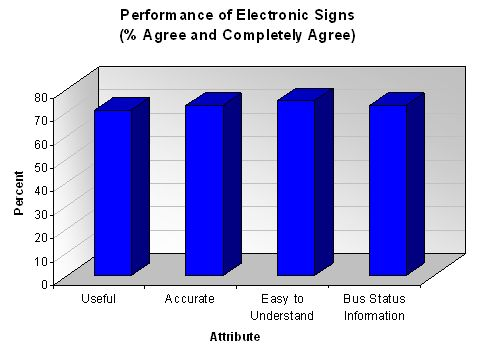
Figure 74. Riders' Agreement with Attributes of Electronic Signs (Salinas only)
3.8.3.5 Future Use of Technology
When asked if they would use real time bus information if offered, riders in Monterey and Salinas overwhelmingly said they would use the information, with almost two-thirds responding favorably (see Figure 75). This finding is consistent with riders' previous responses concerning their reported use of electronic signs in Salinas and the Monterey riders' indicating they would use electronic signs. That a majority of riders have confidence in the system information currently available might reflect that riders would like as much information as possible to plan their trips. However, reflecting their current use and reliance on paper schedules, slightly over one-third of riders indicated they would not use real time bus information if offered.
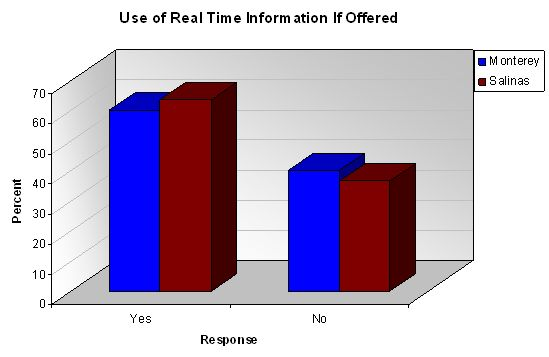
Figure 75. Use of Real Time Bus Information by Location
Finally, when queried how they would like to get transit information, by technology type (see Figure 76), most riders, especially in Monterey, indicated they would prefer electronic signs at the bus stops. Riders were asked to "check all that apply" for this item and as seen in the figure below, approximately one-fourth of Monterey riders and one-third of Salinas riders would use the internet on a mobile device and the internet in general. This is somewhat surprising due to the current low proportion of riders who currently use the internet for bus information. A slightly lower proportion also indicated they would use electronic signs within the information booths. Monterey riders were relatively consistent in their preferences for technologies besides electronic signs at bus stops, in fact indicating they would also use smart cards for fare payment. The proportion of Monterey riders willing to use this last technology was more than double the riders in Salinas. Perhaps these patterns are reflective of Salinas riders' experience with the electronic signs and their comfort (and possible reliance) on the information from the signs.
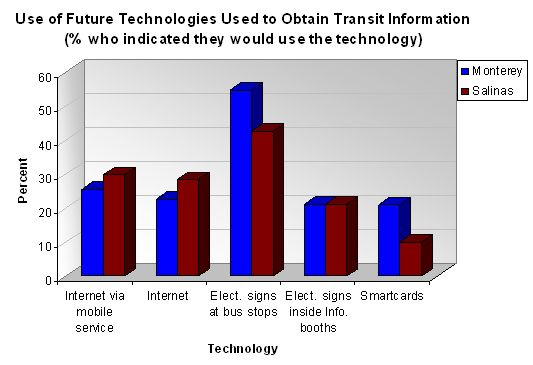
Figure 76. Use of Future Technologies to Access Transit Information/Services
3.8.4 Summary of Key Findings
The survey was conducted to gain insights into:
- Overall satisfaction with the MST bus service;
- On-time performance;
- On-board automated announcements [for bus stop information];
- Real-time traveler information in transit centers;
- Automated trip planning on Website;
- Bus schedule information sources; and
- Reported use of future technologies for schedule information.
Overall satisfaction with MST was highly rated by a majority of riders at both locations, with riders at both locations providing ratings that averaged a score of 4 out of a possible 5. On-time performance perceptions of MST service by riders at both locations overwhelmingly showed that they were "somewhat sure" or "very sure" of bus arrival times - this was true in Salinas where riders had access to information using the electronic signs as well as Monterey where the electronic signs were not available. This high level of satisfaction was also found for riders across all levels of bus use frequency, types of scheduling information used, and their reasons for using the bus.
When considering the characteristics of those riders who responded they were "very sure," the data suggest that riders at both locations were "satisfied" or "very satisfied" in terms of the system's on-time performance, frequency of service, hours of service, and routes served. They were, however, somewhat less satisfied with the ease of making transfers. When considering the Salinas riders who reported high levels of confidence in the arrival times, they tended to:
- Be male
- Have used the electronic signs;
- Ride the bus 5 or more days per week; and
- Less likely to have used the Printed Schedules.
Monterey riders who were "very sure" tended to:
- More frequently be in the 26-35 year old age group and
- More likely to use the MST website for information.
Findings for the automated stop announcement also showed that riders were also very positive in their views; 7 out of 10 (from both locations) reported they "agree" or "completely agree" that the announcements were loud enough, helped them find their stop, and gave them enough time to get ready before the stop.
The real-time information displayed on the electronic signs at Salinas was found to be useful, accurate, easy to understand, and kept riders informed about the status of their buses for almost three-fourths of Salinas riders using the electronic signs. In addition, when queried about the type of information they would like to see displayed, respondents at both locations overwhelmingly reported they would like to receive both arrival and departure times at the plaza/center.
Use of the automated trip planning feature on the MST Website was only reported by 14 percent of the respondents, perhaps due to the low proportion of respondents who used the MST website as a source for bus schedule information.
In fact, when reviewing the bus schedule information sources used, results showed that riders from both locations overwhelmingly reported using the Printed Schedule/Riders Guide over the other sources (over 60 percent). Monterey riders show slightly higher rates of MST website use, though even those with internet access rely on the printed information.
In terms of future technologies, two-thirds of respondents at both locations indicated they would use real-time information if it were offered. In addition, approximately one-fourth said they would use the internet via a mobile device or at home, a higher proportion than report using it now. Most respondents reported they would prefer to get information at electronic signs at the bus stops and another one-fourth would like to see information on electronic signs inside the information booths. Finally, few respondents (especially in Salinas) reported they would use Smartcards.
3.8.5 Conclusions
In general, a majority of riders reported they were satisfied with the overall bus service and on-time performance of MST. Riders were also very positive in their views of the automated stop announcement as 7 out of 10 (from both locations) reported they "agree" or "completely agree" that the announcements are loud enough, help them find their stop, and give them enough time to get ready before the stop. While use of the real-time information was reported by a vast majority of Salinas riders and was found to be useful, accurate, easy to understand, and kept riders informed about the status of their buses, there was a preference at both locations for both arrival and departure information to be displayed. Interestingly, while internet access at home was available for approximately half of the riders, the automated trip planning feature was found to be used by only fourteen percent of respondents and almost three-fourths indicated they used the Printed Schedule/Riders Guide as their source of schedule information. Interestingly, when queried about use of other technologies in the future, one-fourth said they would access the internet (either using a computer or a mobile device). Consequently, although a majority of riders appear to be satisfied with many aspects of the MST bus service, it appears that many of the riders are not yet making use of the benefits of (or have access to) the most recent MST technological advances such as real-time travel information and automated trip planning.
9 MST ridership is the highest in the summer season due to tourism and is the lowest during the school season.
10 Buses arriving three minutes or more after the scheduled arrival time were considered late in FY 2004
11 Buses arriving five minutes or more after the scheduled arrival time were considered late in FY 2007.
12 Pay-to-platform ratio refers to the ratio of the number of pay hours to the number of platform hours. The number of pay hours refers to the total number of hours a coach operator gets paid for including regular hours and overtime. The number of platform hours refers to the time spent by a transit vehicle in service between vehicle pull-in and pull-out.
13 The scale used for this item included the following values: 1=Very Unsatisfied, 2=Unsatisfied, 3=Neutral, 4=Satisfied, and 5=Very Satisfied.
